false--12-31FY20180001703644YesfalseLarge Accelerated FilerfalsefalseNoYesP9MP3YP1Y2021-12-092021-05-092021-07-092021-10-092025-11-062020-09-092019-08-092021-05-092021-01-092020-12-092021-07-092020-07-092021-04-092027-02-012020-05-092020-10-092021-10-092021-12-182021-11-092021-08-092020-09-092019-04-092020-01-092021-01-092021-05-092021-10-092021-02-092022-01-092021-12-092021-11-092020-11-092023-01-092021-05-092020-12-092021-12-092020-07-092022-01-092019-11-092019-12-092020-08-092021-09-092020-07-092020-09-092021-09-092021-07-092021-04-092021-12-092021-05-092021-04-092021-04-092020-08-092021-10-092026-03-062020-09-092020-08-092021-05-092021-10-092020-09-092019-12-092020-01-092019-12-092021-06-092019-07-092020-10-092021-02-092021-05-092021-11-092022-01-092020-03-092020-08-132021-01-092021-02-092020-05-092020-10-092020-05-092021-10-092021-12-092021-08-092020-12-092021-01-092019-10-092021-07-092020-08-092021-03-092021-12-092020-01-092019-11-092020-12-092021-07-092021-01-092020-07-092020-07-090.010.01450000000450000000432351034362117443235103436211740.0501610.04884960.0390.04070.04070.04210.0490.08750.03780.05130.04450.0360.0450.05150.0470.04380.0270.02930.02850.0350.05150.0370.0450.04380.04070.03870.04770.03750.04540.04150.04240.02920.04050.03420.02990.0410.04440.04850.04270.05250.02850.04150.03650.02930.03550.04290.03150.0360.03250.03250.04450.03250.0420.04770.0350.04070.03950.04550.04650.04750.03550.07760.04450.04750.0350.0350.02950.04050.0950.0330.03780.050.04050.0440.03240.0290.03750.0410.0390.04550.0340.0420.04050.0320.0590.03250.03650.04210.0480.03870.03341M Libor1M Libor1M Libor1M Libor1M Libor1M Libor1M Libor1M Libor1M Libor1M Libor1M Libor1M Libor1M Libor1M Libor1M Libor1M Libor1M Libor1M Libor1M Libor1M Libor1M Libor1M Libor1M Libor1M Libor1M Libor1M Libor1M Libor1M Libor1M Libor1M Libor1M Libor1M Libor1M Libor1M Libor1M Libor1M Libor1M Libor1M Libor1M Libor1M Libor1M Libor1M Libor1M Libor1M Libor1M Libor1M Libor1M Libor1M Libor1M Libor1M Libor1M Libor1M Libor1M Libor1M Libor1M Libor1M Libor1M Libor1M Libor1M Libor1M Libor1M Libor1M Libor1M Libor1M Libor1M Libor1M Libor1M Libor1M Libor1M Libor1M Libor1M Libor1M Libor1M Libor1M Libor1M Libor1M Libor1M Libor1M Libor1M Libor1M Libor1M Libor1M Libor1M Libor1M Libor1M Libor1M Libor1M Libor1M Libor1M Libor0.010.0150000000500000001000100010001000P3Y5496700039302000
0001703644
2018-01-01
2018-12-31
0001703644
2019-02-26
0001703644
2018-06-30
0001703644
2018-12-31
0001703644
2017-12-31
0001703644
2017-01-01
2017-12-31
0001703644
2016-01-01
2016-12-31
0001703644
us-gaap:CommonStockMember
2018-12-31
0001703644
us-gaap:CommonStockMember
2017-01-01
2017-12-31
0001703644
us-gaap:CommonStockMember
2017-12-31
0001703644
us-gaap:AccumulatedDistributionsInExcessOfNetIncomeMember
2017-12-31
0001703644
us-gaap:AccumulatedOtherComprehensiveIncomeMember
2017-01-01
2017-12-31
0001703644
us-gaap:AccumulatedDistributionsInExcessOfNetIncomeMember
2018-01-01
2018-12-31
0001703644
us-gaap:AdditionalPaidInCapitalMember
2016-01-01
2016-12-31
0001703644
us-gaap:AdditionalPaidInCapitalMember
2015-12-31
0001703644
us-gaap:AccumulatedOtherComprehensiveIncomeMember
2017-12-31
0001703644
us-gaap:CommonStockMember
2018-01-01
2018-12-31
0001703644
us-gaap:CommonStockMember
2016-12-31
0001703644
us-gaap:AccumulatedDistributionsInExcessOfNetIncomeMember
2017-01-01
2017-12-31
0001703644
us-gaap:AdditionalPaidInCapitalMember
2018-01-01
2018-12-31
0001703644
us-gaap:AccumulatedOtherComprehensiveIncomeMember
2016-12-31
0001703644
us-gaap:AdditionalPaidInCapitalMember
2017-01-01
2017-12-31
0001703644
us-gaap:AdditionalPaidInCapitalMember
2018-12-31
0001703644
2015-12-31
0001703644
us-gaap:AdditionalPaidInCapitalMember
2016-12-31
0001703644
us-gaap:AccumulatedOtherComprehensiveIncomeMember
2016-01-01
2016-12-31
0001703644
us-gaap:CommonStockMember
2015-12-31
0001703644
us-gaap:RetainedEarningsMember
2017-01-01
2017-12-31
0001703644
2016-12-31
0001703644
us-gaap:AccumulatedOtherComprehensiveIncomeMember
2018-12-31
0001703644
us-gaap:AccumulatedOtherComprehensiveIncomeMember
2018-01-01
2018-12-31
0001703644
us-gaap:RetainedEarningsMember
2018-12-31
0001703644
us-gaap:RetainedEarningsMember
2016-01-01
2016-12-31
0001703644
us-gaap:AccumulatedDistributionsInExcessOfNetIncomeMember
2015-12-31
0001703644
us-gaap:RetainedEarningsMember
2018-01-01
2018-12-31
0001703644
us-gaap:AdditionalPaidInCapitalMember
2017-12-31
0001703644
us-gaap:AccumulatedDistributionsInExcessOfNetIncomeMember
2018-12-31
0001703644
us-gaap:AccumulatedOtherComprehensiveIncomeMember
2015-12-31
0001703644
us-gaap:RetainedEarningsMember
2015-12-31
0001703644
us-gaap:RetainedEarningsMember
2017-12-31
0001703644
us-gaap:AccumulatedDistributionsInExcessOfNetIncomeMember
2016-12-31
0001703644
us-gaap:RetainedEarningsMember
2016-12-31
0001703644
2017-11-01
2017-11-01
0001703644
2017-06-28
0001703644
us-gaap:PreferredStockMember
2017-01-01
2017-12-31
0001703644
us-gaap:CommonStockMember
2017-01-01
2017-12-31
0001703644
us-gaap:OtherAssetsMember
2017-12-31
0001703644
us-gaap:AccruedLiabilitiesMember
2017-12-31
0001703644
us-gaap:LoansReceivableMember
2018-12-31
0001703644
gpmt:RestrictedCashAndCashEquivalentsMember
2018-12-31
0001703644
us-gaap:AccruedIncomeReceivableMember
2018-12-31
0001703644
us-gaap:LiabilitiesTotalMember
2018-12-31
0001703644
us-gaap:AssetsTotalMember
2018-12-31
0001703644
us-gaap:LiabilitiesTotalMember
2017-12-31
0001703644
us-gaap:AssetsTotalMember
2017-12-31
0001703644
us-gaap:AccruedLiabilitiesMember
2018-12-31
0001703644
us-gaap:BorrowingsMember
2018-12-31
0001703644
us-gaap:LoansReceivableMember
2017-12-31
0001703644
us-gaap:BorrowingsMember
2017-12-31
0001703644
us-gaap:AccruedIncomeReceivableMember
2017-12-31
0001703644
gpmt:RestrictedCashAndCashEquivalentsMember
2017-12-31
0001703644
us-gaap:OtherAssetsMember
2018-12-31
0001703644
srt:MultifamilyMember
2018-12-31
0001703644
srt:HotelMember
2017-12-31
0001703644
srt:OfficeBuildingMember
2018-12-31
0001703644
srt:HotelMember
2018-12-31
0001703644
srt:RetailSiteMember
2017-12-31
0001703644
srt:MultifamilyMember
2017-12-31
0001703644
srt:OfficeBuildingMember
2017-12-31
0001703644
srt:RetailSiteMember
2018-12-31
0001703644
srt:IndustrialPropertyMember
2017-12-31
0001703644
srt:IndustrialPropertyMember
2018-12-31
0001703644
us-gaap:FirstMortgageMember
2018-12-31
0001703644
us-gaap:JuniorLoansMember
2018-01-01
2018-12-31
0001703644
us-gaap:SecondMortgageMember
2018-12-31
0001703644
us-gaap:JuniorLoansMember
2018-12-31
0001703644
us-gaap:SecondMortgageMember
2018-01-01
2018-12-31
0001703644
us-gaap:FirstMortgageMember
2018-01-01
2018-12-31
0001703644
gpmt:RiskRating5Member
2017-12-31
0001703644
gpmt:RiskRating4Member
2017-12-31
0001703644
gpmt:RiskRating3Member
2017-12-31
0001703644
gpmt:RiskRating3Member
2018-12-31
0001703644
gpmt:RiskRating5Member
2018-12-31
0001703644
gpmt:RiskRating4Member
2018-12-31
0001703644
gpmt:RiskRating2Member
2018-12-31
0001703644
gpmt:RiskRating2Member
2017-12-31
0001703644
gpmt:RiskRating1Member
2018-12-31
0001703644
gpmt:RiskRating1Member
2017-12-31
0001703644
gpmt:UnitedStatesMidwesternRegionMember
2017-12-31
0001703644
gpmt:UnitedStatesSouthwesternRegionMember
2018-12-31
0001703644
gpmt:UnitedStatesMidwesternRegionMember
2018-12-31
0001703644
gpmt:UnitedStatesSoutheasternRegionMember
2017-12-31
0001703644
gpmt:UnitedStatesWesternRegionMember
2018-12-31
0001703644
gpmt:UnitedStatesNortheasternRegionMember
2017-12-31
0001703644
gpmt:UnitedStatesWesternRegionMember
2017-12-31
0001703644
gpmt:UnitedStatesSouthwesternRegionMember
2017-12-31
0001703644
gpmt:UnitedStatesSoutheasternRegionMember
2018-12-31
0001703644
gpmt:UnitedStatesNortheasternRegionMember
2018-12-31
0001703644
us-gaap:SecondMortgageMember
2017-12-31
0001703644
us-gaap:FirstMortgageMember
2017-12-31
0001703644
us-gaap:FirstMortgageMember
2017-01-01
2017-12-31
0001703644
us-gaap:JuniorLoansMember
2017-12-31
0001703644
us-gaap:JuniorLoansMember
2017-01-01
2017-12-31
0001703644
us-gaap:SecondMortgageMember
2017-01-01
2017-12-31
0001703644
us-gaap:AvailableforsaleSecuritiesMember
2017-12-31
0001703644
us-gaap:HeldtomaturitySecuritiesMember
2017-12-31
0001703644
us-gaap:AvailableforsaleSecuritiesMember
2018-12-31
0001703644
us-gaap:LoansReceivableMember
2018-12-31
0001703644
us-gaap:LoansReceivableMember
2017-12-31
0001703644
us-gaap:HeldtomaturitySecuritiesMember
2018-12-31
0001703644
us-gaap:FairValueInputsLevel2Member
us-gaap:FairValueMeasurementsRecurringMember
2018-12-31
0001703644
us-gaap:FairValueInputsLevel1Member
us-gaap:FairValueMeasurementsRecurringMember
2018-12-31
0001703644
us-gaap:FairValueInputsLevel3Member
us-gaap:FairValueMeasurementsRecurringMember
2018-12-31
0001703644
us-gaap:FairValueMeasurementsRecurringMember
2018-12-31
0001703644
us-gaap:FairValueInputsLevel3Member
us-gaap:FairValueMeasurementsRecurringMember
2017-12-31
0001703644
us-gaap:FairValueInputsLevel2Member
us-gaap:FairValueMeasurementsRecurringMember
2017-12-31
0001703644
us-gaap:FairValueInputsLevel1Member
us-gaap:FairValueMeasurementsRecurringMember
2017-12-31
0001703644
us-gaap:FairValueMeasurementsRecurringMember
2017-12-31
0001703644
gpmt:RepurchaseAgreementCounterpartyJPMorganChaseBankMember
2017-12-31
0001703644
gpmt:RepurchaseAgreementCounterpartyWellsFargoBankMember
2017-12-31
0001703644
gpmt:RepurchaseAgreementCounterpartyGoldmanSachsBankMember
2017-12-31
0001703644
gpmt:RepurchaseAgreementCounterpartyWellsFargoBankMember
2018-01-01
2018-12-31
0001703644
gpmt:RepurchaseAgreementCounterpartyMorganStanleyBankMember
2018-12-31
0001703644
gpmt:RepurchaseAgreementCounterpartyWellsFargoBankMember
2018-12-31
0001703644
gpmt:RepurchaseAgreementCounterpartyJPMorganChaseBankMember
2018-12-31
0001703644
gpmt:RepurchaseAgreementCounterpartyGoldmanSachsBankMember
2018-01-01
2018-12-31
0001703644
gpmt:RepurchaseAgreementCounterpartyJPMorganChaseBankMember
2018-01-01
2018-12-31
0001703644
gpmt:RepurchaseAgreementCounterpartyWellsFargoBankMember
2017-01-01
2017-12-31
0001703644
us-gaap:IndividuallyImmaterialCounterpartiesMember
2017-12-31
0001703644
gpmt:RepurchaseAgreementCounterpartyGoldmanSachsBankMember
2018-12-31
0001703644
us-gaap:IndividuallyImmaterialCounterpartiesMember
2018-12-31
0001703644
gpmt:RepurchaseAgreementCounterpartyMorganStanleyBankMember
2017-01-01
2017-12-31
0001703644
gpmt:RepurchaseAgreementCounterpartyMorganStanleyBankMember
2017-12-31
0001703644
gpmt:RepurchaseAgreementCounterpartyMorganStanleyBankMember
2018-01-01
2018-12-31
0001703644
us-gaap:IndividuallyImmaterialCounterpartiesMember
2017-01-01
2017-12-31
0001703644
gpmt:RepurchaseAgreementCounterpartyGoldmanSachsBankMember
2017-01-01
2017-12-31
0001703644
us-gaap:IndividuallyImmaterialCounterpartiesMember
2018-01-01
2018-12-31
0001703644
gpmt:RepurchaseAgreementCounterpartyJPMorganChaseBankMember
2017-01-01
2017-12-31
0001703644
gpmt:MaturityuptoOneYearMember
2018-12-31
0001703644
gpmt:MaturityuptoOneYearMember
2017-12-31
0001703644
gpmt:MaturityOverOneYearMember
2018-12-31
0001703644
gpmt:MaturityOverOneYearMember
2017-12-31
0001703644
gpmt:Maturity60To89DaysMember
2018-12-31
0001703644
us-gaap:LoansReceivableMember
gpmt:MaturityOverOneYearMember
2017-12-31
0001703644
us-gaap:CommercialMortgageBackedSecuritiesMember
gpmt:Maturity30To59DaysMember
2017-12-31
0001703644
us-gaap:CommercialMortgageBackedSecuritiesMember
us-gaap:MaturityUpTo30DaysMember
2017-12-31
0001703644
us-gaap:LoansReceivableMember
gpmt:MaturityOverOneYearMember
2018-12-31
0001703644
us-gaap:LoansReceivableMember
gpmt:Maturity120To364DaysMember
2018-12-31
0001703644
us-gaap:LoansReceivableMember
2018-12-31
0001703644
us-gaap:CommercialMortgageBackedSecuritiesMember
gpmt:MaturityOverOneYearMember
2018-12-31
0001703644
us-gaap:LoansReceivableMember
us-gaap:MaturityUpTo30DaysMember
2017-12-31
0001703644
us-gaap:CommercialMortgageBackedSecuritiesMember
gpmt:MaturityOverOneYearMember
2017-12-31
0001703644
us-gaap:CommercialMortgageBackedSecuritiesMember
gpmt:Maturity120To364DaysMember
2018-12-31
0001703644
us-gaap:CommercialMortgageBackedSecuritiesMember
gpmt:Maturity90To119DaysMember
2017-12-31
0001703644
gpmt:Maturity90To119DaysMember
2017-12-31
0001703644
us-gaap:LoansReceivableMember
gpmt:Maturity90To119DaysMember
2017-12-31
0001703644
us-gaap:CommercialMortgageBackedSecuritiesMember
2018-12-31
0001703644
us-gaap:LoansReceivableMember
gpmt:Maturity120To364DaysMember
2017-12-31
0001703644
gpmt:Maturity30To59DaysMember
2018-12-31
0001703644
gpmt:Maturity60To89DaysMember
2017-12-31
0001703644
us-gaap:CommercialMortgageBackedSecuritiesMember
gpmt:Maturity30To59DaysMember
2018-12-31
0001703644
us-gaap:CommercialMortgageBackedSecuritiesMember
gpmt:Maturity120To364DaysMember
2017-12-31
0001703644
us-gaap:CommercialMortgageBackedSecuritiesMember
gpmt:Maturity60To89DaysMember
2017-12-31
0001703644
us-gaap:MaturityUpTo30DaysMember
2018-12-31
0001703644
us-gaap:CommercialMortgageBackedSecuritiesMember
us-gaap:MaturityUpTo30DaysMember
2018-12-31
0001703644
gpmt:Maturity90To119DaysMember
2018-12-31
0001703644
us-gaap:LoansReceivableMember
gpmt:Maturity60To89DaysMember
2017-12-31
0001703644
us-gaap:LoansReceivableMember
gpmt:Maturity30To59DaysMember
2017-12-31
0001703644
us-gaap:LoansReceivableMember
us-gaap:MaturityUpTo30DaysMember
2018-12-31
0001703644
us-gaap:LoansReceivableMember
gpmt:Maturity60To89DaysMember
2018-12-31
0001703644
us-gaap:CommercialMortgageBackedSecuritiesMember
gpmt:Maturity90To119DaysMember
2018-12-31
0001703644
us-gaap:CommercialMortgageBackedSecuritiesMember
gpmt:Maturity60To89DaysMember
2018-12-31
0001703644
us-gaap:LoansReceivableMember
2017-12-31
0001703644
us-gaap:LoansReceivableMember
gpmt:Maturity90To119DaysMember
2018-12-31
0001703644
us-gaap:CommercialMortgageBackedSecuritiesMember
2017-12-31
0001703644
gpmt:Maturity120To364DaysMember
2018-12-31
0001703644
gpmt:Maturity30To59DaysMember
2017-12-31
0001703644
us-gaap:LoansReceivableMember
gpmt:Maturity30To59DaysMember
2018-12-31
0001703644
us-gaap:MaturityUpTo30DaysMember
2017-12-31
0001703644
gpmt:Maturity120To364DaysMember
2017-12-31
0001703644
gpmt:RestrictedCashAndCashEquivalentsMember
2018-12-31
0001703644
us-gaap:HeldtomaturitySecuritiesMember
2018-12-31
0001703644
gpmt:RestrictedCashAndCashEquivalentsMember
2017-12-31
0001703644
us-gaap:HeldtomaturitySecuritiesMember
2017-12-31
0001703644
us-gaap:AvailableforsaleSecuritiesMember
2017-12-31
0001703644
us-gaap:AvailableforsaleSecuritiesMember
2018-12-31
0001703644
gpmt:MaturityOverOneYearMember
2017-12-31
0001703644
us-gaap:MaturityUpTo30DaysMember
2017-12-31
0001703644
gpmt:Maturity120To364DaysMember
2018-12-31
0001703644
us-gaap:MaturityUpTo30DaysMember
2018-12-31
0001703644
gpmt:Maturity60To89DaysMember
2017-12-31
0001703644
gpmt:Maturity30To59DaysMember
2018-12-31
0001703644
gpmt:MaturityOverOneYearMember
2018-12-31
0001703644
gpmt:Maturity90To119DaysMember
2017-12-31
0001703644
gpmt:Maturity30To59DaysMember
2017-12-31
0001703644
gpmt:Maturity90To119DaysMember
2018-12-31
0001703644
gpmt:Maturity60To89DaysMember
2018-12-31
0001703644
gpmt:Maturity120To364DaysMember
2017-12-31
0001703644
us-gaap:RevolvingCreditFacilityMember
2018-12-31
0001703644
gpmt:ConvertibleDebt2018IssuanceMember
2017-01-01
2017-12-31
0001703644
gpmt:ConvertibleDebt2018IssuanceMember
us-gaap:ConvertibleDebtMember
us-gaap:PrivatePlacementMember
2018-12-31
0001703644
gpmt:ConvertibleDebt2018IssuanceMember
us-gaap:ConvertibleDebtMember
2018-12-31
0001703644
gpmt:ConvertibleDebt2017IssuanceMember
us-gaap:ConvertibleDebtMember
us-gaap:PrivatePlacementMember
2018-12-31
0001703644
gpmt:ConvertibleDebt2017IssuanceMember
us-gaap:ConvertibleDebtMember
2018-12-31
0001703644
gpmt:ConvertibleDebt2017IssuanceMember
us-gaap:ConvertibleDebtMember
us-gaap:OverAllotmentOptionMember
2018-12-31
0001703644
gpmt:ConvertibleDebt2017IssuanceMember
2017-01-01
2017-12-31
0001703644
gpmt:ConvertibleDebt2017IssuanceMember
2018-01-01
2018-12-31
0001703644
gpmt:ConvertibleDebt2018IssuanceMember
2018-01-01
2018-12-31
0001703644
us-gaap:CommonStockMember
us-gaap:IPOMember
2017-01-01
2017-12-31
0001703644
gpmt:AttheMarketOfferingMember
2018-01-01
2018-12-31
0001703644
us-gaap:CommonStockMember
2018-12-31
0001703644
us-gaap:IPOMember
2017-01-01
2017-12-31
0001703644
us-gaap:CommonStockMember
2017-10-01
2017-12-31
0001703644
us-gaap:CommonStockMember
2017-07-01
2017-09-30
0001703644
us-gaap:CommonStockMember
2018-01-01
2018-03-31
0001703644
us-gaap:CommonStockMember
2018-10-01
2018-12-31
0001703644
us-gaap:CommonStockMember
2018-07-01
2018-09-30
0001703644
us-gaap:CommonStockMember
2018-04-01
2018-06-30
0001703644
gpmt:KeyEmployeesMember
2018-12-31
0001703644
us-gaap:DirectorMember
2017-01-01
2017-12-31
0001703644
us-gaap:DirectorMember
2018-01-01
2018-12-31
0001703644
gpmt:KeyEmployeesMember
2017-01-01
2017-12-31
0001703644
gpmt:KeyEmployeesMember
2018-01-01
2018-12-31
0001703644
gpmt:PRCMAdvisersLLCMember
2017-01-01
2017-12-31
0001703644
gpmt:PineRiverCapitalManagementL.P.Member
2018-01-01
2018-12-31
0001703644
gpmt:PineRiverCapitalManagementL.P.Member
2017-01-01
2017-12-31
0001703644
gpmt:PRCMAdvisersLLCMember
2016-01-01
2016-12-31
0001703644
us-gaap:SubsequentEventMember
2019-02-05
2019-03-31
0001703644
us-gaap:SubsequentEventMember
us-gaap:OverAllotmentOptionMember
2019-02-05
2019-03-31
0001703644
2017-01-01
2017-03-31
0001703644
2017-04-01
2017-06-30
0001703644
2017-07-01
2017-09-30
0001703644
2017-10-01
2017-12-31
0001703644
2018-01-01
2018-03-31
0001703644
2018-04-01
2018-06-30
0001703644
2018-10-01
2018-12-31
0001703644
2018-07-01
2018-09-30
0001703644
gpmt:MultifamilyNortheast3Member
2018-12-31
0001703644
gpmt:IndustrialNortheast7Member
2018-12-31
0001703644
gpmt:OfficeSouthwest5Member
2018-12-31
0001703644
gpmt:MultifamilySouthwestMember
2018-01-01
2018-12-31
0001703644
gpmt:MultifamilySoutheastMember
2018-01-01
2018-12-31
0001703644
gpmt:MixedUseWestMember
2018-01-01
2018-12-31
0001703644
gpmt:HotelMidwest2Member
2018-12-31
0001703644
gpmt:HotelSoutheast2Member
2018-12-31
0001703644
gpmt:IndustrialNortheast4Member
2018-12-31
0001703644
gpmt:MultifamilyMidwest6Member
2018-12-31
0001703644
gpmt:IndustrialNortheast3Member
2018-12-31
0001703644
gpmt:HotelSouthwestMember
2018-12-31
0001703644
gpmt:RetailSoutheastMember
2018-12-31
0001703644
gpmt:MultifamilySouthwest6Member
2018-01-01
2018-12-31
0001703644
gpmt:OfficeSouthwest2Member
2018-12-31
0001703644
gpmt:MultifamilyMidwest3Member
2018-12-31
0001703644
gpmt:HotelNortheast2Member
2018-12-31
0001703644
gpmt:MultifamilySouthwest4Member
2018-01-01
2018-12-31
0001703644
gpmt:MultifamilyNortheastMember
2018-12-31
0001703644
gpmt:OfficeSouthwestMember
2018-12-31
0001703644
gpmt:HotelNortheastMember
2018-01-01
2018-12-31
0001703644
gpmt:OfficeMidwestMember
2018-01-01
2018-12-31
0001703644
gpmt:HotelWest2Member
2018-12-31
0001703644
gpmt:OfficeNortheast11Member
2018-12-31
0001703644
gpmt:MultifamilySouthwest5Member
2018-01-01
2018-12-31
0001703644
gpmt:RetailMixedUseSouthwestMember
2018-12-31
0001703644
gpmt:HotelMidwest3Member
2018-12-31
0001703644
gpmt:OfficeWest8Member
2018-01-01
2018-12-31
0001703644
gpmt:RetailWest2Member
2018-12-31
0001703644
gpmt:OfficeSoutheastMember
2018-12-31
0001703644
gpmt:HotelMidwest2Member
2018-01-01
2018-12-31
0001703644
gpmt:OfficeSoutheast3Member
2018-01-01
2018-12-31
0001703644
gpmt:IndustrialNortheast2Member
2018-12-31
0001703644
gpmt:OfficeSoutheast7Member
2018-01-01
2018-12-31
0001703644
gpmt:OfficeNortheast12Member
2018-12-31
0001703644
gpmt:MultifamilySoutheast2Member
2018-12-31
0001703644
gpmt:IndustrialNortheast2Member
2018-01-01
2018-12-31
0001703644
gpmt:HotelNortheast3Member
2018-12-31
0001703644
gpmt:OfficeNortheast7Member
2018-12-31
0001703644
gpmt:MixedUseNortheast5Member
2018-01-01
2018-12-31
0001703644
gpmt:MultifamilyMidwest4Member
2018-12-31
0001703644
gpmt:HotelWest5Member
2018-12-31
0001703644
gpmt:OfficeNortheast10Member
2018-12-31
0001703644
gpmt:MultifamilyMidwestMember
2018-12-31
0001703644
gpmt:OfficeNortheast3Member
2018-12-31
0001703644
gpmt:OfficeNortheast4Member
2018-12-31
0001703644
gpmt:OfficeNortheast10Member
2018-01-01
2018-12-31
0001703644
gpmt:HotelWestMember
2018-12-31
0001703644
gpmt:OfficeNortheast9Member
2018-01-01
2018-12-31
0001703644
gpmt:OfficeNortheastMember
2018-12-31
0001703644
gpmt:IndustrialWestMember
2018-12-31
0001703644
gpmt:HotelMidwestMember
2018-12-31
0001703644
gpmt:OfficeDiversifiedUSMember
2018-01-01
2018-12-31
0001703644
gpmt:MixedUseNortheast2Member
2018-12-31
0001703644
gpmt:OfficeNortheast2Member
2018-12-31
0001703644
gpmt:OfficeSoutheast4Member
2018-12-31
0001703644
gpmt:MultifamilyWest2Member
2018-01-01
2018-12-31
0001703644
gpmt:RetailWestMember
2018-12-31
0001703644
gpmt:OfficeSouthwest3Member
2018-12-31
0001703644
gpmt:HotelNortheastMember
2018-12-31
0001703644
gpmt:RetailMixedUseSouthwestMember
2018-01-01
2018-12-31
0001703644
gpmt:MultifamilySouthwest3Member
2018-12-31
0001703644
gpmt:OfficeNortheast2Member
2018-01-01
2018-12-31
0001703644
gpmt:OfficeNortheast9Member
2018-12-31
0001703644
gpmt:RetailSouthwestMember
2018-12-31
0001703644
gpmt:MultifamilySouthwestMember
2018-12-31
0001703644
gpmt:MixedUseNortheast3Member
2018-01-01
2018-12-31
0001703644
gpmt:OfficeWest3Member
2018-12-31
0001703644
gpmt:IndustrialNortheast5Member
2018-12-31
0001703644
gpmt:IndustrialNortheast6Member
2018-01-01
2018-12-31
0001703644
gpmt:MultifamilyWestMember
2018-12-31
0001703644
gpmt:MultifamilyMidwest4Member
2018-01-01
2018-12-31
0001703644
gpmt:IndustrialWestMember
2018-01-01
2018-12-31
0001703644
gpmt:IndustrialNortheastMember
2018-12-31
0001703644
gpmt:OfficeWestMember
2018-12-31
0001703644
gpmt:OfficeNortheast7Member
2018-01-01
2018-12-31
0001703644
gpmt:MultifamilySouthwest5Member
2018-12-31
0001703644
gpmt:OfficeNortheast8Member
2018-12-31
0001703644
gpmt:OfficeWest2Member
2018-12-31
0001703644
gpmt:MixedUseNortheastMember
2018-12-31
0001703644
gpmt:HotelWest4Member
2018-12-31
0001703644
gpmt:MultifamilyMidwest5Member
2018-12-31
0001703644
gpmt:MixedUseWestMember
2018-12-31
0001703644
gpmt:OfficeWest4Member
2018-01-01
2018-12-31
0001703644
gpmt:MultifamilySoutheast3Member
2018-01-01
2018-12-31
0001703644
gpmt:MultifamilyMidwest2Member
2018-01-01
2018-12-31
0001703644
gpmt:OfficeMidwestMember
2018-12-31
0001703644
gpmt:IndustrialNortheast6Member
2018-12-31
0001703644
gpmt:OfficeNortheast6Member
2018-12-31
0001703644
gpmt:IndustrialNortheast4Member
2018-01-01
2018-12-31
0001703644
gpmt:OfficeWest9Member
2018-12-31
0001703644
gpmt:MultifamilyNortheast2Member
2018-12-31
0001703644
gpmt:HotelSouthwest2Member
2018-12-31
0001703644
gpmt:OfficeSoutheast5Member
2018-12-31
0001703644
gpmt:OfficeNortheast8Member
2018-01-01
2018-12-31
0001703644
gpmt:MixedUseNortheast5Member
2018-12-31
0001703644
gpmt:OfficeWest5Member
2018-12-31
0001703644
gpmt:MultifamilySouthwest4Member
2018-12-31
0001703644
gpmt:OfficeWest4Member
2018-12-31
0001703644
gpmt:OfficeSouthwest2Member
2018-01-01
2018-12-31
0001703644
gpmt:OfficeSoutheast3Member
2018-12-31
0001703644
gpmt:OfficeWest8Member
2018-12-31
0001703644
gpmt:RetailSouthwestMember
2018-01-01
2018-12-31
0001703644
gpmt:OfficeNortheast5Member
2018-12-31
0001703644
gpmt:HotelSoutheastMember
2018-12-31
0001703644
gpmt:MultifamilyNortheast3Member
2018-01-01
2018-12-31
0001703644
gpmt:OfficeDiversifiedUSMember
2018-12-31
0001703644
gpmt:MultifamilyMidwest6Member
2018-01-01
2018-12-31
0001703644
gpmt:OfficeSouthwest4Member
2018-12-31
0001703644
gpmt:OfficeWest7Member
2018-12-31
0001703644
gpmt:MultifamilySouthwest2Member
2018-12-31
0001703644
gpmt:HotelSouthwestMember
2018-01-01
2018-12-31
0001703644
gpmt:HotelSoutheast2Member
2018-01-01
2018-12-31
0001703644
gpmt:MultifamilyNortheast4Member
2018-12-31
0001703644
gpmt:RetailWest2Member
2018-01-01
2018-12-31
0001703644
gpmt:MultifamilyMidwest2Member
2018-12-31
0001703644
gpmt:HotelWest3Member
2018-12-31
0001703644
gpmt:OfficeSouthwest5Member
2018-01-01
2018-12-31
0001703644
gpmt:OfficeSouthwest4Member
2018-01-01
2018-12-31
0001703644
gpmt:OfficeSoutheast2Member
2018-01-01
2018-12-31
0001703644
gpmt:MixedUseNortheast3Member
2018-12-31
0001703644
gpmt:OfficeSoutheast7Member
2018-12-31
0001703644
gpmt:OfficeNortheast4Member
2018-01-01
2018-12-31
0001703644
gpmt:MultifamilySouthwest6Member
2018-12-31
0001703644
gpmt:HotelWestMember
2018-01-01
2018-12-31
0001703644
gpmt:IndustrialNortheast5Member
2018-01-01
2018-12-31
0001703644
gpmt:MixedUseNortheast4Member
2018-12-31
0001703644
gpmt:OfficeNortheast6Member
2018-01-01
2018-12-31
0001703644
gpmt:MultifamilySoutheast2Member
2018-01-01
2018-12-31
0001703644
gpmt:MultifamilyMidwest5Member
2018-01-01
2018-12-31
0001703644
gpmt:OfficeWest10Member
2018-01-01
2018-12-31
0001703644
gpmt:OfficeWest7Member
2018-01-01
2018-12-31
0001703644
gpmt:HotelMidwestMember
2018-01-01
2018-12-31
0001703644
gpmt:MultifamilyWestMember
2018-01-01
2018-12-31
0001703644
gpmt:OfficeSoutheast2Member
2018-12-31
0001703644
gpmt:OfficeNortheast5Member
2018-01-01
2018-12-31
0001703644
gpmt:OfficeSoutheastMember
2018-01-01
2018-12-31
0001703644
gpmt:MixedUseNortheastMember
2018-01-01
2018-12-31
0001703644
gpmt:OfficeNortheast12Member
2018-01-01
2018-12-31
0001703644
gpmt:HotelNortheast2Member
2018-01-01
2018-12-31
0001703644
gpmt:OfficeSouthwest6Member
2018-01-01
2018-12-31
0001703644
gpmt:OfficeSoutheast6Member
2018-12-31
0001703644
gpmt:OfficeWest10Member
2018-12-31
0001703644
gpmt:MultifamilyNortheast2Member
2018-01-01
2018-12-31
0001703644
gpmt:MixedUseNortheast4Member
2018-01-01
2018-12-31
0001703644
gpmt:OfficeSouthwestMember
2018-01-01
2018-12-31
0001703644
gpmt:OfficeWest3Member
2018-01-01
2018-12-31
0001703644
gpmt:HotelSoutheastMember
2018-01-01
2018-12-31
0001703644
gpmt:MultifamilySouthwest3Member
2018-01-01
2018-12-31
0001703644
gpmt:OfficeSouthwest6Member
2018-12-31
0001703644
gpmt:MultifamilySoutheast3Member
2018-12-31
0001703644
gpmt:OfficeNortheast3Member
2018-01-01
2018-12-31
0001703644
gpmt:OfficeSouthwest3Member
2018-01-01
2018-12-31
0001703644
gpmt:MultifamilySoutheastMember
2018-12-31
0001703644
gpmt:HotelWest5Member
2018-01-01
2018-12-31
0001703644
gpmt:HotelWest4Member
2018-01-01
2018-12-31
0001703644
gpmt:MultifamilyMidwestMember
2018-01-01
2018-12-31
0001703644
gpmt:MultifamilyWest2Member
2018-12-31
0001703644
gpmt:OfficeSoutheast4Member
2018-01-01
2018-12-31
0001703644
gpmt:HotelMidwest3Member
2018-01-01
2018-12-31
0001703644
gpmt:MultifamilyMidwest3Member
2018-01-01
2018-12-31
0001703644
gpmt:OfficeNortheast11Member
2018-01-01
2018-12-31
0001703644
gpmt:RetailWestMember
2018-01-01
2018-12-31
0001703644
gpmt:HotelWest3Member
2018-01-01
2018-12-31
0001703644
gpmt:MultifamilySouthwest2Member
2018-01-01
2018-12-31
0001703644
gpmt:OfficeWestMember
2018-01-01
2018-12-31
0001703644
gpmt:OfficeWest6Member
2018-12-31
0001703644
gpmt:OfficeWest5Member
2018-01-01
2018-12-31
0001703644
gpmt:RetailSoutheastMember
2018-01-01
2018-12-31
0001703644
gpmt:OfficeSoutheast6Member
2018-01-01
2018-12-31
0001703644
gpmt:MixedUseNortheast2Member
2018-01-01
2018-12-31
0001703644
gpmt:MultifamilyNortheastMember
2018-01-01
2018-12-31
0001703644
gpmt:IndustrialNortheastMember
2018-01-01
2018-12-31
0001703644
gpmt:IndustrialNortheast3Member
2018-01-01
2018-12-31
0001703644
gpmt:IndustrialNortheast7Member
2018-01-01
2018-12-31
0001703644
gpmt:OfficeWest2Member
2018-01-01
2018-12-31
0001703644
gpmt:HotelNortheast3Member
2018-01-01
2018-12-31
0001703644
gpmt:OfficeNortheastMember
2018-01-01
2018-12-31
0001703644
gpmt:OfficeWest9Member
2018-01-01
2018-12-31
0001703644
gpmt:HotelSouthwest2Member
2018-01-01
2018-12-31
0001703644
gpmt:MultifamilyNortheast4Member
2018-01-01
2018-12-31
0001703644
gpmt:OfficeSoutheast5Member
2018-01-01
2018-12-31
0001703644
gpmt:OfficeWest6Member
2018-01-01
2018-12-31
0001703644
gpmt:HotelWest2Member
2018-01-01
2018-12-31
xbrli:pure
iso4217:USD
xbrli:shares
iso4217:USD
xbrli:shares
gpmt:loan
UNITED STATES
SECURITIES AND EXCHANGE COMMISSION
Washington, D.C. 20549
FORM 10-K
ANNUAL REPORT PURSUANT TO SECTION 13 OR 15(d) OF THE SECURITIES EXCHANGE ACT OF 1934
For the Fiscal Year Ended: December 31, 2018
Commission File Number 001-38124
______________________________
GRANITE POINT MORTGAGE TRUST INC.
(Exact Name of Registrant as Specified in Its Charter)
|
| | |
Maryland | | 61-1843143 |
(State or Other Jurisdiction of Incorporation or Organization) | | (I.R.S. Employer Identification No.) |
|
| | |
590 Madison Avenue, 38th Floor New York, New York | | 10022 |
(Address of Principal Executive Offices) | | (Zip Code) |
(212) 364-3200
(Registrant’s Telephone Number, Including Area Code)
Securities Registered Pursuant to Section 12(b) of the Act:
|
| | |
Title of Each Class: | | Name of Exchange on Which Registered: |
Common Stock, par value $0.01 per share | | New York Stock Exchange |
Securities registered pursuant to Section 12(g) of the Act: None
Indicate by check mark if the registrant is a well-known seasoned issuer, as defined in Rule 405 of the Securities Act. Yes x No o
Indicate by check mark if the registrant is not required to file reports pursuant to Section 13 or Section 15(d) of the Act. Yes o No x
Indicate by check mark whether the registrant (1) has filed all reports required to be filed by Section 13 or 15(d) of the Securities Exchange Act of 1934 during the preceding 12 months (or for such shorter period that the registrant was required to file such reports), and (2) has been subject to such filing requirements for the past 90 days. Yes x No o
Indicate by check mark whether the registrant has submitted electronically every Interactive Data File required to be submitted pursuant to Rule 405 of Regulation S-T (§232.405 of this chapter) during the preceding 12 months (or for such shorter period that the registrant was required to submit such files). Yes x No o
Indicate by check mark if disclosure of delinquent filers pursuant to Item 405 of Regulation S-K (§229.405 of this chapter) is not contained herein, and will not be contained, to the best of registrant’s knowledge, in definitive proxy or information statements incorporated by reference in Part III of this Form 10-K or any amendment to this Form 10-K. x
Indicate by check mark whether the registrant is a large accelerated filer, an accelerated filer, a non-accelerated filer, smaller reporting company, or an emerging growth company. See the definitions of “large accelerated filer,” “accelerated filer,” “smaller reporting company,” and “emerging growth company” in Rule 12b-2 of the Exchange Act.
|
| | | |
Large accelerated filer x | | | Accelerated filer o |
Non-accelerated filer o | | | Smaller reporting company o |
| | | Emerging growth company o |
If an emerging growth company, indicate by check mark if the registrant has elected not to use the extended transition period for complying with any new or revised financial accounting standards provided pursuant to Section 13(a) of the Exchange Act. o
Indicate by check mark whether the registrant is a shell company (as defined in Rule 12b-2 of the Act). Yes o No x
As of June 30, 2018, the aggregate market value of the registrant’s common stock held by non-affiliates of the registrant was approximately $780.3 million based on the closing sale price as reported on the NYSE on that date.
As of February 26, 2019 there were 50,885,503 shares of common stock, par value $.01 per share, issued and outstanding.
DOCUMENTS INCORPORATED BY REFERENCE
Portions of the registrant’s definitive Proxy Statement for the 2019 Annual Meeting of Stockholders, which will be filed with the Securities and Exchange Commission under Regulation 14A within 120 days after the end of registrant’s fiscal year covered by this Annual Report, are incorporated by reference into Part III.
GRANITE POINT MORTGAGE TRUST INC.
2018 ANNUAL REPORT ON FORM 10-K
TABLE OF CONTENTS
|
| | |
| | Page |
PART I | | |
| | |
| | |
| | |
| | |
| | |
| | |
PART II | | |
| | |
| | |
| | |
| | |
| | |
| | |
| | |
| | |
PART III | | |
| | |
| | |
| | |
| | |
| | |
PART IV | | |
| | |
| | |
| |
PART I
Item 1. Business
Overview
Our Company
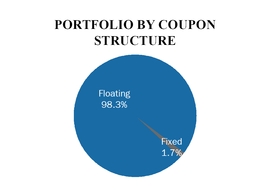
Granite Point Mortgage Trust Inc. is a Maryland corporation that focuses primarily on directly originating, investing in and managing senior floating-rate commercial mortgage loans and other debt and debt-like commercial real estate investments. We operate as a real estate investment trust, or REIT, as defined under the Internal Revenue Code of 1986, as amended, or the Code. The terms “Granite Point,” “we,” “our,” “us” and the “company” refer to Granite Point Mortgage Trust Inc. and its subsidiaries as a consolidated entity.
We were incorporated on April 7, 2017 and commenced operations as a publicly traded company on June 28, 2017, upon completion of a formation transaction, or the Formation Transaction, pursuant to which we acquired the equity interests in TH Commercial Holdings LLC, or our Predecessor, and its portfolio of commercial mortgage loans and other commercial real estate-related debt investments from Two Harbors Investment Corp., or Two Harbors, a publicly traded hybrid mortgage real estate investment trust (NYSE: TWO). Our Predecessor became our wholly owned indirect subsidiary as a result of the Formation Transaction. In exchange for equity interests of our Predecessor, we issued 33,071,000 shares of our common stock representing approximately 76.5% of our outstanding common stock after the IPO and 1,000 shares of our 10% cumulative redeemable preferred stock having a liquidation preference of $1,000 per share to Two Harbors or an affiliate of Two Harbors, which immediately sold such preferred stock to an unaffiliated third-party investor. On November 1, 2017, Two Harbors distributed the shares of our common stock issued to it in connection with the Formation Transaction by means of a special pro rata dividend to Two Harbors common stockholders. Our common stock is listed on the New York Stock Exchange, or NYSE, under the symbol “GPMT”. We are externally managed by Pine River Capital Management L.P., or our Manager.
We are a long-term, fundamental value-oriented investor. We construct our investment portfolio on a loan-by-loan basis, emphasizing rigorous credit underwriting, selectivity and diversification, and assess each investment from a fundamental value perspective relative to other opportunities available in the market. Our primary target investments are directly originated floating-rate performing senior commercial real estate loans, typically with terms of three to five years, usually ranging in size from $25 million to $150 million. We typically provide intermediate-term bridge or transitional financing for a variety of purposes, including acquisitions, recapitalizations, refinancings and a range of business plans, including lease-up, renovation, repositioning and repurposing of the property. We target the top 25, and generally up to the top 50, metropolitan statistical areas in the United States, or MSAs. We believe that those markets provide ample supply of high credit quality properties to lend against, sufficient number of owners and sponsors with institutional attributes, and adequate market liquidity. We believe this approach will enable us to deliver attractive risk-adjusted returns to our stockholders while preserving our capital base through diverse business cycles.
Our origination strategy relies on our extensive and longstanding direct relationships with a wide array of national, regional and local private owner/operators, private equity firms, funds, REITs, brokers and co-lenders. Our team’s reach across the United States and active dialogue with market participants has produced significant volume of investment opportunities since our Predecessor’s formation, and our reputation as a reliable counterparty has led to multiple investment opportunities with repeat clients. We have deep experience in the commercial real estate finance markets, with each of the senior members of our team of commercial real estate professionals, or our CRE team, having over 20 years of experience in commercial real estate debt markets.
We believe that the U.S. commercial real estate debt markets offer enduring investment opportunities. A significant amount of commercial real estate debt is scheduled to mature over the next five years, and there is a sustained need for acquisition, repositioning and recapitalization loans. We expect that traditional lenders, including banks which have historically accounted for approximately half of the market, will not be able to meet borrower demand due to structural and regulatory constraints. As a result, we believe that there are significant opportunities to originate floating-rate senior commercial real estate loans on transitional properties at attractive risk-adjusted return.
We have elected to be treated as a REIT for U.S. federal income tax purposes. To qualify as a REIT, we are required to meet certain investment and operating tests and annual distribution requirements. We generally will not be subject to U.S. federal income taxes on our taxable income to the extent that we annually distribute all of our net taxable income to stockholders, do not participate in prohibited transactions and maintain our intended qualification as a REIT. However, certain activities that we may perform may cause us to earn income which will not be qualifying income for REIT purposes. We have designated one of our subsidiaries as a taxable REIT subsidiary, or TRS, as defined in the Code, to engage in such activities, and we may form additional TRSs in the future. We also operate our business in a manner that will permit us to maintain our exclusion from registration under the Investment Company Act of 1940, as amended, or the Investment Company Act.
Note Regarding Forward-Looking Statements
This Annual Report on Form 10-K contains, or incorporates by reference, not only historical information, but also forward-looking statements within the meaning of Section 27A of the Securities Act of 1933, as amended, or the Securities Act, and Section 21E of the Securities Exchange Act of 1934, or the Exchange Act, and that are subject to the safe harbors created by such sections. Forward-looking statements involve numerous risks and uncertainties. Our actual results may differ from our beliefs, expectations, estimates, and projections and, consequently, you should not rely on these forward-looking statements as predictions of future events. Forward-looking statements are not historical in nature and can be identified by words such as “anticipate,” “estimate,” “will,” “should,” “expect,” “target,” “believe,” “intend,” “seek,” “plan,” “goals,” “future,” “likely,” “may,” and similar expressions or their negative forms, or by references to strategy, plans, or intentions. These forward-looking statements are subject to risks and uncertainties, including, among other things, those described in this Annual Report on Form 10-K under the caption “Risk Factors.” Other risks, uncertainties, and factors that could cause actual results to differ materially from those projected are described below and may be described from time to time in reports we file with the Securities and Exchange Commission, or the SEC, including our Quarterly Reports on Form 10-Q and Current Reports on Form 8-K. Forward-looking statements speak only as of the date they are made, and we undertake no obligation to update or revise any such forward-looking statements, whether as a result of new information, future events, or otherwise.
Important factors, among others, that may affect our actual results include:
| |
• | the general political, economic, and competitive conditions in the markets in which we invest; |
| |
• | defaults by borrowers in paying debt service on outstanding indebtedness and borrowers' abilities to manage and stabilize properties; |
| |
• | our ability to obtain financing arrangements on terms favorable to us or at all; |
| |
• | the level and volatility of prevailing interest rates and credit spreads; |
| |
• | reductions in the yield on our investments and increases in the cost of our financing; |
| |
• | general volatility of the securities markets in which we participate; |
| |
• | the return or impact of current or future investments; |
| |
• | allocation of investment opportunities to us by our Manager; |
| |
• | increased competition from entities investing in our target assets; |
| |
• | effects of hedging instruments on our target investments; |
| |
• | changes in governmental regulations, tax law and rates, and similar matters; |
| |
• | our ability to maintain our qualification as a REIT for U.S. federal income tax purposes and our exclusion from registration under the Investment Company Act; |
| |
• | availability of desirable investment opportunities; |
| |
• | availability of qualified personnel and our relationship with our Manager; |
| |
• | estimates relating to our ability to make distributions to our stockholders in the future; |
| |
• | hurricanes, earthquakes, and other natural disasters, acts of war and/or terrorism and other events that may cause unanticipated and uninsured performance declines and/or losses to us or the owners and operators of the real estate securing our investments; |
| |
• | deterioration in the performance of the properties securing our investments that may cause deterioration in the performance of our investments and, potentially, principal losses to us; and |
| |
• | difficulty or delays in redeploying the proceeds from repayments of our existing investments. |
This Annual Report on Form 10-K may contain statistics and other data that, in some cases, have been obtained or compiled from information made available by mortgage loan servicers and other third-party service providers.
Our Business
Our Investment Objective and Strategy
Our investment objective is to generate attractive risk-adjusted returns for our stockholders over the long-term, primarily through dividends, and to preserve our capital base through business cycles. We intend to achieve this objective by further growing our already well-diversified investment portfolio and actively managing various risks associated with our business strategy. We focus on preserving our stockholders’ capital, as we believe that stability of our capital base is of paramount importance to our ability to invest in assets that generate attractive returns on an ongoing basis.
Our investment strategy is to directly originate, invest in and manage a portfolio of commercial real estate loans and other debt and debt-like instruments secured by institutional quality commercial properties managed by experienced owners in attractive markets across the United States. Our extensive real estate expertise, industry relationships, sourcing, and underwriting capabilities aid us in executing on our strategy. We approach the commercial real estate debt markets by emphasizing the following factors:
Origination
Our origination strategy relies on our extensive and longstanding direct relationships with a wide array of national, regional and local private owner/operators, private equity firms, funds, REITs, brokers and co-lenders. We invest significant time and resources in the early stages of our origination process to increase the likelihood of closing the investment on its original terms, which has resulted in our reputation as a reliable counterparty.
Markets
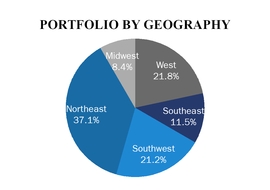
We generally target the top 25, and up to top 50, MSAs, which we believe provide ample supply of high credit quality properties to lend against, sufficient number of owners and sponsors with institutional attributes, and adequate market liquidity. We do not favor particular markets and instead look for the most compelling investments available across different geographies.
Type of Investments
Our primary target investments are directly originated floating-rate performing, intermediate term, bridge or transitional senior commercial real estate loans, typically with terms of three to five years, usually ranging in size from $25 million to $150 million that are backed by a variety of property types located across the United States. The range of loan sizes we originate is related to the breadth of MSAs from which we source our investments.
Owners and Sponsors
We seek institutional and established owners and sponsors with demonstrated market and property type expertise, as well as possessing sufficient resources (whether through loan structure or entity capitalization) to implement their business plans. We evaluate a sponsor’s track record and reputation for meeting its obligations with lenders in the past and acting responsibly.
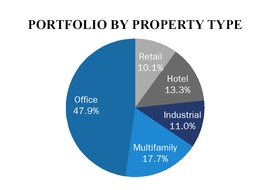
Property Types
We focus our investment strategy on income producing property types including office, industrial, multifamily, hospitality, retail and others. We prefer not to invest in debt on specialty property types that require specific expertise to operate and rely on government reimbursement programs for their cash flows.
Financing Purpose and Business Plans
We typically provide intermediate-term bridge or transitional financing for a variety of purposes, including acquisitions, recapitalizations, refinancings and a range of business plans including lease-up, renovation, repositioning and repurposing of the property. We believe that the scale and flexibility of our capital, as well as our CRE team’s long-standing industry relationships, enables us to finance strong borrowers and sponsors, and invest in debt collateralized by high-quality properties.
As a long-term, fundamental value-oriented investor, we may adjust our investment strategy as we react to evolving market dynamics. We believe there are enduring opportunities within our target investments that present attractive risk-adjusted returns. However, as economic and business cycles develop, we may expand and/or adjust our investment strategy and target investments to capitalize on various investment opportunities. We believe that our well-diversified portfolio and flexible investment strategy will allow us to actively adapt to changing market conditions and generate attractive long-term returns for our stockholders in a variety of environments.
Our Investment Philosophy
Our investment philosophy is governed by several guiding principles:
| |
• | Value investing approach - We are a long-term, fundamental value-oriented investor. We search for value across various geographies, property types and capital structure, guided by the belief that each investment should be attractive on its own fundamental merits and assessed relative to other available opportunities. |
| |
• | Cash flow potential - We emphasize a property’s cash flow potential as an underwriting metric, rather than a loan’s basis against the value of the property. From an underwriting perspective, we believe that a property’s long-term ability to generate sustainable cash flows is of greater importance than its current sale value. |
| |
• | Comprehensive underwriting and loan structuring - We engage in a rigorous and comprehensive underwriting process on each investment. We diligence a property’s cash flow potential, including micro- and macroeconomic factors, our borrower’s expertise and reputation, and business plan. Additionally, we place great emphasis on the loan terms and structural protections to provide us with the tools to protect our investment and our stockholders’ capital, if so required. |
| |
• | Selectivity and portfolio diversification - We focus on creating loan portfolios on a loan-by-loan basis rather than engaging in large bulk purchases of investments. As a result, we are able to identify and invest among a broad array of opportunities, and construct a portfolio diversified across markets, property types and sponsors, across the large U.S. commercial real estate debt market, which has a size in excess of $3 trillion. |
| |
• | Active investment monitoring and management - The team originating a loan remains responsible for monitoring and managing that investment from origination through the moment it is repaid, sold or otherwise liquidated. We believe that this approach maintains accountability for each loan and is reflective of our credit culture. |
Our Competitive Strengths
Long-Tenured Presence in the Commercial Real Estate Debt Market
Our team of commercial real estate professionals, or our CRE team, is among the most experienced in the industry. Each member of our CRE team has been active in the commercial real estate debt markets for a majority of their careers. The senior members of our CRE team have over 20 years of experience in commercial real estate finance each, including experience building and managing multiple commercial real estate lending businesses, both as broker dealers and as investment managers. This broad experience provides us with the expertise in capital markets, structured finance and investment management needed to navigate and exploit the commercial real estate finance markets and successfully execute on our business plan for the benefit of our stockholders.
High Quality Portfolio with Attractive Yield
Our portfolio consists of cash-generating commercial real estate debt investments with a principal balance of $3.2 billion as of December 31, 2018, with an additional $626.2 million of potential future funding obligations. The current cash flow of our portfolio should allow us to continue to generate an attractive dividend for our stockholders. Additionally, we believe the scale of our portfolio should allow us better access to capital and an opportunity to build upon existing relationships with our clients.
Established Direct Origination Platform with Strong Sourcing Capabilities
We have a proven ability to directly originate investments within multiple markets across the United States. We have the ability to generate investments and find value in local markets due to our vast borrower, sponsor and broker relationships combined with many years of experience in the commercial real estate debt market. We believe that our origination experience combined with the high quality of our portfolio will allow us to continue to grow and deploy capital into attractive target investments in a timely manner to the benefit of our stockholders.
Focused Investment Process Leading to Reputation as a Reliable Counterparty
We employ a highly disciplined sourcing, screening and underwriting process. We invest significant time and resources in the early stages of our origination process and communicate frequently with our borrowers regarding business plan, terms and structure. This process increases the likelihood of closing the investment on the originally agreed to terms, resulting in our reputation as a reliable counterparty.
Robust Underwriting, Structuring and Investment Management Capabilities
Our established underwriting, structuring and investment management capabilities are supplemented by our extensive experience in the commercial real estate industry, providing multiple perspectives on performance of real estate collateral through credit and interest rate cycles. This wealth of experience serves as a foundation for thorough screening of investment opportunities, disciplined underwriting procedures, and active portfolio management of our portfolio. Our risk management process entails regular monitoring of the properties we lend against, contact with the owners and sponsors, property visits, and examining local market economic, demographic and business trends affecting real estate fundamentals.
Our Target Investments
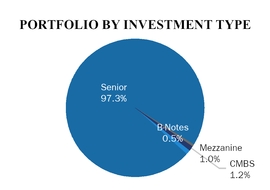
We are focused on originating senior commercial mortgage loans backed by different types of commercial real estate properties located in various markets across the United States. We have invested in, and we may, from time to time, invest in other debt and debt-like commercial real estate investments. Together, we refer to these investments as our target investments.
Primary Target Investments
| |
• | Senior Mortgage Loans. Commercial mortgage loans that are secured by real estate and evidenced by a first priority mortgage. These loans may vary in term, may bear interest at a fixed or floating rate (although our focus is floating-rate loans), and may amortize and typically require a balloon payment of principal at maturity. These investments may encompass a whole loan or may include pari passu participations within such a mortgage loan. These loans may finance stabilized properties or properties that are subject to a business plan that is expected to enhance the value of the property through lease-up, refurbishment, updating or repositioning. |
Secondary Target Investments
As part of our financing strategy, we may from time-to-time syndicate senior participations in our originated senior commercial mortgage loans to other investors and retain a subordinated debt position for our portfolio in the form of a mezzanine loan or subordinated mortgage interest, as described below. Alternatively, we may opportunistically co-originate the investments described below with senior lenders, or acquire them in the secondary market.
| |
• | Mezzanine Loans. Mezzanine loans are secured by a pledge of equity interests in the property. These loans are subordinate to a senior mortgage loan, but senior to the property owner’s equity. |
| |
• | Preferred Equity. Investments that are subordinate to any mortgage and mezzanine loans, but senior to the property owner’s common equity. |
| |
• | Subordinated Mortgage Interests. Sometimes referred to as a B-note, a subordinated mortgage interest is an investment in a junior portion of a mortgage loan. B-notes have the same borrower and benefit from the same underlying secured obligation and collateral as the senior mortgage loan, but are subordinated in priority payments in the event of default. |
| |
• | Other Real Estate Securities. Investments in real estate that take the form of CMBS or collateralized loan obligations, or CLOs, that are collateralized by pools of real estate debt instruments, which are often senior mortgage loans, or other securities. |
Based on current market conditions, we expect that the majority of our investments will continue to consist of senior commercial mortgage loans directly originated by us and secured by cash-flowing properties located in the United States. These investments typically pay interest at rates that are determined periodically on the basis of a floating base lending rate, primarily LIBOR plus a premium, and have an expected term between three and five years.
We may opportunistically adjust our capital allocation to our target investments, with the proportion and types of investments changing over time depending on our views on, among other things, the current economic and credit environment. In addition, we may invest in investments other than our target investments, in each case subject to maintaining our qualification as a REIT for U.S. federal income tax purposes and our exclusion from regulation under the Investment Company Act.
Our Portfolio
As of December 31, 2018, our investment portfolio consisted of 94 commercial real estate debt investments with an aggregate principal balance of $3.2 billion and an additional $626.2 million of potential future funding obligations. The following table and charts provide summary statistics on our portfolio and illustrate diversification across property types and geographies.
|
| | | | | | | | | | | | | | | | | | | | | | | | | |
(dollars in thousands) | | | | | | | | | | | | | | |
Type | | Maximum Loan Commitment | | Principal Balance | | Carrying Value | | Cash Coupon (2) | | Yield (3) | | Original Term (Years) | | Initial LTV (4) | | Stabilized LTV (5) |
Senior loans (1) | | $ | 3,773,465 |
| | $ | 3,147,310 |
| | $ | 3,121,582 |
| | L+3.98% | | L+4.75% | | 3.3 |
| | 67.1 | % | | 63.0 | % |
Subordinated loans | | 46,331 |
| | 46,331 |
| | 46,331 |
| | L+9.03% | | L+9.33% | | 6.0 |
| | 61.7 | % | | 56.7 | % |
CMBS | | 39,494 |
| | 39,494 |
| | 39,302 |
| | L+7.14% | | L+7.70% | | 2.8 |
| | 73.8 | % | | 73.7 | % |
Total/Wtd. Avg. | | $ | 3,859,290 |
| | $ | 3,233,135 |
| | $ | 3,207,215 |
| | L+4.06% | | L+4.83% | | 3.3 |
| | 67.1 | % | | 63.0 | % |
____________________
| |
(1) | “Senior” means a loan primarily secured by a first priority lien on commercial real property and related personal property and also includes, when applicable, any companion subordinate loans. |
| |
(2) | Cash coupon does not include origination or exit fees. Weighted average cash coupon excludes fixed rate loans. |
| |
(3) | Yield includes net origination fees and exit fees, but does not include future fundings, and is expressed as a monthly equivalent. Weighted average yield excludes fixed rate loans. |
| |
(4) | Initial LTV is calculated as the initial loan amount (plus any financing that is pari passu with or senior to such loan) divided by the as is appraised value (as determined in conformance with the Uniform Standards of Professional Appraisal Practice, or USPAP) as of the date of the loan was originated set forth in the original appraisal. |
| |
(5) | Stabilized LTV is calculated as the fully funded loan amount (plus any financing that is pari passu with or senior to such loan), including all contractually provided for future fundings, divided by the as stabilized value (as determined in conformance with USPAP) set forth in the original appraisal. As stabilized value may be based on certain assumptions, such as future construction completion, projected re-tenanting, payment of tenant improvement or leasing commissions allowances or free or abated rent periods, or increased tenant occupancies. |
Our Financing Strategy and Leverage
Our financing strategy includes raising capital through public offerings of our equity and debt securities and the available capacity under our repurchase and other financing facilities. Over time, in addition to our current mix of funding sources, we may use other forms of financing including secured and unsecured financing facilities and other credit facilities, securitizations, and public and private, secured and unsecured debt issuances by us or our subsidiaries.
As of December 31, 2018, we had repurchase agreements in place to finance loans held for investment with Morgan Stanley Bank, N.A., JPMorgan Chase Bank, National Association, Goldman Sachs Bank USA, Wells Fargo Bank, National Association and Citibank, N.A., for an aggregate maximum facility amount of $2.1 billion, or $2.3 billion inclusive of our option to upsize the Wells Fargo Bank agreement.
In the second quarter of 2018, we financed a pool of commercial real estate loans through a collateralized loan obligation, or CLO, which is consolidated on our financial statements. As of December 31, 2018, the outstanding amount due on the securitized debt obligation was $654.3 million.
As of December 31, 2018, we also had a revolving credit facility in place to finance loans held-for-investment with Citibank, N.A. with a current maximum facility amount of $105.0 million. The facility was temporarily upsized from $75.0 million to $105.0 million at December 31, 2018.
We are not required to maintain any particular debt-to-equity leverage ratio; however, the actual leverage we employ for particular investments will depend upon our assessment of the credit, liquidity, price volatility and other risks of those investments and the financing counterparties, and availability of particular types of financing at the time, as well as the financial covenants under our financing facilities. Our decision to use leverage to finance our assets is at the discretion of our management team and is not subject to the approval of our stockholders. We currently expect that our leverage will not exceed, on a debt to equity basis, a ratio of 3.5-to-1. We endeavor to match the terms and indices of our assets and liabilities, including in certain instances through the use of derivatives. We also seek to minimize the risks associated with recourse borrowing.
Subject to maintaining our qualification as a REIT for U.S. federal income tax purposes and our exemption from the Investment Company Act, we may, from time to time, engage in a variety of hedging transactions that seek to mitigate the effects of fluctuations in interest rates or currencies and their effects on our cash flows. These hedging transactions could take a variety of forms, including interest rate swaps or cap agreements, options, futures contracts, forward rate agreements or similar financial instruments. We expect these instruments would allow us to reduce, but not eliminate, the risk that we have to refinance our liabilities before the maturities of our investments and to reduce the impact of changing interest rates on our earnings.
Competition
We are engaged in a competitive business. Our net income depends, in part, on our ability to originate or acquire investments at favorable spreads over our borrowing costs. In our lending and investment activities, we compete for opportunities with a variety of institutional lenders and investors, including other REITs, specialty finance companies, public and private funds, commercial and investment banks, commercial finance and insurance companies and other financial institutions. Several other REITs have raised significant amounts of capital, and may have investment objectives and strategies that overlap with ours, which may create additional competition for lending and investment opportunities.
Some of our competitors may have a lower cost of funds and access to funding sources that may not available to us. Many of our competitors are not subject to the operating constraints associated with REIT rule compliance or maintenance of an exclusion from regulation under the Investment Company Act. In addition, some of our competitors may have higher risk tolerances or different risk assessments than we do, which could allow them to consider a wider variety of loans and investments, offer more attractive pricing or other terms, and establish more relationships than us. Furthermore, competition for originations of and investments in our target investments may lead to decreasing yields, which may further limit our ability to generate desired returns.
Additionally, the current administration has indicated that it may focus on issues relating to financial regulation, which could potentially relieve some of the current restrictions on financial institutions and allow them to more freely compete with us for our target investments. While there is much uncertainty regarding the timing and specifics of any policy changes, any such actions could affect our business.
We believe our industry experience and relationships provide us with a competitive advantage and helps us assess risks and determine appropriate risk and return parameters for our target investments. Additionally, we believe that our relationship with our Manager and access to its resources enables us to compete more effectively and generate attractive investment opportunities for our portfolio. However, we may not be able to achieve our business goals or expectations due to the competitive risks that we face.
For additional information concerning these competitive risks, see “Risk Factors - Risks Related to our Lending and Investment Activities - We operate in a competitive market for investment opportunities and competition may limit our ability to originate or acquire desirable investments in our target investments and could also affect the pricing of these securities” included in Item 1A of this of this Annual Report on Form 10-K.
Investment Guidelines
Our board of directors has approved the following investment guidelines:
| |
• | no investment shall be made that would cause us to fail to qualify as a REIT under the Internal Revenue Code of 1986, as amended; |
| |
• | no investment shall be made that would cause us to be regulated or required to register as an investment company under the Investment Company Act; |
| |
• | we will primarily invest in our target investments, consisting of senior commercial mortgage loans, mezzanine loans, preferred equity, subordinated mortgage interests, real estate securities and other debt and debt-like commercial real estate investments; |
| |
• | not more than 25% of our equity capital will be invested in any individual asset without the prior approval of a majority of our board of directors; |
| |
• | any investment in excess of $300 million in an individual asset requires the prior approval of a majority of our board of directors; and |
| |
• | until appropriate investments in our target investments are identified, we may invest our available cash in interest-bearing, short-term investments, including money market accounts or funds, and corporate bonds, subject to the requirements for our qualification as a REIT under the Code. |
These investment guidelines may be changed from time-to-time by our board of directors without our stockholders’ consent, but we expect to disclose any material changes to our investment guidelines in the periodic quarterly and annual reports that we file with the SEC. We are not subject to any limits or proportions under our investment guidelines with respect to the mix of target investments that we originate or acquire other than as necessary to maintain our qualification as a REIT for U.S. federal income tax purposes and our exemption from registration under the Investment Company Act.
Management Agreement
Upon completing our IPO on June 28, 2017, we entered into a management agreement with our Manager. We pay our Manager a base management fee equal to 1.5% of equity on an annualized basis, as defined in the management agreement. For purposes of calculating the management fee, equity means the sum of the net proceeds received from all issuances of equity securities, plus cumulative “core earnings” at the end of the most recently completed calendar quarter, less any distributions to stockholders, any amount paid to repurchase stock, and any incentive fees earned by our Manager, but excluding the incentive fee earned in the current quarter. As a result, equity for purposes of calculating the management fee may differ from the amount of stockholders’ equity shown in the financial statements.
Beginning in the fourth quarter of 2018, incentive fees, if earned, are payable to our Manager, as defined in the management agreement. The incentive fee is the excess of (1) the product of (a) 20% and (b) the result of (i) “core earnings” for the previous 12-month period, minus (ii) the product of (A) equity in the previous 12-month period, and (B) 8% per annum, less (2) the sum of any incentive fees paid to our Manager with respect to the first three calendar quarters of such previous 12-month period; provided, however, that no incentive fees are payable with respect to any calendar quarter unless “core earnings” for the 12 most recently completed calendar quarters in the aggregate is greater than zero.
For purposes of calculating base management and incentive fees, “core earnings” means net income (loss) attributable to common stockholders, excluding non-cash equity compensation expense, incentive fees earned by our Manager, depreciation and amortization, any unrealized gains or losses or other similar non-cash items that are included in net income for the applicable period (regardless of whether such items are included in other comprehensive income or loss or in net income), and one-time events pursuant to changes in U.S. GAAP and certain material non-cash income or expense items, in each case after discussions between our Manager and the independent directors and approved by a majority of the independent directors.
The current term of the management agreement expires on June 28, 2020, and thereafter will automatically renew for successive one-year terms annually until terminated in accordance with the terms of the agreement. Upon termination of the management agreement by us without cause or by our Manager due to the Company’s material breach of the management agreement, we are required to pay a termination fee equal to three times the sum of the average annual base management fee and average annual incentive compensation, in each case earned by our Manager during the 24-month period immediately preceding the date of termination, calculated as of the end of the most recently completed fiscal quarter prior to the date of termination.
In addition, under the terms of an amendment to the management agreement entered into in the fourth quarter of 2018, our Manager agreed to reimburse the Company an amount related to the compensation payable to the sales agents under the Company’s equity distribution agreement by netting such amount from the base management fee payable to our Manager for the applicable quarterly period.
Employees
We are externally managed by our Manager pursuant to a management agreement. Our executive officers and all of our support personnel are employees of an affiliate of our Manager. We do not have any employees.
Conflicts of Interest
We are subject to conflicts of interest relating to our Manager and its affiliates because, among other things:
| |
• | Each of our executive officers is an employee of an affiliate of our Manager. Therefore, these individuals have interests in our relationship with our Manager that are different than the interests of our stockholders. In particular, these individuals have a direct interest in the financial success of our Manager, which may encourage these individuals to support strategies that impact us based upon these considerations. As a result of these relationships, these persons have a conflict of interest with respect to the agreements and arrangements we have with our Manager and its affiliates. |
| |
• | Our Manager may retain, for and on behalf and at our sole cost and expense, such services of persons and firms as our Manager deems necessary or advisable in connection with our management and operations, which may include affiliates of our Manager; provided, that any such services may only be provided by affiliates to the extent (i) such services are on arm's length terms and competitive market rates in relation to terms that are then customary for agreements regarding the provision of such services to companies that have assets similar in type, quality and value to our investments, or (ii) such services are approved by a majority of our independent directors. Our Manager is entitled to rely reasonably on qualified experts and professionals (including accountants, legal counsel and other professional service providers) hired by our Manager at our sole cost and expense. In addition, our Manager is authorized to enter into one or more sub-advisory agreements with other investment managers, or, each, a Sub-Manager, pursuant to which our Manager may obtain the services of the Sub-Manager to assist our Manager in providing the investment advisory services required to be provided by our Manager under the management agreement. Specifically, our Manager may retain a Sub-Manager to recommend specific securities or other investments based upon our investment guidelines, and work, along with our Manager, in structuring, negotiating, arranging or effecting the acquisition or disposition of such investments and monitoring investments on our behalf, subject to oversight of our Manager and us. Our Manager, and not us, is responsible for any compensation payable to any Sub-Manager. Any sub-management agreement entered into by our Manager will be in accordance with applicable laws. |
| |
• | Our Manager may engage and supervise, on our behalf and at our expense, independent contractors, advisors, consultants, attorneys, accountants, auditors, and other service providers, which may include affiliates of our Manager, that provide various services with respect to us, including investment banking, securities brokerage, mortgage brokerage, credit analysis, risk management services, asset management services, loan servicing, other financial, legal or accounting services, due diligence services, underwriting review services, and all other services (including transfer agent and registrar services) as may be required related to our activities or investments (or potential investments). |
Our Manager may assign or delegate to one or more of its affiliates the performance of its responsibilities under the management agreement in accordance with the terms of the management agreement.
Our Manager’s liability is limited under the management agreement, and we agree to indemnify our Manager and its affiliates with respect to all expenses, losses, damages, liabilities, demands, charges and claims incurred by our Manager and its affiliates in or by reason of any pending, threatened or completed action, suit, investigation or other proceeding arising from acts or omissions of such indemnified parties except by reason of acts or omission constituting bad faith, willful misconduct, gross negligence or reckless disregard of their respective duties under the management agreement, as determined by a final non-appealable order of a court of competent jurisdiction. As a result, we could experience poor performance or losses for which our Manager would not be liable.
We agree to pay our Manager a base management fee, which is not based upon performance metrics or goals, and which might reduce our Manager’s incentive to devote its time and effort to seeking loans and investments that provide attractive risk-adjusted returns for our portfolio. Because the base management fees will be based on our outstanding equity, our Manager may also be incentivized to advance strategies that increase our equity, and there may be circumstances where increasing our equity will not optimize the returns for our stockholders.
In addition, our Manager has the ability to earn incentive fees based on our earnings, which may create an incentive for our Manager to invest in assets with higher yield potential, which are generally riskier or more speculative, or sell an asset prematurely for a gain, in an effort to increase our short-term net income and thereby increase the incentive fees to which it is entitled.
Resolution of Potential Conflicts of Interest in Allocation of Investment Opportunities
Our Manager has agreed that for so long as our Manager is managing us, neither our Manager nor any of its affiliates will sponsor or manage any other U.S. publicly traded REIT that invests in senior commercial mortgage loans, mezzanine loans, preferred equity, subordinated mortgage interests, and any other types of investments from time to time mutually agreed to by our Manager and a majority of our independent directors, all of which we refer to as “Specified Target Investments.” In addition, for the period between June 28, 2017 through June 28, 2018, our Manager and its affiliates were precluded from sponsoring or managing one or more private investment funds that invest in investment classes that are the same or similar to the Specified Target Investments, except that the Manager and its affiliates were permitted to perform investment advisory services related to a single Specified Target Investment on a one-off basis for one or more private investors or investment funds, so long as the investment advisory services were provided at the request of a client of the Manager or an affiliate and the Manager promptly notified us that such services had been rendered. The foregoing restrictions on our Manager lapsed on June 28, 2018 and are no longer applicable.
Following June 28, 2018, our Manager has agreed to offer us the right to participate in all investment opportunities that our Manager determines are appropriate for us in view of our investment objectives, policies and strategies, and other relevant factors, subject to the exception that we might not participate in each such opportunity but will on an overall basis equitably participate with our Manager’s other clients in relevant investment opportunities in accordance with our Manager’s then prevailing investment allocation policy. Our Manager’s investment allocation policy is subject to approval by our independent directors and, at the request of our independent directors, will be subject to periodic review and back-testing by our internal audit function or an independent third party. When making decisions where a conflict of interest may arise, our Manager will endeavor to allocate investment and financing opportunities in a fair and equitable manner over time as between us and our Manager’s other clients, in each case in accordance with our Manager’s investment allocation policy. Our Manager has broad discretion in making that determination, and in amending that determination over time. In allocating investments among us and a Pine River fund, our Manager’s reasons for its allocation decisions may include the following:
| |
• | the contrasting strategies, time horizons and risk profiles of the participating clients; |
| |
• | the relative capitalization and cash availability of the clients; |
| |
• | the different liquidity positions and requirements of the participating clients; |
| |
• | whether a client has appropriate exposure to or concentration in the asset type, geography or property type in question, taking into account both the client's overall investment objectives and the client's exposure or concentration relative to other clients sharing in the allocation; |
| |
• | whether an opportunity can be split between the clients, or whether it must be allocated entirely to one client or the other; |
| |
• | borrowing base considerations (such as repurchase agreements or other credit facility terms); |
| |
• | expectations regarding the timing and sources of new capital and, in the case of the Pine River funds, historical and anticipated subscription and redemption patterns of the Pine River funds; and |
| |
• | regulatory or tax considerations. |
In certain circumstances strict compliance with the foregoing allocation procedures may not be feasible and unusual or extraordinary conditions may, on occasion, warrant deviation from the practices and procedures described above. In such circumstances, senior personnel of our Manager and/or our board of directors may be called upon to determine the appropriate action which will serve the best interests of, and will be fair and equitable to, all clients involved.
Our Manager may in the future adopt additional conflicts of interest resolution policies and procedures designed to support the equitable allocation and to prevent the preferential allocation of investment opportunities among entities with overlapping investment objectives.
Operating and Regulatory Structure
Regulation
We are required to maintain qualifications, approvals and licenses in a number of states in order to conduct our lending activities and own certain of our target investments. Licensing requirements vary considerably by state and may impose various different obligations on our business, including restrictions on loan origination activity; limits on finance charges, including type, amount and manner of charging fees; disclosure requirements; surety bond and minimum specified net worth requirements; periodic reporting requirements; notice requirements for changes in principal officers, directors or principal owners; and record keeping requirements. Additionally, our licensed entities are required from time to time to submit to routine examinations by state regulatory agencies to ensure our compliance with applicable requirements. State licensing requirements can and do change as statutes and regulations are enacted, promulgated or amended. Obtaining and maintaining the appropriate qualifications, approvals and licenses cause us to incur ongoing expenses and our failure to comply with applicable requirements would have a material adverse effect on us and our operations.
REIT Qualification
We have elected and qualify to be taxed as a REIT for U.S. federal income tax purposes commencing with our taxable year ended December 31, 2017. Our qualification as a REIT depends upon our ability to meet on a continuing basis, through actual investment and operating results, various complex requirements under the Internal Revenue Code of 1986, or the Code, relating to, among other things, the sources of our gross income, the composition and values of our assets, our distribution levels and the diversity of ownership of our shares. We believe that we have been organized in conformity with the requirements for qualification and taxation as a REIT under the Code, and that our intended manner of operation will enable us to meet the requirements for qualification and taxation as a REIT.
So long as we qualify as a REIT, we generally will not be subject to U.S. federal income tax on our taxable income that we distribute currently to our stockholders. If we fail to qualify as a REIT in any taxable year and do not qualify for certain statutory relief provisions, we will be subject to U.S. federal income tax at regular corporate rates and may be precluded from qualifying as a REIT for the subsequent four taxable years following the year during which we lost our REIT qualification. Even if we qualify for taxation as a REIT, we may be subject to certain U.S. federal, state and local taxes on our income or property.
See “Risk Factors - Risks Related to our REIT Status and Certain Other Tax Items” included in Item 1A of this of this Annual Report on Form 10-K.
Investment Company Act Exemption
We conduct our operations so that neither we nor any of our subsidiaries are an “investment company” as defined in Section 3(a)(1)(A) or Section 3(a)(1)(C) of the Investment Company Act. We believe we are not an investment company under Section 3(a)(1)(A) of the Investment Company Act because we do not engage primarily, or hold ourselves out as being engaged primarily, in the business of investing, reinvesting or trading in securities. Rather, through our wholly owned or majority-owned subsidiaries, we are primarily engaged in non-investment company business related to real estate. In addition, we conduct our operations so that we do not come within the definition of an investment company under Section 3(a)(1)(C) of the Investment Company Act because less than 40% of our total assets on an unconsolidated basis will consist of “investment securities” (the “40% test”). Excluded from the term “investment securities” (as that term is defined in the Investment Company Act) are securities issued by majority-owned subsidiaries that are themselves not investment companies and are not relying on the exclusion from the definition of investment company set forth in Section 3(c)(1) or Section 3(c)(7) of the Investment Company Act. The Investment Company Act defines a majority-owned subsidiary of a person as a company 50% or more of the outstanding voting securities of which are owned by such person, or by another company which is a majority-owned subsidiary of such person. The Investment Company Act defines voting securities as any security presently entitling the owner or holder thereof to vote for the election of directors of a company. We treat entities in which we own at least a majority of the outstanding voting securities as majority-owned subsidiaries for purposes of the 40% test. We monitor our holdings to ensure ongoing compliance with this test.
We hold our assets primarily through direct or indirect wholly owned or majority-owned subsidiaries, certain of which are excluded from the definition of investment company pursuant to Section 3(c)(5)(C) of the Investment Company Act. We classify our assets for purposes of certain of our subsidiaries’ Section 3(c)(5)(C) exclusion from the Investment Company Act based upon no-action positions taken by the SEC staff and interpretive guidance provided by the SEC and its staff. Based on such guidance, to qualify for the exclusion pursuant to Section 3(c)(5)(C), each such subsidiary generally is required to hold at least (i) 55% of its assets in “qualifying” real estate assets and (ii) 80% of its assets in “qualifying” real estate assets and real estate-related assets. “Qualifying” real estate assets for this purpose include mortgage loans, certain B-Notes and certain mezzanine loans that satisfy various conditions as set forth in SEC staff no-action letters and other guidance, and other assets that the SEC staff in various no-action letters and other guidance has determined are the functional equivalent of senior mortgage loans for the purposes of the Investment Company Act. We treat as real estate-related assets, CMBS, B-Notes and mezzanine loans that do not satisfy the conditions set forth in the relevant SEC staff no-action letters and other guidance, and debt and equity securities of companies primarily engaged in real estate businesses. To the extent that the SEC staff publishes new or different guidance with respect to these matters, we may be required to re-classify our assets for purposes of the Investment Company Act, including for purposes of our subsidiaries’ compliance with the exclusion provided in Section 3(c)(5)(C) of the Investment Company Act.
If we were required to register as an investment company under the Investment Company Act, we would become subject to substantial regulation with respect to our capital structure (including our ability to use borrowings), management, operations, transactions with affiliated persons (as defined in the Investment Company Act) and portfolio composition, including disclosure requirements and restrictions with respect to diversification and industry concentration and other matters. Compliance with the Investment Company Act would, accordingly, limit our ability to make certain investments and require us to significantly restructure our business plan, which could materially adversely affect our ability to pay distributions to our stockholders.
See “Risk Factors - Risks Related to our Company and Structure - Maintaining our exclusions from registration as an investment company under the Investment Company Act imposes limits on our operations” included in Item 1A of this of this Annual Report on Form 10-K.
Financial Information
Financial information concerning our business for each of 2018, 2017 and 2016 is set forth in “Management’s Discussion and Analysis of Financial Condition and Results of Operations,” “Qualitative and Quantitative Disclosures about Market Risk” and the consolidated financial statements and the notes thereto, and the supplemental financial information, which are in Part II, Items 7, 7A and 8 of this Annual Report on Form 10-K.
Available Information
Our website can be found at www.gpmortgagetrust.com. We make available, free of charge on our website (on the Investor Relations page under “SEC Filings”), our annual report on Form 10-K, quarterly reports on Form 10-Q, current reports on Form 8-K, and any amendments to those reports, as are filed or furnished pursuant to Section 13(a) or 15(d) of the Exchange Act, as well as our proxy statement with respect to our annual meeting of stockholders, as soon as reasonably practicable after we electronically file such material with, or furnish it to, the SEC. Our Exchange Act reports filed with, or furnished to, the SEC are also available at the SEC’s website at www.sec.gov. The content of any website referred to in this Annual Report on Form 10-K is not incorporated by reference into this Form 10-K unless expressly noted.
We also make available, free of charge, the charters for our Audit Committee, Compensation Committee and Corporate Governance and Nominating Committee, as well as our Corporate Governance Guidelines, Code of Business Conduct and Ethics, Whistleblowing Procedures and Stockholder Communication Policy. Within the time period required by the SEC and the NYSE, we will post on our website any amendment to the Code of Business Conduct and Ethics and any waiver applicable to any executive officer, director or senior officer (as defined in the Code of Business Conduct and Ethics).
Our Investor Relations Department can be contacted at:
Granite Point Mortgage Trust Inc.
Attn: Investor Relations
590 Madison Avenue, 38th Floor
New York, NY 10022
(212) 364-3200
investors@gpmortgagetrust.com
Item 1A. Risk Factors
The following is a summary of the significant risk factors known to us that we believe could have a material adverse effect on our business, financial condition and results of operations. In addition to understanding the key risks described below, investors should understand that it is not possible to predict or identify all risk factors and, consequently, the following is not a complete discussion of all potential risks or uncertainties.
Risks Related to Our Lending and Investment Activities
Difficult conditions in the commercial mortgage and real estate market, the financial markets and the economy generally may adversely impact our business, results of operations and financial condition.
Our results of operations are materially affected by conditions in the commercial mortgage and real estate markets, the financial markets and the economy generally. Any deterioration of real estate fundamentals generally, and in the United States in particular, and changes in general economic conditions could negatively impact our performance or the value of underlying real estate collateral relating to our investments, increase the default risk applicable to borrowers and make it relatively more difficult for us to generate attractive risk-adjusted returns.
We cannot predict the degree to which economic conditions generally, and the conditions for real estate debt investing in particular, will improve or decline. Any stagnation in or deterioration of the commercial mortgage or real estate markets may limit our ability to acquire our target investments on attractive terms or cause us to experience losses related to our assets. Declines in the market values of our investments may adversely affect our results of operations and credit availability and cost, which may reduce earnings and, in turn, cash available for distribution to our stockholders.
We operate in a competitive market for investment opportunities and competition may limit our ability to originate or acquire our target investments and could also affect the pricing of these investments.
A number of entities compete with us to make the types of loans and investments we seek to originate or acquire. Our profitability depends, in large part, on our ability to originate or acquire target investments on attractive terms. We compete with a variety of institutional lenders and investors, including other REITs, specialty finance companies, public and private funds (including funds that our Manager or its affiliates may in the future sponsor, advise and/or manage), commercial and investment banks, commercial finance and insurance companies and other financial institutions. Some of our competitors have raised, and may in the future raise, significant amounts of capital and may have investment objectives that overlap with ours, which may create additional competition for lending and investment opportunities. Some competitors may have a lower cost of funds and access to funding sources that are not available to us. Many of our competitors are not subject to the operating constraints associated with REIT rule compliance or maintenance of an exclusion from registration under the Investment Company Act. In addition, some of our competitors may have higher risk tolerances or different risk assessments, which could allow them to consider a wider variety of loans and investments, offer more attractive pricing or other terms and establish more relationships than us. Furthermore, competition for originations of and investments in our target investments may lead to the yields of such assets decreasing, which may further limit our ability to generate satisfactory returns.
In addition, changes in the financial regulatory regime that could be proposed by the current administration could decrease the current restrictions on banks and other financial institutions and allow them to compete with us for investment opportunities that were previously not available to them. See “Risk Factors—Risks Related to Our Company—Changes in laws or regulations governing our operations, changes in the interpretation thereof or newly enacted laws or regulations and any failure by us to comply with these laws or regulations, could require changes to certain of our business practices, negatively impact our operations, cash flow or financial condition, impose additional costs on us, subject us to increased competition or otherwise adversely affect our business.”
As a result of this competition, desirable loans and investments in our target investments may be limited in the future and we may not be able to take advantage of attractive lending and investment opportunities from time to time. We can provide no assurance that we will be able to identify and originate loans or make investments that are consistent with our investment objectives. We cannot assure you that the competitive pressures we face will not have a material adverse effect on our business, financial condition and results of operations. There can be no assurance that any current relationships with such parties will continue (whether on currently applicable terms or otherwise) or that we will be able to establish relationships with other such persons in the future if desired and on terms favorable to us.
Fluctuations in interest rates and credit spreads could reduce our ability to generate income on our loans and other investments, which could lead to a significant decrease in our results of operations, cash flows and the market value of our investments.
Our primary interest rate exposures relate to the yield on our loans and other investments and the financing cost of our debt. Changes in interest rates and credit spreads may affect our net income from loans and other investments, which is the difference between the interest and related income we earn on our interest-earning investments and the interest and related expense we incur in financing these investments. Interest rate and credit spread fluctuations resulting in our interest and related expense exceeding interest and related income would result in operating losses for us. Changes in the level of interest rates and credit spreads also
may affect our ability to make loans or investments, the value of our loans and investments and our ability to realize gains from the disposition of assets. Increases in interest rates and credit spreads may also negatively affect demand for loans and could result in higher borrower default rates.
Our operating results depend, in part, on differences between the income earned on our investments, net of credit losses, and our financing costs. The yields we earn on our floating-rate assets and our borrowing costs tend to move in the same direction in response to changes in interest rates. However, one can rise or fall faster than the other, causing our net interest margin to expand or contract. In addition, we could experience reductions in the yield on our investments and an increase in the cost of our financing. Although we seek to match the terms of our liabilities to the expected lives of loans that we acquire or originate, circumstances may arise in which our liabilities are shorter in duration than our assets, resulting in their adjusting faster in response to changes in interest rates. For any period during which our investments are not match-funded, the income earned on such investments may respond more slowly to interest rate fluctuations than the cost of our borrowings. Consequently, changes in interest rates, particularly short-term interest rates, may immediately and significantly decrease our results of operations and cash flows and the market value of our investments. In addition, unless we enter into hedging or similar transactions with respect to the portion of our assets that we fund using our balance sheet, returns we achieve on such assets will generally increase as interest rates for those assets rise and decrease as interest rates for those assets decline.
We may not have control over certain of our loans and investments.
Our ability to manage our portfolio of loans and investments may be limited by the form in which they are made. In certain situations, we may:
| |
• | acquire investments subject to rights of senior classes, special servicers or collateral managers under intercreditor, servicing agreements or securitization documents; |
| |
• | pledge our investments as collateral for financing arrangements; |
| |
• | acquire only a minority and/or a non-controlling participation in an underlying investment; or |
| |
• | rely on independent third-party management or servicing with respect to the management of an asset. |
Therefore, we may not be able to exercise control over all aspects of our loans or investments. Such financial assets may involve risks not present in investments where senior creditors, junior creditors or servicers. Our rights to control the process following a borrower default may be subject to the rights of senior or junior creditors or servicers whose interests may not be aligned with ours.
Most commercial real estate loans are nonrecourse loans and the assets securing these loans may not be sufficient to protect us from a partial or complete loss if a borrower defaults on a loan, which could materially and adversely affect us.
Except for customary nonrecourse carve-outs for certain “bad acts” and environmental liability, most commercial real estate loans are nonrecourse obligations of the borrower, meaning that there is no recourse against the assets of the borrower other than the underlying collateral. In the event of any default under a commercial real estate loan, we bear the risk of loss to the extent of any deficiency between the value of the collateral and the principal of and accrued interest on the loan, which could have a material adverse effect on our results of operations and financial condition. Even if a commercial real estate loan is recourse to the borrower (or if a nonrecourse carve-out to the borrower applies), in many cases, the borrower’s assets are limited primarily to its interest in the related mortgaged property. Further, although a commercial real estate loan may provide for limited recourse to a principal or affiliate of a borrower, there is no assurance that any recovery from such principal or affiliate will be made or that such principal’s or affiliate’s assets would be sufficient to pay any otherwise recoverable claim. In the event of the bankruptcy of a borrower, the loan to such borrower will be deemed to be secured only to the extent of the value of the underlying collateral at the time of bankruptcy (as determined by the bankruptcy court) and the lien securing the loan will be subject to the avoidance powers of the bankruptcy trustee or debtor-in-possession to the extent the lien is unenforceable under state law.
We may be subject to risks associated with commercial real estate loan participations.
Some of our commercial real estate loans may be held in the form of participation interests or co-lender arrangements in which we share the loan rights, obligations and benefits with other lenders. With respect to such participation interests, we may require the consent of these parties to exercise our rights under such loans, including rights with respect to amendment of loan documentation, enforcement proceedings upon a default and the institution of, and control over, foreclosure proceedings. In circumstances where we hold a minority interest, we may be become bound to actions of the majority to which we otherwise would object. We may be adversely affected by this lack of control with respect to these interests.
Our portfolio of investments may be concentrated in terms of geography and asset types and may become concentrated in terms of sponsors, which could subject us to increased risk of loss.
Our investment guidelines do not require us to observe specific diversification criteria. Therefore, our investments may at times be concentrated in certain property types or geographies that may be subject to higher risk of default or foreclosure, or secured by properties concentrated in a limited number of geographic locations.
Asset concentration may cause even modest changes in the value of the underlying real estate assets to significantly impact on the value of our investments. As a result of any high levels of concentration, any adverse economic, political or other conditions that disproportionately affects those geographic areas or asset classes could have a magnified adverse effect on our results of operations and financial condition, and the value of our stockholders’ investments could vary more widely than if we invested in a more diverse portfolio of loans.
Real estate valuation is inherently subjective and uncertain.
The valuation of real estate and therefore the valuation of any collateral underlying our loans is inherently subjective due to, among other factors, the individual nature of each property, its location, the expected future rental revenues from that particular property and the valuation methodology adopted. In addition, where we invest in loans that involve renovations, restorations, or contruction, initial valuations will assume completion of the project. As a result, the valuations of the real estate assets against which we will make or acquire loans are subject to a large degree of uncertainty and are made on the basis of assumptions and methodologies that may not prove to be accurate, particularly in periods of volatility, low transaction flow or restricted debt availability.
The lack of liquidity of our investments may adversely affect our business, including our ability to value, finance and sell our investments.
The illiquidity of some or all of our investments and investments we intend to make may make it difficult for us to sell such investments, if the need or desire arises. Investments such as senior commercial mortgages, B-notes, mezzanine and other loans (including participations) and preferred equity, in particular, are relatively illiquid due to their short life, their potential unsuitability for securitization and the greater difficulty of recovery in the event of a borrower’s default. In addition, certain of our investments may become less liquid after investment as a result of periods of delinquencies, defaults or turbulent market conditions, which may make it more difficult for us to dispose of such assets at advantageous times or in a timely manner. Moreover, many of these investments are not registered under the relevant securities laws, resulting in prohibitions against their transfer, sale, pledge or their disposition, except in transactions that are exempt from registration requirements or are otherwise in accordance with such laws.
Consequently, even if we identify a buyer for certain of our senior commercial real estate loans, other debt and debt-like investments there is no assurance that we would be able to sell such investments in a timely manner if the need or desire arises. In addition, if we are required to liquidate all or a portion of our portfolio quickly, we may be forced to sell our investments at a price that is significantly less than the value at which we previously attributed to such investments.
Further, we may face other restrictions on our ability to liquidate an investment to the extent that we or our Manager has or could be attributed as having material, non-public information regarding such business entity. As a result, our ability to vary our portfolio in response to changes in economic or other conditions may be relatively limited, which could adversely affect our results of operations and financial condition.
The due diligence process that we undertake in regard to investment opportunities may not reveal all facts that may be relevant in connection with an investment and if we incorrectly evaluate the risks of our investments, we may experience losses.
Before making investments, we conduct due diligence that we deem reasonable and appropriate based on the facts and circumstances relevant to each potential investment. When conducting due diligence, we may be required to evaluate important and complex business, financial, tax, accounting, environmental and legal issues. Outside consultants, legal advisors, accountants and investment banks may be involved in the due diligence process in varying degrees depending on the type of potential investment. Relying on the resources available to us, we evaluate our potential investments based on criteria we deem appropriate for the relevant investment. Our loss estimates may not prove accurate, as actual results may vary from estimates. If we underestimate the asset-level losses, we may experience losses with respect to such investment.
Moreover, our investment analyses and decisions may frequently be required to be undertaken on an expedited basis to take advantage of investment opportunities. In such cases, the information available to us at the time of making an investment decision may be limited, and we may not have access to detailed information regarding such investment. Therefore, we cannot assure you that we will have knowledge of all circumstances that may adversely affect such investment.
Investments that are subordinated or otherwise junior in an issuer’s capital structure and that involve privately negotiated structures expose us to greater risk of loss.
In addition to our senior floating-rate commercial mortgage loans, our portfolio contains mezzanine loans, CMBS, CLOs and a B-note, and in the future, we may invest in preferred equity investments and other investments that are subordinated or otherwise junior in an issuer’s capital structure and that involve privately negotiated structures. Any investments in subordinated debt and mezzanine tranches of a borrower’s capital structure and our remedies with respect thereto, including the ability to foreclose on any collateral securing such investments, are subject to the rights of any senior creditors and, to the extent applicable, contractual intercreditor and/or participation agreement provisions. Significant losses related to such loans or investments could adversely affect our results of operations and financial condition.
Investments in subordinated debt involve greater credit risk of default than the senior classes of the issue or series. As a result, with respect to any investments in CMBS, CLOs, B-notes, mezzanine loans and other subordinated debt, we would potentially receive payments or interest distributions after, and must bear the effects of losses or defaults on the senior debt (including underlying senior mortgage loans, class A-Notes, senior mezzanine loans, preferred equity or senior CMBS or CLO bonds, as applicable) before the holders of other more senior tranches of debt instruments with respect to such issuer. As the terms of such loans and investments are subject to contractual relationships among lenders, co-lending agents and others, they can vary significantly in their structural characteristics and other risks.
Mezzanine loans are by their nature structurally subordinated to more senior property-level financings. If a borrower defaults on a mezzanine loan or on debt senior to that loan, or if the borrower is in bankruptcy, the mezzanine loan will be satisfied only after the property-level debt and other senior debt is paid in full. As a result, a partial loss in the value of the underlying collateral can result in a total loss of the value of the mezzanine loan. In addition, even if we are able to foreclose on the underlying collateral following a default on a mezzanine loan, we would be substituted for the defaulting borrower and, to the extent income generated on the underlying property is insufficient to meet outstanding debt obligations on the property, we may need to commit substantial additional capital and/or deliver a replacement guarantee by a creditworthy entity, which could include us, to stabilize the property and prevent additional defaults to lenders with existing liens on the property.
Our portfolio contains one B-note, and we may also originate or acquire commercial real estate B-notes in the future, which are mortgage loans that are typically secured by a first mortgage on a single commercial property or group of related properties, but subordinated to an A-note secured by the same first mortgage on the same collateral. As a result, if a borrower defaults, there may not be sufficient funds remaining for B-note holders after payment to the A-note holders. Because each transaction is privately negotiated, B-notes can vary in their structural characteristics and risks. For example, the rights of holders of B-notes to control the process following a borrower default may vary from transaction to transaction. Further, B-notes typically are secured by a single property and accordingly reflect the risks associated with significant concentration. Losses related to our B-notes could adversely affect our financial condition and results of operations.
Investments in preferred equity involve a greater risk of loss than conventional debt financing due to a variety of factors, including their non-collateralized nature and subordinated ranking to other loans and liabilities of the entity in which such preferred equity is held. Accordingly, if the issuer defaults on our preferred equity investment, we would only be able to proceed against such entity in accordance with the terms of the preferred equity, and not against any property owned by such entity. Furthermore, in the event of bankruptcy or foreclosure, we would only be able to recoup our investment after all lenders to, and other creditors of, such entity are paid in full. As a result, we may lose all or a significant part of any such investment, which could result in significant losses.
In addition, our investments in senior mortgage loans may be effectively subordinated to the extent we borrow under a financing facility loan (which can be in the form of a repurchase agreement) or similar facility and pledge the senior mortgage loan as collateral. Under these arrangements, the lender has a right to repayment of the borrowed amount before we can collect on the value of the senior mortgage loan, and therefore if the value of the pledged senior mortgage loan decreases below the amount we have borrowed, we would experience a loss.
Our risk management policies and procedures may not be effective.
We have established and maintain risk management policies and procedures designed to identify, monitor and mitigate financial risks, such as credit risk, interest rate risk, prepayment risk and liquidity risk, as well as operational risks related to our business, assets and liabilities. These policies and procedures may not sufficiently identify all of the risks to which we are or may become exposed or mitigate the risks we have identified. Any expansion of our business activities may result in our being exposed to risks to which we have not previously been exposed or may increase our exposure to certain types of risks. Any failure to effectively identify and mitigate the risks to which we are exposed could have an adverse effect on our business, results of operations and financial condition.
Difficulty or delays in redeploying the proceeds from repayments of our existing loans and investments may cause our financial performance and returns to investors to suffer.
As our loans and investments are repaid, we will have to redeploy the proceeds we receive into new loans and investments, repay borrowings under our credit facilities, pay dividends to our stockholders or repurchase outstanding shares of our common stock. It is possible that we will fail to identify reinvestment options that would provide returns or a risk profile that is comparable to the asset that was repaid. If we fail to redeploy, or experience any delays in redeploying, the proceeds we receive from repayment of a loan in equivalent or better alternatives, our financial performance and returns to investors could suffer.
We may be subject to lender liability claims, and if we are held liable under such claims, we could be subject to losses.
In recent years, a number of judicial decisions have upheld the right of borrowers to sue lending institutions on the basis of various evolving legal theories, collectively termed “lender liability.” Generally, lender liability is founded on the premise that a lender has either violated a duty, whether implied or contractual, of good faith and fair dealing owed to the borrower or has assumed a degree of control over the borrower resulting in the creation of a fiduciary duty owed to the borrower or its other creditors or stockholders. We cannot assure you that such claims will not arise or that we will not be subject to significant liability if a claim of this type did arise.
Liability relating to environmental matters may impact the value of properties that we may acquire upon foreclosure of the properties underlying our investments.
To the extent we take title to any of the properties underlying our investments, we may be subject to environmental liabilities arising from such properties. Under various U.S. federal, state and local laws, an owner or operator of real property may become liable for the costs of removal of certain hazardous substances released on its property. These laws often impose liability without regard to whether the owner or operator knew of, or was responsible for, the release of such hazardous substances.
The presence of hazardous substances may adversely affect an owner’s ability to sell real estate or borrow using real estate as collateral. To the extent an owner of a property underlying one of our debt investments becomes liable for removal costs, the ability of the owner to make payments to us may be reduced, which in turn may adversely affect the value of the relevant asset held by us and our ability to make distributions to our stockholders.
To the extent we acquire any property underlying our investments, the presence of hazardous substances on such property may adversely affect our ability to sell the property and we may incur substantial remediation costs, thus harming our financial condition. The discovery of material environmental liabilities attached to such properties could have a material adverse effect on our results of operations and financial condition and our ability to make distributions to our stockholders.
The properties underlying our investments may be subject to other unknown liabilities that could adversely affect the value of these properties, and as a result, our investments.
Properties underlying our investments may be subject to other unknown or unquantifiable liabilities that may adversely affect the value of our investments. Such defects or deficiencies may include title defects, title disputes, liens or other encumbrances on the mortgaged properties. The discovery of such unknown defects, deficiencies and liabilities could affect the ability of our borrowers to make payments to us or could affect our ability to take title to and sell the underlying properties, which could adversely affect our results of operations and financial condition.
The commercial real estate debt investments in which we invest are subject to the property manager’s ability to generate net income from the property, and if net income from the property is insufficient to satisfy debt service, then these investments may be subject to delinquency, foreclosure and loss, which may adversely impact our business, results of operations and financial condition.
We invest in the commercial real estate debt market, with a focus on originating senior commercial mortgage loans, and we may invest in other secondary target investments, including mezzanine loans, B-notes, CMBS, CLOs and preferred equity investments. Such investments are subject to risks of delinquency, foreclosure and loss. The ability of a borrower to repay a loan secured by an income-producing property typically is dependent primarily upon the successful operation of the property, as opposed to the borrower’s independent income or assets. If the net operating income of the property is reduced, the borrower’s ability to repay the loan may be impaired. The net operating income of an income-producing property can be affected by numerous factors, including:
| |
• | success of tenant businesses; |
| |
• | property management decisions, including decisions on capital improvements; |
| |
• | property location and condition; |
| |
• | competition from similar properties; |
| |
• | changes in national, regional or local economic conditions; |
| |
• | changes in regional or local real estate values; |
| |
• | changes in regional or local rental or occupancy rates; |
| |
• | changes in interest rates and in the state of the debt and equity capital markets, including the availability of debt financing for commercial real estate; |
| |
• | changes in governmental rules, regulations, and fiscal policies, including real estate taxes, environmental legislation and zoning laws; |
| |
• | environmental contamination; |
| |
• | fraudulent acts or theft on the part of the property owner, sponsor and/or manager; and |
| |
• | terrorism, social unrest, civil disturbances, and other events which may result in property damage, decrease the availability of or increase the cost of insurance or otherwise result in uninsured losses. |
In the event any of the properties or entities underlying or collateralizing our commercial real estate loans or investments are adversely impacted by any of the foregoing events or occurrences, the value of, and return on, such investments could be reduced, which in turn would adversely affect our results of operations and financial condition.
Loans on properties in transition involve a greater risk of loss than conventional mortgage loans.
We have in the past originated and acquired, and may in the future originate or acquire, transitional loans to borrowers who are seeking relatively short-term capital to be used in an acquisition or rehabilitation of a property. The typical borrower under a transitional loan has usually identified an asset it believes is an undervalued asset that has been under-managed and/or is located in a recovering market. If the market in which the asset is located fails to improve according to the borrower’s projections, or if the borrower fails to improve the quality of the asset’s management and/or the value of the asset or stabilize the property, the borrower may not be able to satisfy the transitional loan through a sale of the property or conventional financing, and we bear the risk of loss of principal and non-payment of interest and fees.
Borrowers often use the proceeds of a conventional mortgage loan to repay a transitional loan. Transitional loans therefore are subject to risks of a borrower’s inability to obtain permanent financing to repay the transitional loan. In the event of any default under transitional loans that may be held by us, we bear the risk of loss of principal and non-payment of interest and fees to the extent of any deficiency between the value of the mortgage collateral and the principal amount and unpaid interest of the transitional loan. To the extent we suffer such losses with respect to these transitional loans, it could adversely affect our results of operations and financial condition.
Risks of cost overruns and noncompletion of renovations of properties in transition may result in significant losses.
The renovation, refurbishment or expansion of a property by a borrower involves risks of cost overruns and noncompletion. Estimates of the costs of improvements to bring an acquired property up to standards established for the market position intended for that property may prove inaccurate. Other risks may include rehabilitation costs exceeding original estimates, possibly making a project uneconomical, environmental risks, delays in legal and other approvals and rehabilitation and subsequent leasing of the property not being completed on schedule. If such renovation is not completed in a timely manner, or if it costs more than expected, the borrower may experience a prolonged reduction of net operating income and may not be able to make payments on our investment on a timely basis or at all, which could result in significant losses.
Our investments in CMBS, CLOs, and other similar structured finance investments, as well as those we structure, sponsor, or arrange may pose additional risks, including the risks arising from the securitization process and the risk that the special servicer may take actions that could adversely affect our interests.
Our portfolio contains CMBS and we may invest in additional CMBS, CLOs and other similar securities in the future, which may be subordinated classes of securities in a structure of securities secured by a pool of loans. Accordingly, such securities may be the first or among the first to bear the loss upon a restructuring or liquidation of the underlying collateral and the last to receive payment of interest and principal, with only a nominal amount of equity or other debt securities junior to such positions. The estimated fair values of such subordinated interests tend to be much more sensitive to adverse economic downturns and underlying borrower developments than more senior securities. A projection of an economic downturn, for example, could cause a decline in the price of lower credit quality CMBS, CLOs or CDOs because the ability of borrowers to make principal and interest payments on the loans underlying such securities may be impaired.
Subordinate interests such as CMBS, CLOs, CDOs and similar structured finance investments generally are not actively traded and are relatively illiquid investments. Volatility in CMBS, CLO and CDO trading markets may cause the value of these investments to decline. In addition, if the underlying mortgage portfolio has been overvalued by the originator, or if the values subsequently decline and, as a result, less collateral value is available to satisfy interest and principal payments and any other fees in connection with the trust or other conduit arrangement for such securities, we may incur significant losses
With respect to the CMBS, CLOs and other similar securities, overall control over the special servicing of the related underlying loans are held by a “directing certificate holder” or a “controlling class representative,” which is appointed by the holders of the most subordinated class of securities in such series. To the extent we acquire classes of existing series of such securities, we will not have the right to appoint the directing certificate holder. In connection with the servicing of the specially serviced loans, the related special servicer may, at the direction of the directing certificate holder, take actions with respect to the specially serviced mortgage loans that could adversely affect our interests. See “Risks Related to Our Financing and Hedging-Use of non-recourse securitizations to finance our loans and investments may expose us to risks that could result in losses” for a discussion of additional risks related to our securitization transactions.
Declines in the market values of any available-for-sale investments may adversely affect our results of operations and financial condition.
Most of our investments are valued at cost, however, we value available-for-sale investments quarterly at fair value, as determined in accordance with ASC 820, Fair Value Measurements and Disclosures, or ASC 820, which may include unobservable inputs. Because such valuations are subjective, the fair value of certain of our investments may fluctuate over short periods of time and our determinations of fair value may differ materially from the values that would have been used if a ready market for these investments existed. The value of our common stock could be adversely affected if our determinations regarding the fair value of these investments are materially higher than the values that we ultimately realize upon their disposal.
Changes in the market values of available-for-sale investments are directly charged or credited to stockholders’ equity. As a result, a decline in values of available-for-sale investments may result in connection with factors that are out of our control and adversely affect our book value. Moreover, if the decline in value of an available-for-sale investment is other than temporary, such decline will reduce our earnings.
Any warehouse finance facilities that we may obtain in the future may limit our ability to originate or acquire assets, and we may incur losses if the collateral is liquidated.
We may utilize, if available, warehouse finance facilities pursuant to which we would accumulate loans in anticipation of a securitization or other financing, which assets would be pledged as collateral for such facilities until the securitization or other transaction is consummated. In order to borrow funds to originate or acquire assets under any future financing facilities, we expect that our lenders thereunder would have the right to review the potential assets for which we are seeking financing. We may be unable to obtain the consent of a lender to originate or acquire assets that we believe would be beneficial to us and we may be unable to obtain alternate financing for such assets.
In addition, no assurance can be given that a securitization or other financing would be consummated with respect to the assets being warehoused. If the securitization or other financing is not consummated, the lender could demand repayment of the facility, and in the event that we were unable to timely repay, could liquidate the financed collateral and we would then have to pay any amount by which the original purchase price of the collateral assets exceeds its sale price, subject to negotiated caps, if any, on our exposure. In addition, regardless of whether the securitization or other financing is consummated, if any of the warehoused collateral is sold before the completion, we would have to bear any resulting loss on the sale.
The foreclosure process with respect to any loan may be difficult, lengthy and costly and the liquidation proceeds we receive upon sale of the underlying real estate may not be sufficient to cover our cost basis in the loan.
We may find it necessary or desirable to foreclose on certain of the loans we originate or acquire, and the foreclosure process may be lengthy and expensive. Whether or not we have participated in the negotiation of the terms of any such loans, we cannot assure you as to the adequacy of the protection of the terms of the applicable loan, including the validity or enforceability of the loan and the maintenance of the anticipated priority and perfection of the applicable security interests. Furthermore, claims may be asserted by lenders or borrowers that might interfere with enforcement of our rights. Borrowers may resist foreclosure actions by asserting numerous claims, counterclaims and defenses against us, including, without limitation, lender liability claims and defenses, even when the assertions may have no basis in fact, in an effort to prolong the foreclosure action and seek to force the lender into a modification of the loan or a favorable buy-out of the borrower’s position in the loan. In some states, foreclosure actions can take several years or more to litigate. At any time prior to or during the foreclosure proceedings, the borrower may file for bankruptcy, which would have the effect of staying the foreclosure actions and further delaying the foreclosure process and potentially results in a reduction or discharge of a borrower’s debt. Foreclosure may create a negative public perception of the related property, resulting in a diminution of its value.
Even if we are successful in foreclosing on a loan, the liquidation proceeds upon sale of the underlying real estate may not be sufficient to recover our cost basis in the loan, resulting in a loss. Furthermore, any costs or delays involved in the foreclosure of the loan or a liquidation of the underlying property will further reduce the net proceeds and, thus, increase any such loss to us.
Any credit ratings assigned to our investments will be subject to ongoing evaluations and revisions and we cannot assure you that those ratings will not be downgraded.
Some of our investments, including the notes issued in our securitization transactions for which we are required to retain a portion of the credit risk, may be rated by rating agencies. Any credit ratings on our investments are subject to ongoing evaluation by credit rating agencies, and we cannot assure you that any such ratings will not be changed or withdrawn by a rating agency in the future if, in its judgment, circumstances warrant. If rating agencies assign a lower-than-expected rating or reduce or withdraw, or indicate that they may reduce or withdraw, their ratings of our investments in the future, the value of our investments could significantly decline, which would adversely affect the value of our investment portfolio and could result in losses upon disposition or the failure of borrowers to satisfy their debt service obligations to us.
Investments in nonconforming and non-investment grade rated commercial real estate loans or securities involve increased risk of loss.
Certain commercial real estate debt investments may not conform to conventional loan standards applied by traditional lenders and either will not be rated or will be rated as non-investment grade by the rating agencies. The non-investment grade ratings for these assets typically result from the overall leverage of the loans, the lack of a strong operating history for the properties underlying the loans, the borrowers’ credit history, the underlying properties’ cash flow or other factors. As a result, these investments should be expected to have a higher risk of default and loss than investment grade rated assets. Losses related to our non-investment grade loans or securities would adversely affect our financial condition and results of operations.
Insurance on commercial real estate loans may not cover all losses.
Our commercial real estate loans may be subject to certain types of losses, generally of a catastrophic nature, such as earthquakes, floods, hurricanes, terrorism or acts of war, which may be uninsurable or not economically insurable. Inflation, changes in building codes and ordinances, environmental considerations and other factors also might result in insurance proceeds insufficient to repair or replace a property if it is damaged or destroyed. Under these circumstances, the insurance proceeds received with respect to a property relating to one of our investments might not be adequate to restore our economic position with respect to our investment. Any uninsured loss could result in the corresponding nonperformance of or loss on our investment related to such property.
We depend on third-party service providers, including loan servicers, for a variety of services related to our business. We are, therefore, subject to the risks associated with third-party service providers.
We depend on a variety of services provided by third-party service providers related to our investments in commercial real estate debt investments as well as for general operating purposes. For example, we rely on the servicers who service the commercial real estate loans that we invest in and commercial real estate loans underlying CMBS, CLOs and other commercial real estate debt investments to, among other things, collect principal and interest payments on such commercial real estate loans and perform certain asset management services in accordance with applicable laws and regulations. Loan servicers and other service providers, such as trustees, appraisers and other due diligence vendors and document custodians, may fail to perform or otherwise not perform in a manner that promotes our interests. This may include systems failures, security breaches and errors that could significantly disrupt our business, including resulting in nonperformance of or loss of investments or defaults under our financing facilities.
Changes to, or the elimination of, LIBOR may adversely affect interest expense related to our loans and investments.
Regulators and law-enforcement agencies from a number of governments, including entities in the United States, Japan, Canada and the United Kingdom, have been conducting civil and criminal investigations into whether the banks that contributed to the British Bankers’ Association, or the BBA, in connection with the calculation of daily LIBOR may have underreported or otherwise manipulated or attempted to manipulate LIBOR. Several financial institutions have reached settlements with the U.S. Commodity Futures Trading Commission, the U.S. Department of Justice Fraud Section and the U.K. Financial Services Authority in connection with investigations by such authorities into submissions made by such financial institutions to the bodies that set LIBOR and other interbank offered rates. In such settlements, such financial institutions admitted to submitting rates to the BBA that were lower than the actual rates at which such financial institutions could borrow funds from other banks. Additional investigations remain ongoing with respect to other major banks and no assurance can be made that there will not be further admissions or findings of rate setting manipulation or that improper manipulation of LIBOR or other similar inter-bank lending rates will not occur in the future.
Based on a review conducted by the Financial Conduct Authority of the U.K., or the FCA, and a consultation conducted by the European Commission, proposals have been made for governance and institutional reform, regulation, technical changes and contingency planning. In particular: (a) new legislation has been enacted in the United Kingdom pursuant to which LIBOR submissions and administration are now “regulated activities” and manipulation of LIBOR has been brought within the scope of the market abuse regime; (b) legislation has been proposed which if implemented would, among other things, alter the manner in which LIBOR is determined, compel more banks to provide LIBOR submissions, and require these submissions to be based on actual transaction data; and (c) LIBOR rates for certain currencies and maturities are no longer published daily. In addition, pursuant to authorization from the FCA, ICE Benchmark Administration Limited (formerly NYSE Euronext Rate Administration Limited), or the IBA, took over the administration of LIBOR from the BBA on February 1, 2014. Any new administrator of LIBOR may make methodological changes to the way in which LIBOR is calculated or may alter, discontinue or suspend calculation or dissemination of LIBOR.
In a speech on July 27, 2017, Andrew Bailey, the Chief Executive of the FCA, announced the FCA’s intention to cease sustaining LIBOR after 2021. The FCA has statutory powers to require panel banks to contribute to LIBOR where necessary. The FCA has decided not to ask, or to require, that panel banks continue to submit contributions to LIBOR beyond the end of 2021. The FCA has indicated that it expects that the current panel banks will voluntarily sustain LIBOR until the end of 2021. The FCA’s intention is that after 2021, it will no longer be necessary for the FCA to ask, or to require, banks to submit contributions to LIBOR. The FCA does not intend to sustain LIBOR through using its influence or legal powers beyond that date. It is possible that the IBA and the panel banks could continue to produce LIBOR on the current basis after 2021, if they are willing and able to do so, but we cannot make assurances that LIBOR will survive in its current form, or at all. We cannot predict the effect of the FCA’s decision not to sustain LIBOR, or, if changes are ultimately made to LIBOR, the effect of those changes. The U.S. Federal Reserve, in conjunction with the Alternative Reference Rates Committee, a steering committee comprised of large U.S. financial institutions, is considering replacing U.S.-dollar LIBOR with the Secured Overnight Financing Rate, or SOFR, a new index calculated by short-term repurchase agreements, backed by Treasury securities. Although there have been a few issuances utilizing SOFR or the Sterling Over Night Index Average, an alternative reference rate that is based on transactions, it is unknown whether these alternative reference rates will attain market acceptance as replacements for LIBOR.
As of December 31, 2018, our loan portfolio included $3.2 billion of floating rate loans for which the interest rate was tied to LIBOR. If LIBOR is no longer available, our loan documents generally allow us to choose a new index based upon comparable information. For some of our more seasoned loans, however, if LIBOR is no longer available, we may need to renegotiate with borrowers to determine a replacement index or rate of interest. There is currently no definitive information regarding the future utilization of LIBOR or of any particular replacement rate. As such, the potential effect of any such event on our cost of capital and net investment income cannot yet be determined and any changes to benchmark interest rates could increase our financing costs, which could impact our results of operations, cash flows and the market value of our investments. In addition, the elimination of LIBOR and/or changes to another index could result in mismatches with the interest rate of investments that we are financing. See “Risk Factors-Risks Related to Our Financing and Hedging-Our use of leverage may create a mismatch with the duration and interest rate of investments that we are financing.”
Risks Related To Our Financing and Hedging
We have significant debt and may incur additional debt, which subjects us to increased risk of loss and may reduce cash available for distributions to our stockholders.
We have substantial debt and, subject to market conditions and availability, we may incur a significant amount of additional debt through bank credit facilities (including term loans and revolving facilities), repurchase agreements, warehouse facilities and structured financing arrangements, public and private debt issuances and derivative instruments, in addition to transaction or asset specific funding arrangements. We may also issue additional debt or equity securities to fund our growth. The percentage of leverage we employ varies depending on our available capital, our ability to obtain and access financing arrangements with lenders, the type of asset we are funding, whether the financing is recourse or non-recourse, debt restrictions contained in those financing arrangements and the lenders’ and rating agencies’ estimate of the stability of our investment portfolio’s cash flow. We may significantly increase the amount of leverage we utilize at any time without approval of our board of directors. In addition, we may leverage individual assets at substantially higher levels. Our substantial debt could subject us to many risks that, if realized, would materially and adversely affect us, including the risk that:
| |
• | our cash flow from operations may be insufficient to make required payments of principal of and interest on our debt, which is likely to result in (a) acceleration of such debt (and any other debt containing a cross-default or cross-acceleration provision), which we then may be unable to repay from internal funds or to refinance on favorable terms, or at all, (b) our inability to borrow undrawn amounts under our financing arrangements, even if we are current in payments on borrowings under those arrangements, which would result in a decrease in our liquidity, and/or (c) the loss of some or all of our collateral assets to foreclosure or sale; |
| |
• | our debt may increase our vulnerability to adverse economic and industry conditions with no assurance that investment yields will increase in an amount sufficient to offset the higher financing costs; |
| |
• | we may be required to dedicate a substantial portion of our cash flow from operations to payments on our debt, thereby reducing funds available for operations, future business opportunities, stockholder distributions or other purposes; and |
| |
• | we may not be able to refinance any debt that matures prior to the maturity (or realization) of an underlying investment it was used to finance on favorable terms or at all. |
There can be no assurance that a leveraging strategy will be successful and may subject us to increased risk of loss and could adversely affect our results of operations and financial condition.
We may not be able to raise the capital required to finance our assets and grow our business.
The operation of our business requires access to debt and equity capital that may or may not be available on favorable terms or at the desired times, or at all. In addition, we may invest in certain investments for which financing has historically been difficult or costly to obtain. Any limitation on our ability to obtain financing for our target investments could require us to seek equity or debt capital that may be more costly or unavailable to us. We cannot assure you that we will have access to any debt or equity capital on favorable terms or at the desired times, or at all. Our inability to raise such capital or obtain financing on favorable terms could materially adversely impact our business, operations, financial condition, liquidity and our ability to make distributions to stockholders.
Our existing financing facilities impose, and additional financing facilities may impose, restrictive covenants, which may restrict our flexibility to determine our operating policies and investment strategy.
We borrow funds under repurchase agreements and other financing arrangements with various counterparties. The documents that govern these financing arrangements and the related guarantees contain, and additional lending facilities may contain, customary affirmative and negative covenants, including financial covenants applicable to us that may restrict our flexibility to determine our operating policies and investment strategy. As a result, we may not be able to leverage our assets as fully as we would otherwise choose, which could reduce our return on assets. If we fail to meet or satisfy any of these covenants, we would be in default under these agreements, and our lenders could elect to declare outstanding amounts due and payable, terminate their commitments, require the posting of additional collateral and enforce their interests against existing collateral. We may also be subject to cross-default and acceleration rights in our other debt arrangements. Further, this could also make it difficult for us to satisfy the distribution requirements necessary to maintain our qualification as a REIT for U.S. federal income tax purposes.
Interest rate fluctuations could increase our financing costs, which could lead to a significant decrease in our results of operations, cash flows and the market value of our investments.
To the extent that our financing costs are determined by reference to floating rates, such as LIBOR, the amount of such costs will depend on the level and movement of interest rates. In a period of rising interest rates, our interest expense on floating rate debt would increase, while any additional interest income we earn on our floating rate investments may be subject to caps and may not compensate for such increase in interest expense. At the same time, the interest income we earn on our fixed rate investments would not change, the duration and weighted average life of our fixed rate investments would increase and the market value of our fixed rate investments would decrease. Similarly, in a period of declining interest rates, our interest income on floating rate investments would decrease, while any decrease in the interest we are charged on our floating rate debt may be subject to floors and may not compensate for such decrease in interest income and interest we are charged on our fixed rate debt would not change. Any such scenario could adversely affect our results of operations and financial condition.
Use of non-recourse securitizations to finance our loans and investments, may expose us to risks that could result in losses.
We have securitized and may in the future, to the extent consistent with the REIT requirements, seek to securitize certain of our portfolio investments. This involves creating a special-purpose vehicle, contributing a pool of our assets to the entity, and selling interests in the entity or other securities issued by the entity on a non-recourse basis to purchasers (whom we would expect to be willing to accept a lower interest rate to invest in investment-grade securities backed by loan pools). We would expect to retain all or a portion of the equity and potentially other tranches in the securitized pool of loans or investments. In addition, we have in the past, and may in the future retain a pari passu participations in some or all of the securitized loans. Investments in CMBS, CLOs and other similar structured finance investments, as well as those we structure, sponsor or arrange, pose additional risks, including the risks of the securitization process and the risk that the special servicer may take actions that could adversely affect our interests.
Prior to any such financing, we may use facilities to finance the acquisition of securities until a sufficient quantity of investments had been accumulated, at which time we would refinance these facilities through a securitization, such as a CMBS, or issuance of CLOs, or the private placement of loan participations or other financing. If we were to employ this strategy, we would be subject to the risk that we would not be able to acquire, during the period that our short-term facilities are available, a sufficient amount of eligible investments to maximize the efficiency of a CMBS, CLO or private placement issuance. Moreover, conditions in the capital markets, including volatility and disruption in the capital and credit markets, may not permit a non-recourse securitization at any particular time or may make the issuance of any such securitization less attractive to us even when we do have sufficient eligible assets. We may also suffer losses if the value of the loans we acquire declines prior to securitization. Declines in the value of a commercial real estate loan can be due to, among other things, changes in interest rates and changes in the credit quality of the loan. In addition, we may suffer a loss due to the incurrence of transaction costs related to executing these transactions. To the extent that we incur a loss executing or participating in securitizations for the reasons described above or for other reasons, it could materially and adversely impact our business and financial condition.
In addition, the securitization of our portfolio might magnify our exposure to losses because any equity interest we retain in the issuing entity would be subordinate to the notes issued to investors and we would, therefore, absorb all of the losses sustained with respect to a securitized pool of assets before the owners of the notes experience any losses.
The inability to securitize our portfolio may hurt our performance and our ability to grow our business. At the same time, the securitization of our loans or investments might expose us to losses, as the residual loans or investments in which we do not sell interests will tend to be riskier and more likely to generate losses. Moreover, the Dodd-Frank Act Wall Street Reform and Consumer Protection Act of 2010, or Dodd-Frank Act, contains a risk retention requirement for all asset-backed securities, which requires both public and private securitizers to retain not less than 5% of the credit risk of the assets collateralizing any asset-backed security issuance. Significant restrictions exist, and additional restrictions may be added in the future, regarding who may hold risk retention interests, the structure of the entities that hold risk retention interests and when and how such risk retention interests may be transferred. Therefore such risk retention interests will generally be illiquid. As a result of the risk retention requirements, we have and may in the future be required to purchase and retain certain interests in a securitization into which we sell loans and/or when we act as issuer, may be required to sell certain interests in a securitization at prices below levels that such interests have historically yielded and/or may be required to enter into certain arrangements related to risk retention that we have not historically been required to enter into. Accordingly, the risk retention rules may increase our potential liabilities and/or reduce our potential profits in connection with securitization of loans. It is likely, therefore, that these risk retention rules will increase the administrative and operational costs of asset securitizations.
Our rights under any repurchase agreements are subject to the effects of bankruptcy laws in the event of the bankruptcy or insolvency of us or our lenders under the repurchase agreements.
In the event of our insolvency or bankruptcy, certain repurchase agreements may qualify for special treatment under the U.S. Bankruptcy Code, the effect of which, among other things, would be to allow the lender under the applicable repurchase agreement to avoid the automatic stay provisions of the U.S. Bankruptcy Code and to foreclose on the collateral agreement without delay. In the event of the insolvency or bankruptcy of a lender during the term of a repurchase agreement, the lender may be permitted, under applicable insolvency laws, to repudiate the contract, and our claim against the lender for damages may be treated simply as an unsecured creditor. In addition, if the lender is a broker or dealer subject to the Securities Investor Protection Act of 1970, or an insured depository institution subject to the Federal Deposit Insurance Act, our ability to exercise our rights to recover our assets under a repurchase agreement or to be compensated for any damages resulting from the lender’s insolvency may be further limited by those statutes. These claims would be subject to significant delay and, if and when received, may be substantially less than the damages we actually incur.
We may be subject to losses arising from current and future guarantees of debt and contingent obligations of our subsidiaries.
We currently guarantee certain obligations of our subsidiaries under the various financing facilities that provide for significant aggregate borrowings and we may in the future guarantee the performance of additional subsidiaries’ obligations, including, but not limited to, additional repurchase agreements, derivative agreements and unsecured indebtedness.
If a counterparty to a repurchase agreement defaults on its obligation to resell the underlying security back to us at the end of the purchase agreement term, or if the value of the underlying asset has declined as of the end of that term, or if we default on our obligations under the repurchase agreement, we may incur losses.
Under our repurchase agreements and under any repurchase agreements we enter into in the future, we sell the assets to lenders (i.e., repurchase agreement counterparties) and receive cash from the lenders. The lenders are obligated to resell the same assets back to us at the end of the term of the repurchase agreement. Because the cash that we receive from the lender when we initially sell the assets to the lender is less than the value of those assets (the difference being the “haircut”), if the lender defaults on its obligation to resell the same assets back to us, we would incur a loss on the repurchase agreement equal to the amount of the haircut (assuming there was no change in the value of the securities). We would also incur losses on a repurchase agreement if the value of the underlying assets has declined as of the end of the repurchase agreement term, because we would have to repurchase the assets for their initial value but would receive assets worth less than that amount. Further, if we default on our obligations under a repurchase agreement, the lender will be able to terminate the repurchase agreement and cease entering into any other repurchase agreements with us. In the future, our repurchase agreements and any new repurchase agreements we may enter into are likely to contain cross-default provisions, so that if a default occurs under any repurchase agreement, the lender can also declare a default with respect to all other repurchase agreements they have with us. If a default occurs under any of our repurchase agreements and a lender terminates one or more of its repurchase agreements, we may need to enter into replacement repurchase agreements with different lenders. There can be no assurance that we will be successful in entering into such replacement repurchase agreements on the same terms as the repurchase agreements that were terminated or at all. Any losses that we incur on our repurchase agreements could adversely affect our earnings and thus our cash available for distribution to stockholders.
Our use of financing may create a mismatch with the duration and interest rate of the investments that we are financing.
We intend to structure our financing such that we minimize the difference between the term of our investments and the term of the financing for such investments. In the event that our financing is for a shorter term than the financed investment, we may not be able to extend or find appropriate replacement financing and that would have an adverse impact on our liquidity and our returns. In the event that our financing is for a longer term than the financed investment, we may not be able to repay such financing or replace the financed investment with an optimal substitute or at all, which will negatively impact our desired leveraged returns.
We attempt to structure our financing such that we minimize the variability between the interest rate of our investments and the interest rate of our financing - financing floating rate investments with floating rate financing and fixed rate investments with fixed rate financing. If such a product is not available to us from our lenders on reasonable terms, we may use hedging instruments to effectively create such a match. For example, in the case of fixed rate investments, we may finance such investments with floating rate financing, but effectively convert all or a portion of the attendant financing to fixed rate using hedging strategies.
Our attempts to mitigate such risk are subject to factors outside of our control, such as the availability to us of favorable financing and hedging options, which is subject to a variety of factors, of which duration and term matching are only two. A duration mismatch may also occur when borrowers prepay their loans faster or slower than expected. The risks of a duration mismatch are also magnified by the potential for the extension of loans in order to maximize the likelihood and magnitude of their recovery value in the event the loans experience credit or performance challenges. Employment of this asset management practice would effectively extend the duration of our investments, while our hedges or liabilities may have set maturity dates.
We may enter into hedging transactions that expose us to contingent liabilities in the future, which may adversely affect our financial results or cash available for distribution to stockholders.
In the future, we may engage in transactions intended to hedge against various risks to our portfolio, including the exposure to changes in interest rates. The extent of our hedging activity will vary in scope based on, among other things, the level and volatility of interest rates, the type of assets held and other market conditions. Although these transactions are intended to reduce our exposure to various risks, hedging may fail to adequately protect or could adversely affect us because, among other things:
| |
• | hedging can be expensive, particularly during periods of volatile or rapidly changing interest rates; |
| |
• | available hedges may not correspond directly with the risks for which protection is sought; |
| |
• | the duration of the hedge may not match the duration of the related liability; |
| |
• | the amount of income that a REIT may earn from certain hedging transactions (other than through our taxable REIT subsidiaries, or TRSs) is limited by U.S. federal income tax provisions; |
| |
• | the credit quality of a hedging counterparty may be downgraded to such an extent that it impairs our ability to sell or assign our side of the hedging transaction; and |
| |
• | the hedging counterparty may default on its obligations. |
Subject to maintaining our qualification as a REIT and satisfying the criteria for no-action relief from the CFTC’s Commodity Pool Operator, or CPO, registration rules, there are no current limitations on the hedging transactions that we may undertake. Our hedging transactions could require us to fund large cash payments in certain circumstances (e.g., the early termination of the hedging instrument caused by an event of default or other early termination event, or a demand by a counterparty that we make increased margin payments).
Our ability to fund these obligations will depend on the liquidity of our assets and our access to capital at the time. The need to fund these obligations could adversely affect our financial condition. Further, hedging transactions, which are intended to limit losses, may actually result in losses, which would adversely affect our earnings and could in turn reduce cash available for distribution to stockholders.
The Dodd-Frank Act regulates derivative transactions, including certain hedging instruments we may use in our risk management activities. Rules implemented by the CFTC pursuant to the Dodd-Frank Act require, among other things, that certain derivatives be cleared through a registered clearing facility and traded on a designated exchange or swap execution facility. These regulations could increase the operational and transactional cost of derivatives contracts and affect the number and/or creditworthiness of available counterparties. Furthermore, the enforceability of agreements underlying hedging transactions may depend on compliance with applicable statutory and commodity and other regulatory requirements and, depending on the identity of the counterparty, applicable international requirements. The business failure of a hedging counterparty will most likely result in its default. Default by a hedging counterparty may result in the loss of unrealized profits and force us to cover our commitments, if any, at the then current market price. Although generally we will seek to reserve the right to terminate our hedging positions, it may not always be possible to dispose of or close out a hedging position without the consent of the hedging counterparty and we may not be able to enter into an offsetting contract in order to cover our risk. We cannot assure you that a liquid secondary market will exist for hedging instruments purchased or sold, and we may be required to maintain a position until exercise or expiration, which could result in losses.
Our loans and investments may be subject to fluctuations in interest rates that may not be adequately protected, or protected at all, by our hedging strategies.
Our assets include loans with either floating interest rates or fixed interest rates. Floating rate loans earn interest at rates that adjust from time to time (typically monthly) based upon an index (typically one-month LIBOR). These floating rate loans are insulated from changes in value specifically due to changes in interest rates; however, the coupons they earn fluctuate based upon interest rates (again, typically one-month LIBOR) and, in a declining and/or low interest rate environment, these loans will earn lower rates of interest and this will impact our operating performance. For more information about our risks related to changes to, or the elimination of, LIBOR, see “Risk Factors-Risks Related to Our Lending and Investment Activities-Changes to, or the elimination of, LIBOR may adversely affect interest expense related to our loans and investments.” Fixed interest rate loans, however, do not have adjusting interest rates and the relative value of the fixed cash flows from these loans will decrease as prevailing interest rates rise or increase as prevailing interest rates fall, causing potentially significant changes in value. We may employ various hedging strategies to limit the effects of changes in interest rates (and in some cases credit spreads), including engaging in interest rate swaps, caps, floors and other interest rate derivative products. We believe that no strategy can completely insulate us from the risks associated with interest rate changes and there is a risk that such strategies may provide no protection at all and potentially compound the impact of changes in interest rates. Hedging transactions involve certain additional risks such as counterparty risk, leverage risk, the legal enforceability of hedging contracts, the early repayment of hedged transactions and the risk that unanticipated and significant changes in interest rates may cause a significant loss of basis in the contract and a change in current period expense. We cannot make assurances that we will be able to enter into hedging transactions or that such hedging transactions will adequately protect us against the foregoing risks.
Accounting for derivatives under GAAP may be complicated. Any failure by us to meet the requirements for applying hedge accounting in accordance with GAAP could adversely affect our earnings. In particular, derivatives are required to be highly effective in offsetting changes in the value or cash flows of the hedged items (and appropriately designated and/or documented as such). If it is determined that a derivative is not highly effective at hedging the designated exposure, hedge accounting is discontinued and the changes in fair value of the instrument are included in our reported net income.
Risks Related to Our Relationship with Our Manager
Our success depends on our Manager and its key personnel. We may not find a suitable replacement if we or our Manager terminates the management agreement.
We do not have any employees and are externally managed by our Manager. Our Manager has significant discretion as to the implementation of our investment and operating policies and strategies. Accordingly, our success depends on the efforts, experience, diligence, skill and network of business contacts of the officers and key personnel of our Manager and its affiliates. Our CRE team evaluates, negotiates, executes and monitors our loans and investments and advises us regarding maintenance of our qualification as a REIT and exclusion from registration under the Investment Company Act; therefore, our success depends on their skill and management expertise and continued service with our Manager and its affiliates. Furthermore, there is strong competition among financial sponsors, investment banks and other real estate debt investors for hiring and retaining qualified investment professionals and there can be no assurance that such professionals will continue to be associated with us, our Manager or its affiliates or that any replacements will perform well. The departure of any of the officers or key personnel of our Manager and its affiliates could have a material adverse effect on our performance.
In addition, we can offer no assurance that our Manager will remain our external manager or that we will continue to have access to our Manager’s officers and key personnel. The initial term of the management agreement is for a three-year period ending on June 28, 2020 and will be automatically renewed for additional one-year terms thereafter, subject to the right of either party to elect not to renew the agreement; provided, however, that our Manager may terminate the management agreement after the initial term or after any automatic renewal term upon 180 days’ prior notice. If the management agreement is terminated and no suitable replacement is found to manage us, we may not be able to execute our business plan.
There are various conflicts of interest in our relationship with our Manager and its affiliates, which could result in decisions that are not in the best interests of our stockholders. For example, the terms of the management agreement, including fees payable, may not be as favorable to us as if they had been negotiated with an unaffiliated third party.
We are subject to conflicts of interest arising out of our relationship with our Manager and its affiliates. Each of our executive officers is an employee of Pine River Domestic Management L.P., a wholly-owned subsidiary of our Manager. As a result, the management agreement with our Manager was negotiated between related parties, and its terms, including fees payable to our Manager, may not be as favorable to us as if they had been negotiated with an unaffiliated third party. In addition, we may choose not to enforce, or to enforce less vigorously, our rights under the management agreement because of our desire to maintain our ongoing relationship with our Manager.
Our Manager and its affiliates may engage in additional management or investment opportunities that have overlapping objectives with ours, and thus will face conflicts in the allocation of resources between us, any other funds they manage and for their own accounts. Additionally, the ability of our Manager, and the officers and employees providing services to us under the management agreement, to engage in other business activities may reduce the time our Manager spends managing us. For example, our Manager and its affiliates, including certain of our officers and directors, may also serve as officers, directors or partners of other private investment vehicles, including new affiliated potential pooled investment vehicles or managed accounts not yet established, whether managed or sponsored by our Manager’s affiliates or our Manager. Under the management agreement, none of our officers are required to devote a specific amount of time to our affairs. Accordingly, we may compete with the existing funds of our Manager, its investment vehicles, other ventures and possibly other entities in the future for the time and attention of these officers and other personnel.
We may enter into additional transactions with our Manager or its affiliates. In particular, we may acquire assets from our Manager or its affiliates or make co-purchases alongside our Manager or its affiliates. These transactions may not be the result of arm’s length negotiations and may involve conflicts between our interests and the interests of our Manager and/or its affiliates. There can be no assurance that any procedural protections will be sufficient to assure that these transactions will be made on terms that will be at least as favorable to us as those that would have been obtained in an arm’s length transaction.
The personnel provided to us by our Manager, as our external manager, are not required to dedicate a specific portion of their time to the management of our business.
Neither our Manager nor any of its affiliates is obligated to dedicate any specific personnel exclusively to us nor are they or their personnel obligated to dedicate any specific portion of their time to the management of our business. Although our Chief Executive Officer, Chief Investment Officer, Chief Operating Officer, Chief Financial Officer and General Counsel are expected to spend a substantial portion of their time on our affairs, key personnel, including these individuals, provided to us by our Manager may become unavailable to us as a result of their departure from our Manager or for any other reason. As a result, we cannot provide any assurances regarding the amount of time our Manager or its affiliates will dedicate to the management of our business and our Manager and its affiliates may have conflicts in allocating their time, resources and services among our business and any other funds they may manage, and such conflicts may not be resolved in our favor. Each of our executive officers is an employee of an affiliate of our Manager, and may currently or in the future have significant responsibilities for funds or other vehicles managed by our Manager or its affiliates. Consequently, we may not receive the level of support and assistance that we otherwise might receive if we were internally managed.
Our board of directors has approved very broad investment guidelines for us and will not review or approve each investment decision made by our Manager.
Our board of directors will periodically review and update our investment guidelines and will also review our investment portfolio, but does not review or approve specific investments. Our Manager has great latitude within the broad parameters of the investment guidelines set by our board of directors in determining our investments and investment strategies, which could result in investment returns that are substantially below expectations or that result in material losses.
Our Manager’s fee structure may not create proper incentives or may cause our Manager to select investments in more risky assets to increase its incentive compensation.
We pay our Manager base management fees regardless of the performance of our portfolio. Our Manager’s entitlement to base management fees, which are not based upon performance metrics or goals, might reduce its incentive to devote its time and effort to seeking loans and investments that provide attractive risk-adjusted returns for our portfolio. Because the base management fees are also based on our outstanding equity, our Manager may also be incentivized to advance strategies that increase our equity, and there may be circumstances where increasing our equity will not optimize the returns for our stockholders. Consequently, we will be required to pay our Manager base management fees in a particular period despite experiencing a net loss or a decline in the value of our portfolio during that period.
In addition, beginning in the fourth quarter of 2018, our Manager has the ability to earn incentive fees each quarter based on our earnings, which may create an incentive for our Manager to invest in assets with higher yield potential, which are generally riskier or more speculative, or sell an asset prematurely for a gain, in an effort to increase our short-term net income and thereby increase the incentive fees to which it is entitled. If our interests and those of our Manager are not aligned, the execution of our business plan and our results of operations could be adversely affected, which could adversely affect our results of operations and financial condition.
Termination of the management agreement may be difficult and costly, which may adversely affect our inclination to end our relationship with our Manager.
Termination of the management agreement without cause would be difficult and costly. The management agreement may be amended, supplemented or modified by agreement between us and our Manager. Following the initial three-year term, the management agreement may be terminated annually upon the affirmative vote of at least two-thirds of our independent directors or upon a determination by the holders of a majority of outstanding shares of common stock, based upon (i) unsatisfactory performance by our Manager that is materially detrimental to us taken as a whole or (ii) our determination that the management fee and incentive fee payable to our Manager are not fair, subject to our Manager’s right to prevent any termination due to unfair fees by accepting a reduction of management and/or incentive fees agreed to by at least two-thirds of our independent directors. We must provide 180 days’ prior notice of any such termination. Unless terminated for cause, our Manager will be paid a termination fee equal to three times the sum of (i) the average annual base management fee and (ii) average annual incentive compensation, in each case earned by our Manager during the 24-month period immediately preceding the most recently completed calendar quarter prior to the termination date. These provisions increase the cost to us of terminating the management agreement and adversely affect our ability to terminate the management agreement without cause.
The liability of our Manager is limited under the management agreement, and we agree to indemnify our Manager and its affiliates and advisers against certain liabilities. As a result, we could experience poor performance or losses for which our Manager would not be liable.
Pursuant to the management agreement, our Manager does not assume any responsibility other than to render the services under the management agreement in good faith. It is not responsible for any action of our board of directors in following or declining to follow any advice or recommendations of our Manager, including as set forth in our investment guidelines. Our Manager and its affiliates, and any of their members, stockholders, managers, partners, personnel, officers, directors, employees, consultants and any person providing sub-advisory services to our Manager, are not liable to us, our board of directors or our stockholders, partners or members for any acts or omissions (including errors that may result from ordinary negligence, such as errors in the investment decision making process or in the trade process) performed in accordance with the management agreement, except by reason of acts or omission constituting bad faith, willful misconduct, gross negligence or reckless disregard of their respective duties under the management agreement, as determined by a final non-appealable order of a court of competent jurisdiction.
We have agreed to indemnify our Manager, its affiliates and any of their officers, stockholders, members, partners, managers, directors, personnel, employees, consultants and any person providing sub-advisory services to our Manager with respect to all expenses, losses, damages, liabilities, demands, charges and claims arising from acts of our Manager not constituting bad faith, willful misconduct, gross negligence, or reckless disregard of duties, arising from acts or omissions performed in good faith in accordance with and pursuant to the management agreement. As a result, if we experience poor performance or losses, our Manager would not be liable.
Risks Related to Our Company and Structure
We have a limited operating history as a standalone company and may not be able to operate our business successfully or generate sufficient revenue to make or sustain distributions to our stockholders.
We began operating as a public company in June 2017 when we completed our IPO, and therefore have limited operating history. We may not be as successful in establishing and expanding our brand, relationships operations and infrastructure to enable us to operate as a standalone public company, and we cannot assure you that we will be able to operate our business successfully or implement our operating policies and strategies. The results of our operations depend on several factors, including the availability of opportunities for the origination or acquisition of target investments, the level and volatility of interest rates, the availability of adequate short and long-term financing, conditions in the financial markets and economic conditions.
In addition, our future operating results and financial data may vary materially from our historical operating results and financial data due to a number of factors, including costs and expenses associated with the management agreement and being a public company. Consequently, the historical financial statements contained in this Annual Report on Form 10-K may not be useful in assessing our likely future performance.
We may change any of our strategies, policies or procedures without stockholder consent.
We may change any of our strategies, policies or procedures with respect to investments, asset allocation, growth, operations, indebtedness, financing strategy and distributions at any time without the consent of stockholders, which could result in our making investments that are different from, and possibly riskier than, our types of target investments. Changes in strategy could also result in the elimination of certain investments and business activities that we no longer view as attractive or in alignment with our business model. Shifts in strategy may increase our exposure to credit risk, interest rate risk, financing risk, default risk, regulatory risk and real estate market fluctuations. We also cannot assure you that we will be able to effectively execute or to realize the potential benefits of changes in strategy. Any such changes could adversely affect our financial condition, risk profile, results of operations, the market price of our common stock and our ability to make distributions to stockholders.
Maintaining our exclusions from registration as an investment company under the Investment Company Act imposes limits on our operations.
We currently conduct, and intend to continue to conduct, our operations so that we are not required to register as an investment company under the Investment Company Act. We believe we are not an investment company under Section 3(a)(1)(A) of the Investment Company Act because we do not engage primarily, or hold ourselves out as being engaged primarily, in the business of investing, reinvesting or trading in securities. Rather, through our wholly owned or majority-owned subsidiaries, we are primarily engaged in non-investment company businesses related to real estate. In addition, we intend to conduct our operations so that we do not come within the definition of an investment company under Section 3(a)(1)(C) of the Investment Company Act because less than 40% of our total assets on an unconsolidated basis consist of “investment securities” (the “40% test”). Excluded from the term “investment securities” (as that term is defined in the Investment Company Act) are securities issued by majority-owned subsidiaries that are themselves not investment companies and are not relying on the exclusion from the definition of investment company set forth in Section 3(c)(1) or Section 3(c)(7) of the Investment Company Act.
To maintain our status as a non-investment company, the securities issued to us by any wholly owned or majority-owned subsidiaries that we may form in the future that are excluded from the definition of investment company under Section 3(c)(1) or Section 3(c)(7) of the Investment Company Act, together with any other investment securities we may own, may not have a value in excess of 40% of the value of our total assets on an unconsolidated basis. We monitor our holdings to ensure ongoing compliance with this test, but there can be no assurance that we will be able to maintain an exclusion or exemption from registration. The 40% test limits the types of businesses in which we may engage through our subsidiaries. In addition, the assets we and our subsidiaries may originate or acquire are limited by the provisions of the Investment Company Act and the rules and regulations promulgated under the Investment Company Act, which may adversely affect our business.
We hold our assets primarily through direct or indirect wholly owned or majority-owned subsidiaries, certain of which are excluded from the definition of investment company pursuant to Section 3(c)(5)(C) of the Investment Company Act. To qualify for the exclusion pursuant to Section 3(c)(5)(C), based on positions set forth by the SEC staff, each such subsidiary generally is required to hold at least (i) 55% of its assets in “qualifying” real estate assets and (ii) at least 80% of its assets in “qualifying” real estate assets and real estate-related assets. For our subsidiaries that maintain the exclusion under Section 3(c)(5)(C) or another exclusion or exception under the Investment Company Act (other than Section 3(c)(1) or Section 3(c)(7) thereof), our interests in these subsidiaries do not and will not constitute “investment securities.”
As a consequence of our seeking to avoid the need to register from the Investment Company Act on an ongoing basis, we and/or our subsidiaries may be restricted from making certain investments or may structure investments in a manner that would be less advantageous to us than would be the case in the absence of such requirements. In particular, a change in the value of any of our assets could negatively affect our ability to maintain our exclusion from registration under the Investment Company Act and cause the need for a restructuring of our investment portfolio. For example, these restrictions may limit our and our subsidiaries’ ability to invest directly in mortgage-backed securities that represent less than the entire ownership in a pool of senior mortgage loans, debt and equity tranches of securitizations and certain asset-backed securities, non-controlling equity interests in real estate companies or in assets not related to real estate; however, we and our subsidiaries may invest in such securities to a certain extent. In addition, seeking to maintain our exclusion from the Investment Company Act may cause us and/or our subsidiaries to acquire or hold additional assets that we might not otherwise have acquired or held or dispose of investments that we and/or our subsidiaries might not have otherwise disposed of, which could result in higher costs or lower proceeds to us than we would have paid or received if we were not seeking to comply with such requirements. Thus, avoiding registration under the Investment Company Act may hinder our ability to operate solely on the basis of maximizing profits.
We determine whether an entity is a majority-owned subsidiary of our company. The Investment Company Act defines a majority-owned subsidiary of a person as a company 50% or more of the outstanding voting securities of which are owned by such person, or by another company which is a majority-owned subsidiary of such person. The Investment Company Act defines voting securities as any security presently entitling the owner or holder thereof to vote for the election of directors of a company. We treat entities in which we own at least a majority of the outstanding voting securities as majority-owned subsidiaries for purposes of the 40% test. We have not requested that the SEC or its staff approve our treatment of any entity as a majority-owned subsidiary, and neither has done so. If the SEC or its staff were to disagree with our treatment of one or more subsidiary entities as majority-owned subsidiaries, we may need to adjust our strategy and our assets in order to continue to pass the 40% test. Any adjustment in our strategy or assets could have a material adverse effect on us.
We classify our assets for purposes of certain of our subsidiaries’ Section 3(c)(5)(C) exclusion from the Investment Company Act based upon no-action positions taken by the SEC staff and interpretive guidance provided by the SEC and its staff. Based on such guidance, to qualify for the exclusion pursuant to Section 3(c)(5)(C), each such subsidiary generally is required to hold at least (i) 55% of its assets in “qualifying” real estate assets and (ii) 80% of its assets in “qualifying” real estate assets and real estate-related assets. “Qualifying” real estate assets for this purpose include mortgage loans, certain B-notes and certain mezzanine loans that satisfy various conditions as set forth in SEC staff no-action letters and other guidance, and other assets that the SEC staff in various no-action letters and other guidance has determined are the functional equivalent of senior mortgage loans for the purposes of the Investment Company Act. We treat as real estate-related assets, CMBS, B-notes and mezzanine loans that do not satisfy the conditions set forth in the relevant SEC staff no-action letters and other guidance, and debt and equity securities of companies primarily engaged in real estate businesses. We note that the SEC staff’s prior no-action positions are based on specific factual situations that may be substantially different from the factual situations we and our subsidiaries may face, and a number of these no-action positions were issued more than twenty years ago. There may be no guidance from the SEC staff that applies directly to our factual situations and as a result we may have to apply SEC staff guidance that relates to other factual situations by analogy. No assurance can be given that the SEC or its staff will concur with our classification of our assets. In addition, the SEC or its staff may, in the future, issue further guidance that may require us to re-classify our assets for purposes of the Investment Company Act, including for purposes of our subsidiaries’ compliance with the exclusion provided in Section 3(c)(5)(C) of the Investment Company Act. There is no guarantee that we will be able to adjust our assets in the manner required to maintain our exclusion from the Investment Company Act and any adjustment in our strategy or assets could have a material adverse effect on us.
To the extent that the SEC or its staff provide more specific guidance regarding any of the matters bearing upon the definition of investment company and the exemptions and exclusions to that definition, we may be required to adjust our strategy accordingly. On August 31, 2011, the SEC issued a concept release and request for comments regarding the Section 3(c)(5)(C) exclusion (Release No. IC-29778) in which it contemplated the possibility of issuing new rules or providing new interpretations of the exclusion that might, among other things, define the phrase “liens on and other interests in real estate” or consider sources of income in determining a company’s “primary business.” Any additional guidance from the SEC or its staff could provide additional flexibility to us, or it could further inhibit our ability to pursue the strategies we have chosen.
There can be no assurance that we and our subsidiaries will be able to successfully avoid registration as an investment company. If it were established that we were an unregistered investment company, there would be a risk that we would be subject to monetary penalties and injunctive relief in an action brought by the SEC, that we would be unable to enforce contracts with third parties, that third parties could seek to obtain rescission of transactions undertaken during the period it was established that we were an unregistered investment company, and that we would be subject to limitations on corporate leverage that would have an adverse impact on our investment returns.
If we were required to register as an investment company under the Investment Company Act, we would become subject to substantial regulation with respect to our capital structure (including our ability to use borrowings), management, operations, transactions with affiliated persons (as defined in the Investment Company Act) and portfolio composition, including disclosure requirements and restrictions with respect to diversification and industry concentration and other matters. Compliance with the Investment Company Act would, accordingly, limit our ability to make certain investments and require us to significantly restructure our business plan, which could materially adversely affect our ability to pay distributions to our stockholders.
Rapid changes in the values of our assets may make it more difficult for us to maintain our qualification as a REIT or our exclusion from the Investment Company Act.
If the market value or income potential of our assets declines, we may need to increase our real estate assets and income or liquidate our non-qualifying assets in order to maintain our REIT qualification or our exclusion from the Investment Company Act. If the decline in real estate asset values or income occurs quickly, this may be especially difficult to accomplish. This difficulty may be exacerbated by the illiquid nature of any assets we may own. We may have to make decisions that we otherwise would not make absent the REIT qualification and Investment Company Act considerations.
State licensing requirements cause us to incur expenses and our failure to be properly licensed may have a material adverse effect on us and our operations.
Nonbank companies are generally required to hold licenses in a number of U.S. states to conduct lending activities. State licensing statutes vary from state to state and may prescribe or impose various recordkeeping requirements; restrictions on loan origination and servicing practices, including limits on finance charges and the type, amount and manner of charging fees; disclosure requirements; requirements that licensees submit to periodic examination; surety bond and minimum specified net worth requirements; periodic financial reporting requirements; notification requirements for changes in principal officers, stock ownership or corporate control; and restrictions on advertising. Obtaining and maintaining licenses cause us to incur expenses and failure to be properly licensed under state law or otherwise may have a material adverse effect on us and our operations.
Changes in laws or regulations governing our operations, changes in the interpretation thereof or newly enacted laws or regulations (including laws and regulations having the effect of exempting REITs from the Investment Company Act) and any failure by us to comply with these laws or regulations, could require changes to certain of our business practices, negatively impact our operations, cash flow or financial condition, impose additional costs on us or otherwise adversely affect our business.
We are subject to regulation by laws and regulations at the local, state and federal levels. These laws and regulations, as well as their interpretation, may change from time to time and new laws and regulations may be enacted. Accordingly, any change in these laws or regulations, changes in their interpretation or newly enacted laws or regulations and any failure by us to comply with these laws or regulations could require changes to certain of our business practices, negatively impact our operations, cash flow or financial condition, impose additional costs on us or otherwise adversely affect our business. Furthermore, if regulatory capital requirements imposed on our financing providers change, they may be required to limit, or increase the cost of, financing they provide to us. In general, this could potentially increase our financing costs and reduce our liquidity or require us to sell assets at an inopportune time or price.
Operational risks, including the risk of cyberattacks, may disrupt our businesses, result in losses or limit our growth.
We rely heavily on our and our Manager’s financial, accounting, treasury, communications and other data processing systems. Such systems may fail to operate properly or become disabled as a result of tampering or a breach of the network security systems or otherwise. In addition, such systems are from time to time subject to cyberattacks, which may continue to increase in sophistication and frequency in the future. Attacks on us and our Manager’s and service providers’ systems could involve attempts that are intended to obtain unauthorized access to our proprietary information or personal identifying information of our stockholders, destroy data or disable, degrade or sabotage our systems, including through the introduction of computer viruses and other malicious code.
Cybersecurity incidents and cyber-attacks have been occurring globally at a more frequent and severe level and will likely continue to increase in frequency in the future. Our information and technology systems as well as those of our Manager and other related parties, such as service providers, may be vulnerable to damage or interruption from cyber security breaches, computer viruses or other malicious code, network failures, computer and telecommunication failures, infiltration by unauthorized persons and other security breaches, usage errors by their respective professionals or service providers, power, communications or other service outages and catastrophic events such as fires, tornadoes, floods, hurricanes and earthquakes. Cyberattacks and other security threats could originate from a wide variety of sources, including cyber criminals, nation state hackers, hacktivists and other outside parties. There has been an increase in the frequency and sophistication of the cyber and security threats we face, with attacks ranging from those common to businesses generally to those that are more advanced and persistent, which may target us or our Manager because we hold a significant amount of confidential and sensitive information. As a result, we and our Manager may face a heightened risk of a security breach or disruption with respect to this information. If successful, these types of attacks on our or Manager’s network or other systems could have a material adverse effect on our business and results of operations, due to, among other things, the loss of investor or proprietary data, interruptions or delays in the operation of our business and damage to our reputation. There can be no assurance that measures we or our Manager takes to ensure the integrity of our systems will provide protection, especially because cyberattack techniques used change frequently or are not recognized until successful.
If unauthorized parties gain access to such information and technology systems, they may be able to steal, publish, delete or modify private and sensitive information, including nonpublic personal information related to shareholders (and their beneficial owners) and material nonpublic information. Although we and our Manager have implemented, and our service providers may implement, various measures to manage risks relating to these types of events, such systems could prove to be inadequate and, if compromised, could become inoperable for extended periods of time, cease to function properly or fail to adequately secure private information. We do not control the cyber security plans and systems put in place by third party service providers, and such third party service providers may have limited indemnification obligations to us or our Manager, each of which could be negatively impacted as a result. Breaches such as those involving covertly introduced malware, impersonation of authorized users and industrial or other espionage may not be identified even with sophisticated prevention and detection systems, potentially resulting in further harm and preventing them from being addressed appropriately. The failure of these systems or of disaster recovery plans for any reason could cause significant interruptions in our or our Manager’s operations and result in a failure to maintain the security, confidentiality or privacy of sensitive data, including personal information relating to shareholders, material nonpublic information and the intellectual property and trade secrets and other sensitive information in the possession of us or our Manager. We or our Manager could be required to make a significant investment to remedy the effects of any such failures, harm to our reputations, legal claims that we and our Manager may be subjected to, regulatory action or enforcement arising out of applicable privacy and other laws, adverse publicity and other events that may affect our business and financial performance.
In addition, our business is highly dependent on information systems and technology. The costs related to cyber or other security threats or disruptions may not be fully insured or indemnified by other means. Many jurisdictions in which we operate have laws and regulations relating to data privacy, cybersecurity and protection of personal information Some jurisdictions have also enacted laws requiring companies to notify individuals of data security breaches involving certain types of personal data. Breaches in security could potentially jeopardize our or Manager’s, its employees’, or our investors’ or counterparties’ confidential and other information processed and stored in, and transmitted through, our or Manager’s computer systems and networks, or otherwise cause interruptions or malfunctions in our or Manager’s, its employees’, or our investors’, our counterparties’ or third parties’ operations, which could result in significant losses, increased costs, disruption of our business, liability to our investors and other counterparties, regulatory intervention or reputational damage. Furthermore, if we or our Manager fail to comply with the relevant laws and regulations, it could result in regulatory investigations and penalties, which could lead to negative publicity and may cause our investors to lose confidence in the effectiveness of our or our Manager’s security measures.
A disaster or a disruption in the infrastructure that supports our business, including a disruption involving electronic communications or other services used by us or third parties with whom we conduct business could have a material adverse impact on our ability to continue to operate our business without interruption. Our and our Manager’s disaster recovery programs may not be sufficient to mitigate the harm that may result from such a disaster or disruption. In addition, insurance and other safeguards might only partially reimburse us for our losses, if at all.
Accounting rules for certain of our transactions are highly complex and involve significant judgment and assumptions. Changes in accounting interpretations or assumptions could impact our ability to timely prepare consolidated financial statements.
Accounting rules for transfers of financial assets, securitization transactions, consolidation of variable interest entities, loan loss reserves and other aspects of our operations are highly complex and involve significant judgment and assumptions. These complexities could lead to a delay in preparation of financial information and the delivery of this information to our stockholders. Changes in accounting interpretations or assumptions could impact our consolidated financial statements and our ability to timely prepare our consolidated financial statements. Our inability to timely prepare our consolidated financial statements in the future would likely have a significant adverse effect on our stock price.
Risks Related to Our REIT Status and Certain Other Tax Items
If we do not maintain our qualification as a REIT, we will be subject to tax as a regular corporation and could face a substantial tax liability.
We intend to operate so as to qualify as a REIT under the Code. However, qualification as a REIT involves the application of highly technical and complex Code provisions for which only a limited number of judicial or administrative interpretations exist. Our qualification as a REIT depends on our continuing ability to meet various requirements concerning, among other things, the sources of our gross income, the composition and value of our assets, our distribution levels and the diversity of ownership of our shares. Notwithstanding the availability of cure provisions in the Code, we could fail various compliance requirements, which could jeopardize our REIT status. Furthermore, new tax legislation, administrative guidance or court decisions, in each instance potentially with retroactive effect, could make it more difficult or impossible for us to qualify as a REIT. If we fail to qualify as a REIT in any tax year, then:
| |
• | we would be taxed as a regular domestic corporation, which under current laws, among other things, means being unable to deduct distributions to stockholders in computing taxable income and being subject to federal income tax on our taxable income at regular corporate income tax rates; |
| |
• | any resulting tax liability could be substantial and could have a material adverse effect on our book value; |
| |
• | unless we were entitled to relief under applicable statutory provisions, we would be required to pay taxes, and thus, our cash available for distribution to stockholders would be reduced for each of the years during which we did not qualify as a REIT and for which we had taxable income; and |
| |
• | we generally would not be eligible to requalify as a REIT for the subsequent four full taxable years. |
A REIT, in certain circumstances, may incur tax liabilities that would reduce our cash available for distribution to you.
Even if we qualify and maintain our status as a REIT, we may become subject to U.S. federal income taxes and related state and local taxes. For example, gain from the sale of properties that are “dealer” properties sold by a REIT (a “prohibited transaction” under the Code) will be subject to a 100% tax. Also, we may not make sufficient distributions to avoid excise taxes applicable to REITs. Similarly, if we were to fail an income test (and did not lose our REIT status because such failure was due to reasonable cause and not willful neglect) we would be subject to tax on the income that does not meet the income test requirements. We also may decide to retain net capital gain we earn from the sale or other disposition of our investments and pay income tax directly on such income. In that event, our stockholders would be treated as if they earned that income and paid the tax on it directly. However, stockholders that are tax-exempt, such as charities or qualified pension plans, would have no benefit from their deemed payment of such tax liability unless they file U.S. federal income tax returns and seek a refund of such tax. We also may be subject to state and local taxes on our income or property, including franchise, payroll, mortgage recording and transfer taxes, either directly or at the level of the other companies through which we indirectly own our assets, such as our TRSs which are subject to full U.S. federal, state, local and foreign corporate-level income taxes. Any taxes we pay directly or indirectly reduce our cash available for distribution to you.
Complying with REIT requirements may cause us to forego otherwise attractive investment opportunities and limit our expansion opportunities.
In order to qualify as a REIT for U.S. federal income tax purposes, we must continually satisfy tests concerning, among other things, our sources of income, the nature of our investments in real estate and related assets, the amounts we distribute to our stockholders and the ownership of our stock. We may also be required to make distributions to stockholders at disadvantageous times, such as when we do not have funds readily available for distribution or when we would like to use funds for attractive investment and expansion opportunities. Thus, compliance with REIT requirements may hinder our ability to operate solely on the basis of maximizing profits.
Complying with REIT requirements may force us to liquidate or restructure otherwise attractive investments.
In order to qualify as a REIT, we must also ensure that at the end of each calendar quarter, at least 75% of the value of our assets consists of cash, cash items, government securities and real estate assets. The remainder of our investments in securities cannot include more than 10% of the outstanding voting securities of any one issuer or 10% of the total value of the outstanding securities of any one issuer unless we and such issuer jointly elect for such issuer to be treated as a TRS under the Code. The total value of all of our investments in TRSs cannot exceed 20%. In addition, no more than 5% of the value of our assets can consist of the securities of any one issuer other than a TRS or a disregarded entity, and no more than 25% of our assets can consist of debt of “publicly offered” REITs (i.e., REITs that are required to file annual and periodic reports with the SEC under the Exchange Act) that is not secured by real property or interests in real property. If we fail to comply with these requirements, we must dispose of a portion of our assets or otherwise come into compliance within 30 days after the end of the calendar quarter in order to avoid losing our REIT status and suffering adverse tax consequences.
Complying with REIT requirements may limit our ability to hedge effectively and may cause us to incur tax liabilities.
The REIT provisions of the Code substantially limit our ability to hedge our assets and liabilities. Any income from a hedging transaction we enter into to manage risk of interest rate or price changes with respect to borrowings made or to be made to acquire or carry real estate assets that is properly identified under applicable Treasury regulations, or to manage risk of currency fluctuations with respect to our REIT qualifying income, does not constitute “gross income” for purposes of the 75% or 95% gross income tests that we must satisfy in order to maintain our qualification as a REIT. To the extent that we enter into other types of hedging transactions, the income from those transactions is likely to be treated as non-qualifying income for purposes of both of the gross income tests. As a result of these rules, we intend to limit our use of advantageous hedging techniques or implement those hedges through a TRS. This could increase the cost of our hedging activities because our TRS may be subject to tax on gains or expose us to greater risks associated with changes in interest rates than we would otherwise want to bear.
Complying with REIT requirements may force us to borrow to make distributions to stockholders.
From time to time, our taxable income may be greater than our cash flow available for distribution to stockholders. If we do not have other funds available in these situations, we may be unable to distribute substantially all of our taxable income as required by the REIT provisions of the Code. Thus, we could be required to borrow funds, sell a portion of our assets at disadvantageous prices or find another alternative. These options could increase our costs or reduce the value of our equity.
Our charter provides that any individual (including certain entities treated as individuals for this purpose) is prohibited from owning more than 9.8% of our common stock or of our capital stock and attempts to acquire our common stock or any of our capital stock in excess of this 9.8% limit would not be effective without a prior exemption from those prohibitions by our board of directors.
For us to qualify as a REIT under the Code, not more than 50% of the value of our outstanding stock may be owned, directly or indirectly, by five or fewer individuals (including certain entities treated as individuals for this purpose) during the last half of a taxable year. For the purpose of preserving our qualification as a REIT for federal income tax purposes, among other purposes, our charter provides that beneficial or constructive ownership by any individual (including certain entities treated as individuals for this purpose) of more than a certain percentage, currently 9.8%, by value or number of shares, whichever is more restrictive, of the outstanding shares of our common stock or 9.8% by value of our capital stock is prohibited, which we refer to as the “ownership limits.” The constructive ownership rules under the Code and our charter are complex and may cause shares of our outstanding common stock owned by a group of related individuals or entities to be deemed to be constructively owned by one individual. As a result, the acquisition of less than 9.8% of our outstanding common stock or our capital stock by an individual or entity could cause an individual to own constructively in excess of 9.8% of our outstanding common stock or our capital stock, respectively, and thus violate the ownership limit. Our board adopted a resolution providing for the exemption of Two Harbors and certain of its affiliates from the ownership limits, which allows them to own in the aggregate up to 85% of our stock. However, there can be no assurance that our board of directors, as permitted in our charter, will increase, or will not decrease, these ownership limits in the future. Our charter provides that any attempt to own or transfer shares of our common stock or capital stock in excess of the ownership limits without the consent of our board of directors either will result in the shares being transferred by operation of the charter to a charitable trust, and the person who attempted to acquire such excess shares will not have any rights in such excess shares, or in the transfer being void.
The ownership limits may have the effect of precluding a change in control of us by a third party, even if such change in control would be in the best interests of our stockholders or would result in receipt of a premium to the price of our common stock (and even if such change in control would not reasonably jeopardize our REIT status). Any exemptions to the ownership limits that are granted by our board of directors may limit our board of directors’ ability to grant further exemptions at a later date.
We may choose to make distributions in our own stock, in which case you may be required to pay income taxes without receiving any cash dividends.
In connection with our qualification as a REIT, we are required to annually distribute to our stockholders at least 90% of our REIT taxable income (which does not equal net income, as calculated in accordance with U.S. GAAP), determined without regard to the deduction for dividends paid and excluding net capital gain. In order to satisfy this requirement, we may make distributions that are payable in cash and/or shares of our common stock (which could account for up to 90% of the aggregate amount of such distributions) at the election of each stockholder. Taxable stockholders receiving such distributions will be required to include the full amount of such distributions as ordinary dividend income to the extent of our current or accumulated earnings and profits, as determined for U.S. federal income tax purposes. As a result, U.S. stockholders may be required to pay income taxes with respect to such distributions in excess of the cash portion of the distribution received. Accordingly, U.S. stockholders receiving a distribution of our shares may be required to sell shares received in such distribution or may be required to sell other stock or assets owned by them, at a time that may be disadvantageous, in order to satisfy any tax imposed on such distribution. If a U.S. stockholder sells the stock that it receives as part of the distribution in order to pay this tax, the sales proceeds may be less than the amount it must include in income with respect to the distribution, depending on the market price of our stock at the time of the sale. Furthermore, with respect to certain non-U.S. stockholders, we may be required to withhold U.S. tax with respect to such distribution, including in respect of all or a portion of such distribution that is payable in stock, by withholding or disposing of part of the shares included in such distribution and using the proceeds of such disposition to satisfy the withholding tax imposed. In addition, if a significant number of our stockholders determine to sell shares of our common stock in order to pay taxes owed on dividend income, such sale may put downward pressure on the market price of our common stock.
Dividends payable by REITs do not qualify for the reduced tax rates available for some dividends.
The maximum U.S. federal income tax rate for qualified dividends payable to domestic stockholders that are individuals, trusts and estates is 20%. Dividends payable by REITs, however, are generally not eligible for these reduced rates. Although the reduced U.S. federal income tax rate applicable to dividend income from regular corporate dividends does not adversely affect the taxation of REITs or dividends paid by REITs, the more favorable rates applicable to regular corporate dividends could cause investors who are individuals, trusts and estates to perceive investments in REITs to be relatively less attractive than investments in the stocks of non-REIT corporations that pay dividends, which could adversely affect the value of the shares of REITs, including our shares of common stock.
The Tax Cuts and Jobs Act of 2017 (“TCJA”) made many significant changes to the U.S. federal income tax laws applicable to businesses and their owners, including REITs and their stockholders. Pursuant to the TCJA, as of January 1, 2018, the highest marginal individual income tax rate is reduced to 37%. In addition, individuals, estates and trusts may deduct up to 20% of certain pass-through income, including ordinary REIT dividends that are not “capital gain dividends” or “qualified dividend income,” subject to complex limitations. For taxpayers qualifying for the full deduction, the effective maximum tax rate on ordinary REIT dividends would be 29.6% (through taxable years ending in 2025). The maximum rate of withholding with respect to our distributions to non-U.S. stockholders that are treated as attributable to gains from the sale or exchange of U.S. real property interests is also reduced from 35% to 21%. There can be no assurance as to how these or any other tax rate changes in the future will impact the attractiveness of an investment in our shares or the value of our securities.
We are dependent on external sources of capital to finance our growth.
As with other REITs, but unlike corporations generally, our ability to finance our growth must largely be funded by external sources of capital because we generally have to distribute to our stockholders 90% of our taxable income in order to qualify as a REIT. Our access to external capital depends upon a number of factors, including general market conditions, the market’s perception of our growth potential, our current and potential future earnings, cash distributions and the market price of our common stock.
We may be subject to adverse legislative or regulatory tax changes that could increase our tax liability, reduce our operating flexibility and reduce the price of our common stock.
At any time, the U.S. federal income tax laws or regulations governing REITs or the administrative interpretations of those laws or regulations may be changed. We cannot predict if or when any new U.S. federal income tax law, regulation or administrative interpretation, or any amendment to any existing U.S. federal income tax law, regulation or administrative interpretation, will be adopted, promulgated or become effective or whether any such law, regulation or interpretation may take effect retroactively. We and our stockholders could be adversely affected by any such change in, or any new, U.S. federal income tax law, regulation or administrative interpretation.
The TCJA made many significant changes to the U.S. federal income tax laws applicable to businesses and their owners, including REITs and their stockholders. Technical corrections or other amendments to the TCJA or administrative guidance interpreting the TCJA may be forthcoming at any time. While we do not anticipate a material effect on our operations, we continue to analyze and monitor the application of the TCJA to our businesses, our competitors and the economic environment.
We may recognize “phantom income” in respect of our investments.
Our taxable income may substantially exceed our net income as determined based on U.S. GAAP, or differences in timing between the recognition of taxable income and the actual receipt of cash may occur. For example, we may acquire assets, including debt securities requiring us to accrue original issue discount, or OID, or recognize market discount income, that generate taxable income in excess of economic income or in advance of the corresponding cash flow from the assets, which is referred to as “phantom income.” In addition, if a borrower with respect to a particular debt instrument encounters financial difficulty rendering it unable to pay stated interest as due, we may nonetheless be required to continue to recognize the unpaid interest as taxable income, with the effect that we will recognize income but will not have a corresponding amount of cash available for distribution to our stockholders. Finally, we may be required under the terms of indebtedness that we incur to use cash received from interest payments to make principal payments on that indebtedness, with the effect of recognizing income but not having a corresponding amount of cash available for distribution to our stockholders.
As a result of the foregoing, we may generate less cash flow than taxable income in a particular year and find it difficult or impossible to meet the REIT distribution requirements in certain circumstances. In such circumstances, we may be required to (a) sell assets in adverse market conditions, (b) borrow on unfavorable terms, (c) distribute amounts that would otherwise be used for future acquisitions or used to repay debt, or (d) make a taxable distribution of our shares of common stock as part of a distribution in which stockholders may elect to receive shares of our common stock or (subject to a limit measured as a percentage of the total distribution) cash, in order to comply with the REIT distribution requirements.
Moreover, we may acquire distressed loans or other debt investments that require subsequent modification by agreement with the borrower. If the amendments to the outstanding debt are “significant modifications” under applicable Treasury regulations, the modified debt may be considered to have been reissued to us in a debt-for-debt taxable exchange with the borrower. In certain circumstances, this deemed reissuance may prevent the modified debt from qualifying as a good REIT asset if the underlying security has declined in value and could cause us to recognize income to the extent the principal amount of the modified debt exceeds our adjusted tax basis in the unmodified debt.
The “taxable mortgage pool” rules may increase the taxes that we or our stockholders may incur, and may limit the manner in which we effect future securitizations.
We may enter into securitizations and other financing transactions that could result in the creation of taxable mortgage pools for U.S. federal income tax purposes. As a REIT, so long as we own 100% of the equity interests in a taxable mortgage pool, we generally would not be adversely affected by the characterization of a financing transaction as a taxable mortgage pool. Certain categories of stockholders, however, such as foreign stockholders eligible for treaty or other benefits, stockholders with net operating losses, and certain tax-exempt stockholders that are subject to unrelated business income tax, could be subject to increased taxes on a portion of their dividend income from us that is attributable to a taxable mortgage pool. In addition, to the extent that our stock is owned by tax-exempt “disqualified organizations,” such as certain government-related entities and charitable remainder trusts that are not subject to tax on unrelated business income, we may incur a corporate level tax on a portion of our income from a taxable mortgage pool. In that case, we may reduce the amount of our distributions to any disqualified organization whose stock ownership gave rise to the tax. Moreover, we would be precluded from selling equity interests in these securitizations to outside investors, or selling any debt securities issued in connection with these securitizations that might be considered to be equity interests for tax purposes. These limitations may prevent us from using certain techniques to maximize our returns from securitization transactions.
The failure of a mezzanine loan to qualify as a real estate asset could adversely affect our ability to qualify as a REIT.
We may originate or acquire mezzanine loans, for which the IRS has provided a safe harbor but not rules of substantive law. Pursuant to the safe harbor, if a mezzanine loan meets certain requirements, it will be treated by the IRS as a real estate asset for purposes of the REIT asset tests, and interest derived from the mezzanine loan will be treated as qualifying mortgage interest for purposes of the REIT 75% income test. Our mezzanine loans may not meet all of the requirements of this safe harbor. In the event we own a mezzanine loan that does not meet the safe harbor, the IRS could challenge such loan’s treatment as a real estate asset for purposes of the REIT asset and income tests and, if such a challenge were sustained, we could fail to qualify as a REIT.
We may fail to qualify as a REIT if the IRS successfully challenges the treatment of our mezzanine loans as debt for U.S. federal income tax purposes or successfully challenges the treatment of our preferred equity investments as equity for U.S. federal income tax purposes.
There is limited case law and administrative guidance addressing whether instruments such as mezzanine loans and preferred equity investments will be treated as equity or debt for U.S. federal income tax purposes. We expect that our mezzanine loans generally will be treated as debt for U.S. federal income tax purposes, and our preferred equity investments generally will be treated as equity for U.S. federal income tax purposes, but we typically do not anticipate obtaining private letter rulings from the IRS or opinions of counsel on the characterization of those investments for U.S. federal income tax purposes. If a mezzanine loan is treated as equity for U.S. federal income tax purposes, we would be treated as owning the assets held by the partnership that issued the mezzanine loan and we would be treated as receiving our proportionate share of the income of that entity. If that partnership owned non-qualifying assets or earned non-qualifying income, we may not be able to satisfy all of the REIT income or asset tests. Alternatively, if the IRS successfully asserts a preferred equity investment is debt for U.S. federal income tax purposes, then that investment may be treated as a non-qualifying asset for purposes of the 75% asset test and as producing non-qualifying income for 75% gross income test. In addition, such an investment may be subject to the 10% value test and the 5% asset test, and it is possible that a preferred equity investment that is treated as debt for U.S. federal income tax purposes could cause us to fail one or more of the foregoing tests. Accordingly, we could fail to qualify as a REIT if the IRS does not respect our classification of our mezzanine loans or preferred equity for U.S. federal income tax purposes unless we are able to qualify for a statutory REIT “savings” provision, which may require us to pay a significant penalty tax to maintain our REIT qualification.
The tax on prohibited transactions limits our ability to engage in transactions, including certain methods of securitizing or syndicating loans that would be treated as sales for U.S. federal income tax purposes.
A REIT’s net income from prohibited transactions is subject to a 100% tax with no offset for losses. In general, prohibited transactions are sales or other dispositions of property, other than foreclosure property, but including loans, held primarily for sale to customers in the ordinary course of business. We might be subject to this tax if we dispose of, securitize or syndicate loans in a manner that was treated as a sale of the loans, or if we frequently buy and sell securities in a manner that is treated as dealer activity with respect to such securities for U.S. federal income tax purposes. Therefore, in order to avoid the prohibited transactions tax, we may choose to engage in certain sales of loans through a TRS and not at the REIT level, and may limit the structures we utilize for our securitization transactions, even though direct sales by us or those structures might otherwise be beneficial to us.
The failure of assets subject to repurchase agreements to qualify as real estate assets could adversely affect our ability to qualify as a REIT.
We have entered into financing arrangements that are structured as sale and repurchase agreements pursuant to which we nominally sell certain of our assets to a counterparty and simultaneously enter into an agreement to repurchase these assets at a later date in exchange for a purchase price. Economically, these agreements are borrowings which are secured by the assets sold pursuant thereto. We believe that we will be treated for REIT asset and income test purposes as the owner of the assets that are the subject of any such sale and repurchase agreement, notwithstanding that such agreements may transfer record ownership of the assets to the counterparty during the term of the agreement. It is possible, however, that the IRS could assert that we did not own the assets during the term of the sale and repurchase agreement, in which case we could fail to qualify as a REIT.
Liquidation of assets may jeopardize our REIT qualification.
To qualify as a REIT, we must comply with requirements regarding our assets and our sources of income. If we are compelled to liquidate our investments to repay obligations to our lenders, we may be unable to comply with these requirements, ultimately jeopardizing our qualification as a REIT, or we may be subject to a 100% tax on any resultant gain if we sell assets that are treated as dealer property or inventory.
Our ownership of, and relationship with, our TRSs will be restricted and a failure to comply with the restrictions would jeopardize our REIT status and may result in the application of a 100% excise tax.
A REIT may own up to 100% of the stock of one or more TRSs. A TRS may earn income that would not be qualifying REIT income if earned directly by the parent REIT. Both the subsidiary and the REIT must jointly elect to treat the subsidiary as a TRS. A corporation of which a TRS directly or indirectly owns more than 35% of the voting power or value of the stock will automatically be treated as a TRS. Overall, no more than 20% of the value of a REIT’s assets may consist of stock or securities of one or more TRSs. The value of our interests in and thus the amount of assets held in a TRS may also be restricted by our need to qualify for an exclusion from regulation as an investment company under the Investment Company Act.
Any domestic TRS we own pay U.S. federal, state and local income tax at regular corporate rates on any income that it earns. In addition, the TRS rules limit the deductibility of interest paid or accrued by a TRS to its parent REIT to assure that the TRS is subject to an appropriate level of corporate taxation. The rules also impose a 100% excise tax on certain transactions between a TRS and its parent REIT that are not conducted on an arm’s-length basis.
We expect that the aggregate value of all TRS stock and securities owned by us should be less than 20% of the value of our total assets. Although we monitor our investments in and transactions with TRSs, there can be no assurance that we will be able to comply with the limitation on the value of our TRSs discussed above or to avoid application of the 100% excise tax discussed above.
Our qualification as a REIT may be dependent on the accuracy of legal opinions or advice rendered or given or statements by the issuers of assets that we acquire and the inaccuracy of any such opinions, advice or statements may adversely affect our REIT qualification and result in significant corporate-level tax.
When purchasing securities, we may rely on opinions or advice of counsel for the issuer of such securities, or statements made in related offering documents, for purposes of determining whether such securities represent debt or equity securities for U.S. federal income tax purposes, the value of such securities and also to what extent those securities constitute qualified real estate assets for purposes of the REIT asset tests and produce income that qualifies under the 75% gross income test. The inaccuracy of any such opinions, advice or statements may adversely affect our ability to qualify as a REIT and result in significant corporate-level tax.
We may realize excess inclusion income that would increase our tax liability and that of our stockholders.
“Excess inclusion income” is subject to taxation in all events. While we do not currently realize or distribute excess inclusion income to our shareholders, it is possible that we may do so in the future. In the event we do realize or distribute excess inclusion income, we do not expect the amount of any such excess inclusion income to be substantial.
Excess inclusion income arises from holding the REMIC residual interests or the equity interest in certain securitization structures. It could arise, for example, if we issued debt obligations with two or more maturities and the terms of the payments on these obligations bore a relationship to the payments received on mortgage loans or mortgage-backed securities pledged to secure those debt obligations, i.e., if we were to own an equity interest in a “taxable mortgage pool”. We could also have excess inclusion income if we hold a residual interest in a REMIC. While we do not now own such equity interests or residual interests or expect to acquire significant amounts of residual interests in REMICs or taxable mortgage pools, it is possible that we may do so in the future. Doing so would cause us to be treated as having excess inclusion income, although we do not anticipate that the amount of any such excess inclusion income would be substantial.
The Code and IRS guidance indicates that excess inclusion income distributed by a REIT to its shareholders with respect to a taxable year will be allocated among them in proportion to the dividends they receive. A shareholder’s share of excess inclusion income (i) would be the minimum taxable income of U.S. shareholders (that is, would not be allowed to be offset by any net operating losses or any other deduction otherwise available), (ii) would be unrelated business taxable income in the hands of most generally tax-exempt shareholders, and (iii) would result in the application of U.S. federal income tax withholding at the maximum rate of 30%, without reduction for any otherwise applicable income tax treaty, to the extent allocable to foreign shareholders.
Despite being generally not subject to corporate level tax, we as a REIT will be taxed at the corporate income tax rate on the portion of any excess inclusion income that is allocable to the percentage of our stock held in record name by "disqualified organizations", which are entities that are generally not subject to the unrelated business income tax, such as governmental entities. We expect that disqualified organizations will own our stock. If a disqualified organization is the record owner of our stock and a tax on excess inclusion income is therefore imposed on us, all of our investors (including investors that are not disqualified organizations) will bear a portion of such tax. To the extent that our stock owned by "disqualified organizations" is held in record name by a broker-dealer or other nominee, the broker-dealer or other nominee would be liable for the corporate level tax on the portion of our excess inclusion income allocable to the stock held by the broker-dealer or other nominee on behalf of "disqualified organizations." Similarly, a regulated investment company, partnership or other pass through entity owning stock in record name will be subject to tax at the corporate rate on any excess inclusion income allocated to its owners that are disqualified organizations.
Risks Related to Ownership of Our Common Stock
The market price of our common stock may fluctuate significantly.
The market price and liquidity of the market for shares of our common stock may be significantly affected by numerous factors, some of which are beyond our control and may not be directly related to our operating performance.
Some of the factors that could negatively affect the market price of our common stock include:
| |
• | our actual or projected operating results, financial condition, cash flows and liquidity or changes in business strategy or prospects; |
| |
• | actual or perceived conflicts of interest with our Manager and our executive officers; |
| |
• | equity issuances by us, share resales by our stockholders or the perception that such issuances or resales may occur; |
| |
• | loss of a major funding source; |
| |
• | actual or anticipated accounting problems; |
| |
• | publication of research reports about us or the real estate industry; |
| |
• | changes in market valuations of similar companies; |
| |
• | adverse market reaction to any increased indebtedness we incur in the future; |
| |
• | additions to or departures of our Manager’s or our managements’ key personnel; |
| |
• | speculation in the press or investment community; |
| |
• | increases in market interest rates, which may lead investors to demand a higher distribution yield for our common stock, and would result in increased interest expenses on our debt; |
| |
• | failure to maintain our REIT qualification or exclusion from the Investment Company Act; |
| |
• | price and volume fluctuations from time to time due to a variety of factors; |
| |
• | general market and economic conditions and trends including inflationary concerns, the current state of the credit and capital markets; |
| |
• | significant volatility in the market price and trading volume of securities of publicly traded REITs or other companies in our sector which are not necessarily related to the operating performance of these companies; |
| |
• | changes in law, regulatory policies or tax guidelines, or interpretations thereof, particularly with respect to REITs; |
| |
• | changes in the value of our portfolio; |
| |
• | any shortfall in revenue or net income or any increase in losses from levels expected by investors or securities analysts; |
| |
• | operating performance of companies comparable to us; |
| |
• | short-selling pressure with respect to shares of our common stock or REITs generally; and |
| |
• | the strength of the commercial real estate market and the U.S. economy generally. |
As noted above, market factors unrelated to our performance could also negatively impact the market price of our common stock. One of the factors that investors may consider in deciding whether to buy or sell our common stock is our distribution rate as a percentage of our stock price relative to market interest rates. If market interest rates increase, prospective investors may demand a higher distribution rate or seek alternative investments paying higher dividends or interest. As a result, interest rate fluctuations and conditions in the capital markets can affect the market value of our common stock. For instance, if interest rates rise, it is likely that the market price of our common stock will decrease as market rates on interest-bearing securities increase.
Future issuances of equity or debt securities, which may include securities that would rank senior to our common stock, may adversely affect the market price of the shares of our common stock.
The issuance of additional shares of our common stock, including in connection with the conversion of our outstanding 5.625% convertible senior notes due 2022 and/or our outstanding 6.375% convertible senior notes due 2023, through the equity distribution agreement we entered into pursuant to which we may sell, from time to time, up to an aggregate of 8,000,000 share of our common stock or in connection with other future issuances of our common stock or shares of preferred stock or securities convertible or exchangeable into equity securities, may dilute the ownership interest of our existing holders of our common stock. If we decide to issue debt or equity securities which would rank senior to our common stock, it is likely that they will be governed by an indenture or other instrument containing covenants restricting our operating flexibility. Additionally, any convertible or exchangeable securities that we issue may have rights, preferences and privileges more favorable than those of our common stock and may result in dilution to owners of our common stock. We and, indirectly, our stockholders will bear the cost of issuing and servicing such securities. Because our decision to issue additional equity or debt securities in any future offering will depend on market conditions and other factors beyond our control, we cannot predict or estimate the amount, timing or nature of our future issuances. Also, we cannot predict the effect, if any, of future sales of our common stock, or the availability of shares for future sales, on the market price of our common stock. Sales of substantial amounts of common stock or the perception that such sales could occur may adversely affect the prevailing market price for the shares of our common stock. Therefore holders of our common stock will bear the risk of our future issuances reducing the market price of our common stock and diluting the value of their stock holdings in us.
We have not established a minimum distribution payment level and we may be unable to generate sufficient cash flows from our operations to make, and restrictions related to our financing facilities may limit, distributions to our stockholders at any time in the future.
We are generally required to annually distribute to our stockholders at least 90% of our REIT taxable income (which may not equal net income, as calculated in accordance with U.S. GAAP), determined without regard to the deduction for dividends paid and excluding net capital gains, for us to qualify as a REIT, which requirement we currently intend to satisfy through quarterly distributions of all or substantially all of our REIT taxable income in such year, subject to certain adjustments. We have not established a minimum distribution payment level and our ability to pay distributions may be adversely affected by a number of factors, including the risk factors described in this Annual Report on Form 10-K. All distributions will be made at the discretion of our board of directors and will depend on our earnings, our financial condition, debt covenants, maintenance of our REIT qualification and other factors as our board of directors may deem relevant from time to time. We believe that a change in any one of the following factors could adversely affect our results of operations and impair our ability to pay distributions to our stockholders:
| |
• | our ability to make profitable investments; |
| |
• | margin calls or other expenses that reduce our cash flow; |
| |
• | defaults in our asset portfolio or decreases in the value of our portfolio; and |
| |
• | the fact that anticipated operating expense levels may not prove accurate, as actual results may vary from estimates. |
As a result, no assurance can be given that we will be able to make distributions to our stockholders at any time in the future or that the level of any distributions we do make to our stockholders will achieve a market yield or increase or even be maintained over time, any of which could materially and adversely affect us.
Distributions that we make to our stockholders out of current or accumulated earnings and profits (as determined for U.S. federal income tax purposes) and not designated by us as capital gain dividends, generally will be taxable to our stockholders as ordinary income. However, a portion of our distributions may be designated by us as capital gain dividends and generally will be taxed to our stockholders as long-term capital gain to the extent that such distributions do not exceed our actual net capital gain for the taxable year, without regard to the period for which the stockholder that receives such distribution has held its stock. Distributions in excess of our current and accumulated earnings and profits, as determined for U.S. federal income tax purposes, and not designated by us as capital gain dividends, may constitute a return of capital. A return of capital is not taxable, but has the effect of reducing the basis of a stockholder’s investment in our common stock, but not below zero.
Our financing facilities and the related guarantees contain, and additional lending facilities may contain, customary affirmative and negative covenants, including financial covenants (e.g., liquidity and net worth covenants), and other customary provisions that may restrict our ability to pay dividends.
Provisions of our charter and bylaws and Maryland law may deter takeover attempts, which may limit the opportunity of our stockholders to sell their shares at a favorable price.
Some of the provisions of Maryland law and our charter and bylaws discussed below could make it more difficult for a third party to acquire us, even if doing so might be beneficial to our stockholders by providing them with the opportunity to sell their shares at a premium to the then current market price.
Issuance of stock without stockholder approval. Our charter authorizes our board of directors, without stockholder approval, to authorize the issuance of up to 450,000,000 shares of common stock and up to 50,000,000 shares of preferred stock. Our charter also authorizes our board of directors, without stockholder approval, to classify or reclassify any unissued shares of common stock and preferred stock into other classes or series of stock and to amend our charter to increase or decrease the aggregate number of shares of stock or the number of shares of stock of any class or series that are authorized by the charter to be issued. Preferred stock may be issued in one or more classes or series, the terms of which may be determined by our board of directors without further action by stockholders. Prior to issuance of any such class or series, our board of directors will set the terms of any such class or series, including the preferences, conversion or other rights, voting powers, restrictions, limitations as to dividends or other distributions, qualifications and terms and conditions of redemption. The issuance of any preferred stock could materially adversely affect the rights of holders of common stock and, therefore, could reduce the value of the common stock. In addition, specific rights granted to future holders of our preferred stock could be used to restrict our ability to merge with, or sell assets to, a third party. The power of our board of directors to cause us to issue preferred stock could, in certain circumstances, make it more difficult, delay, discourage, prevent or make it more costly to acquire or effect a change in control, thereby preserving the current stockholders’ control.
Advance notice bylaw. Our bylaws contain advance notice procedures for the introduction by a stockholder of new business and the nomination of directors by a stockholder. These provisions could, in certain circumstances, discourage proxy contests and make it more difficult for you and other stockholders to elect stockholder-nominated directors and to propose and, consequently, approve stockholder proposals opposed by management.
Maryland takeover statutes. The Maryland Business Combination Act, in certain circumstances, could delay or prevent an unsolicited takeover of us. The statute substantially restricts the power of third parties who acquire, or seek to acquire, control of us without the approval of our board of directors to complete mergers and other business combinations even if such transaction would be beneficial to stockholders. “Business combinations” between such a third-party acquirer or its affiliate and us are prohibited for five years after the most recent date on which the acquirer becomes an “interested stockholder.” An “interested stockholder” is defined as any person who beneficially owns 10% or more of the voting power of our outstanding voting stock or an affiliate or associate of ours who, at any time within the two-year period immediately prior to the date in question, was the beneficial owner of 10% or more of the voting power of our then outstanding stock. If our board of directors approved in advance the transaction that would otherwise give rise to the acquirer attaining such status, the acquirer would not become an interested stockholder and, as a result, it could enter into a business combination with us. Our board of directors may, however, provide that its approval is subject to compliance, at or after the time of approval, with any terms and conditions determined by it. Even after the lapse of the five-year prohibition period, any business combination with an interested stockholder must be recommended by our board of directors and approved by the affirmative vote of at least:
| |
• | 80% of the votes entitled to be cast by stockholders; and |
| |
• | two-thirds of the votes entitled to be cast by stockholders other than the interested stockholder and affiliates and associates thereof. |
The super-majority vote requirements do not apply if, among other considerations, the transaction complies with a minimum price and form of consideration requirements prescribed by the statute. The statute permits various exemptions from its provisions, including business combinations that are exempted by the board of directors prior to the time that an interested stockholder becomes an interested stockholder. As permitted by the MGCL, our board of directors by resolution exempt business combinations (i) between us and any person not then already an interested stockholder, provided that the business combination is first approved by our board of directors (including a majority of directors who are not affiliates or associates of such persons) and (ii) between us and our Manager or any of its affiliates. Consequently, the five-year prohibition and the super-majority vote requirements do not apply to business combinations between us and any other person as described above, and as a result, any such person may be able to enter into business combinations with us that may not be in the best interest of our stockholders, without compliance with the super-majority vote requirements and the other provisions of the statute.
The Maryland Control Share Acquisition Act provides that a holder of control shares of a Maryland corporation acquired in a control share acquisition has no voting rights with respect to the control shares except to the extent approved by a vote of two-thirds of the votes entitled to be cast on the matter. Shares owned by the acquiror, by officers or by employees who are directors of the corporation are excluded from shares entitled to vote on the matter. Control shares are voting shares of stock that, if aggregated with all other shares of stock owned by the acquiror or in respect of which the acquiror is able to exercise or direct the exercise of voting power (except solely by virtue of a revocable proxy), would entitle the acquiror to exercise voting power in electing directors within one of the following ranges of voting power:
| |
• | one-tenth or more but less than one-third; |
| |
• | one-third or more but less than a majority; or |
| |
• | a majority or more of all voting power. |
Control shares do not include shares the acquiror is then entitled to vote as a result of having previously obtained stockholder approval or shares acquired directly from the corporation. A control share acquisition means the acquisition of issued and outstanding control shares, subject to certain exceptions.
A person who has made or proposes to make a control share acquisition may compel the board of directors of the corporation to call a special meeting of stockholders to be held within 50 days of demand to consider the voting rights of the shares. The right to compel the calling of a special meeting is subject to the satisfaction of certain conditions, including an undertaking to pay the expenses of the meeting. If no request for a meeting is made, the corporation may itself present the question at any stockholders meeting.
If voting rights are not approved at the meeting or if the acquiror does not deliver an acquiring person statement as required by the statute, then the corporation may, subject to certain limitations and conditions, redeem for fair value any or all of the control shares, except those for which voting rights have previously been approved. Fair value is determined, without regard to the absence of voting rights for the control shares, as of the date of any meeting of stockholders at which the voting rights of the shares are considered and not approved or, if no meeting is held, as of the date of the last control share acquisition by the acquiror. If voting rights for control shares are approved at a stockholders meeting and the acquiror becomes entitled to exercise or direct the exercise of a majority of the voting power, all other stockholders may exercise appraisal rights. The fair value of the shares as determined for purposes of appraisal rights may not be less than the highest price per share paid by the acquiror in the control share acquisition.
The control share acquisition statute does not apply to (a) shares acquired in a merger, consolidation or share exchange if the corporation is a party to the transaction or (b) acquisitions approved or exempted by the charter or bylaws of the corporation.
Our bylaws contain a provision exempting any acquisition of our stock by any person from the foregoing provisions on control shares, which may be amended by our board of directors. In the event that our bylaws are amended to modify or eliminate this provision, acquisitions of our common stock may constitute a control share acquisition.
Subtitle 8 of Title 3 of the MGCL, which is commonly referred to as the Maryland Unsolicited Takeovers Act, or MUTA, permits the board of directors of a Maryland corporation with at least three independent directors and a class of stock registered under the Exchange Act, without stockholder approval and notwithstanding any contrary provision in its charter or bylaws, to implement certain takeover defenses, including adopting a classified board, increasing the vote required to remove a director or providing that each vacancy on the board of directors may be filled only by a majority of the remaining directors in office, even if the remaining directors do not constitute a quorum. These provisions could have the effect of limiting or precluding a third party from making an unsolicited acquisition proposal for our company or of delaying, deferring or preventing a change in control under circumstances that otherwise could provide the holders of shares of our common stock with the opportunity to realize a premium over the then current market price. Our charter contains a provision whereby we have elected to be subject to the provisions of MUTA relating to the filling of vacancies on our board of directors.
In addition, our charter includes certain limitations on the ownership and transfer of our capital stock. See “—Risks Related to Our REIT Status and Certain Other Tax Items—Our charter provides that any individual (including certain entities treated as individuals for this purpose) is prohibited from owning more than 9.8% of our common stock or of our capital stock, and attempts to acquire our common stock or any of our capital stock in excess of this 9.8% limit would not be effective without a prior exemption from those prohibitions by our board of directors.”
Our rights and the rights of our stockholders to take action against our directors and officers are limited, which could limit your recourse in the event of actions not in your best interests.
Our charter limits the liability of our present and former directors and officers to us and our stockholders for money damages to the maximum extent permitted by Maryland law. Under Maryland law, our present and former directors and officers will not have any liability to us and our stockholders for money damages other than liability resulting from:
| |
• | actual receipt of an improper benefit or profit in money, property or services; or |
| |
• | active and deliberate dishonesty by the director or officer that was established by a final judgment as being material to the cause of action adjudicated. |
Our charter provides that we have the power to indemnify our present and former directors and officers for actions taken by them in those capacities to the maximum extent permitted by Maryland law. Our bylaws require us to indemnify each present and former director or officer, to the maximum extent permitted by Maryland law, in the defense of any proceeding to which he or she is made, or threatened to be made, a party by reason of his or her service to us. In addition, we may be obligated to pay or reimburse the defense costs incurred by our present and former directors and officers without requiring a preliminary determination of their ultimate entitlement to indemnification.
Our charter contains provisions that make removal of our directors difficult, which could make it difficult for our stockholders to effect changes to our management.
Our charter provides that, subject to the rights of any series of preferred stock, a director may be removed upon the affirmative vote of at least two-thirds of the votes entitled to be cast generally in the election of directors. Vacancies may be filled only by a majority of the remaining directors in office, even if less than a quorum. These requirements make it more difficult to change our management by removing and replacing directors and may prevent a change in control of our company that is in the best interests of our stockholders.
Our amended and restated bylaws designate certain Maryland courts as the sole and exclusive forum for certain types of actions and proceedings that may be initiated by our stockholders, which could limit our stockholders’ ability to obtain a favorable judicial forum for disputes with us or our directors, officers or employees.
Our bylaws provide that, unless we consent in writing to the selection of an alternative forum, the Circuit Court for Baltimore City, Maryland, or, if that Court does not have jurisdiction, the United States District Court for the District of Maryland, Baltimore Division, shall be the sole and exclusive forum for the following: any derivative action or proceeding brought on behalf of the corporation; any action asserting a claim of breach of any duty owed by any of our present or former directors, officers or other employees or our stockholders to the corporation or to our stockholders or any standard of conduct applicable to our directors; any action asserting a claim against the corporation or any of our present or former directors, officers or other employees arising pursuant to any provision of the MGCL or our charter or bylaws; or any action asserting a claim against the corporation or any of our present or former directors, officers or other employees that is governed by the internal affairs doctrine. This choice of forum provision may limit a stockholder’s ability to bring a claim in a judicial forum that the stockholder believes is favorable for disputes with us or our directors, officers or other employees, which may discourage lawsuits against us and our directors, officers and employees. Alternatively, if a court were to find these provisions of our bylaws inapplicable to, or unenforceable in respect of, one or more of the specified types of actions or proceedings, we may incur additional costs associated with resolving such matters in other jurisdictions, which could adversely affect our business, financial condition or results of operations.
Item 1B. Unresolved Staff Comments
None.
Item 2. Properties
Our principal place of business is located at 590 Madison Avenue, 38th Floor, New York, New York 10022. We rely on the facilities and resources of our Manager and its affiliates to manage our day-to-day operations.
Item 3. Legal Proceedings
From time to time we may be involved in various legal claims and/or administrative proceedings that arise in the ordinary course of our business. As of the date of this filing, we are not party to any litigation or legal proceedings or, to the best of our knowledge, any threatened litigation or legal proceedings, which, in our opinion, individually or in the aggregate, would have a material adverse effect on our results of operations or financial condition.
Item 4. Mine Safety Disclosures
None.
PART II
Item 5. Market for Registrant’s Common Equity, Related Stockholder Matters, and Issuer Purchases of Equity Securities
Market Information
Prior to our formation on June 28, 2017, there had been no public trading market for our common stock. Following June 28, 2017, our common stock has been listed on the NYSE under the symbol “GPMT”. As of February 26, 2019, 50,885,503 shares of common stock were issued and outstanding.
Holders
As of February 20, 2019, there were 290 registered holders and approximately 57,199 beneficial owners of our common stock.
Our stock transfer agent and registrar is Equiniti Trust Company. Requests for information from Equiniti Trust Company can be sent to Equiniti Trust Company, P.O. Box 64856, St. Paul, MN 55164-0856 and their telephone number is 1-800-468-9716.
Securities Authorized for Issuance under Equity Compensation Plans
Our Equity Incentive Plan was adopted by our board of directors and approved by our stockholders on June 14, 2017 for the purpose of enabling us to provide equity compensation to attract and retain qualified directors, officers, advisers, consultants and other personnel, including affiliates and personnel of our Manager and its affiliates, and any joint venture affiliates of ours. The Plan is administered by the compensation committee of our board of directors and permits the granting of restricted shares of common stock, phantom shares, dividend equivalent rights and other equity-based awards.
The following table presents certain information about the Plan as of December 31, 2018:
|
| | | | | | | | | | |
| | December 31, 2018 |
Plan Category | | Number of securities to be issued upon exercise of outstanding options, warrants and rights | | Weighted-average exercise price of outstanding options, warrants and rights | | Number of securities remaining available for future issuance under equity compensation plans (excluding securities reflected in the first column of this table) |
Equity compensation plans approved by stockholders | | — |
| | $ | — |
| | 2,857,072 |
|
Equity compensation plans not approved by stockholders (1) | | — |
| | — |
| | |
Total | | — |
| | $ | — |
| | 2,857,072 |
|
___________________
| |
(1) | For a detailed description of the Plan, see Note 17 - Equity Incentive Plan of the consolidated financial statements included under Item 8 of this Annual Report on Form 10-K. |
Performance Graph
The following graph compares the stockholder’s cumulative total return, assuming $100 invested at June 28, 2017, with all reinvestment of dividends, as if such amounts had been invested in: (i) our common stock; (ii) the stocks included in the Standard and Poor’s 500 Stock Index, or S&P 500; and (iii) the stocks included in the Bloomberg REIT Mortgage Index.
COMPARISON OF CUMULATIVE TOTAL RETURN
Among Granite Point Mortgage Trust Inc.,
S&P 500 and Bloomberg REIT Mortgage Index
|
| | | | | | | | | | | | | | | | | | | | | | | | | | | | | | | | |
Index | | 6/28/17 | | 6/30/17 | | 9/30/17 |
| | 12/31/17 | | 3/31/18 |
| | 6/30/18 | | 9/30/18 |
| | 12/31/18 |
Granite Point Mortgage Trust Inc. | | $ | 100.00 |
| | $ | 99.84 |
| | $ | 100.53 |
| | $ | 97.25 |
| | $ | 94.19 |
| | $ | 106.77 |
| | $ | 112.18 |
| | $ | 109.74 |
|
S&P 500 | | $ | 100.00 |
| | $ | 99.30 |
| | $ | 103.75 |
| | $ | 110.64 |
| | $ | 100.53 |
| | $ | 103.99 |
| | $ | 112.00 |
| | $ | 96.86 |
|
Bloomberg REIT Mortgage Index | | $ | 100.00 |
| | $ | 99.21 |
| | $ | 102.67 |
| | $ | 102.58 |
| | $ | 97.95 |
| | $ | 102.58 |
| | $ | 105.17 |
| | $ | 99.12 |
|
Purchases of Equity Securities by the Issuer and Affiliated Purchasers
We did not repurchase any of our common stock during the fiscal years ended December 31, 2018 and 2017.
Item 6. Selected Financial Data
Our selected financial data set forth below should be read in conjunction with our consolidated financial statements and the accompanying notes included under Item 8 of this Annual Report on Form 10-K. As a result of our Formation Transaction on June 28, 2017, we are considered a continuation of our Predecessor’s business operations. Accordingly, our Predecessor’s historical results of operations and cash flows are included in our consolidated financial statements and the following selected financial data. Certain amounts for prior periods have been reclassified to conform to the 2018 presentation.
|
| | | | | | | | | | | | | | | |
| For the Years Ended December 31, |
(in thousands, except share data) | 2018 | | 2017 | | 2016 | | 2015 (1) |
Interest income: | | | | | | | |
Loans held-for-investment | $ | 179,284 |
| | $ | 113,050 |
| | $ | 55,627 |
| | $ | 8,410 |
|
Available-for-sale securities | 1,160 |
| | 1,035 |
| | 1,002 |
| | 84 |
|
Held-to-maturity securities | 3,194 |
| | 3,726 |
| | 4,192 |
| | 645 |
|
Cash and cash equivalents | 242 |
| | 26 |
| | 7 |
| | — |
|
Total interest income | 183,880 |
| | 117,837 |
| | 60,828 |
| | 9,139 |
|
Interest expense: | | | | | | | |
Repurchase agreements | 62,432 |
| | 37,968 |
| | 8,611 |
| | 396 |
|
Securitized debt obligations | 17,660 |
| | — |
| | — |
| | — |
|
Revolving credit facilities | 648 |
| | — |
| | — |
| | — |
|
Convertible senior notes | 10,783 |
| | 397 |
| | — |
| | — |
|
Note payable to affiliate | — |
| | 4,098 |
| | 2,418 |
| | 81 |
|
Total interest expense | 91,523 |
| | 42,463 |
| | 11,029 |
| | 477 |
|
Net interest income | 92,357 |
| | 75,374 |
| | 49,799 |
| | 8,662 |
|
Other income: | | | | | | | |
Realized gain on sales of loans held-for-investment | — |
| | — |
| | — |
| | 181 |
|
Fee income | 1,446 |
| | — |
| | 203 |
| | 14 |
|
Total other income | 1,446 |
| | — |
| | 203 |
| | 195 |
|
Expenses: | | | | | | | |
Management fees | 12,509 |
| | 9,737 |
| | 7,173 |
| | 1,178 |
|
Servicing expenses | 2,196 |
| | 1,354 |
| | 605 |
| | 73 |
|
Other operating expenses | 16,025 |
| | 10,982 |
| | 6,878 |
| | 7,398 |
|
Total expenses | 30,730 |
| | 22,073 |
| | 14,656 |
| | 8,649 |
|
Income before income taxes | 63,073 |
| | 53,301 |
| | 35,346 |
| | 208 |
|
(Benefit from) provision for income taxes | (2 | ) | | (4 | ) | | (11 | ) | | 70 |
|
Net income | 63,075 |
| | 53,305 |
| | 35,357 |
| | 138 |
|
Dividends on preferred stock | 100 |
| | 50 |
| | — |
| | — |
|
Net income attributable to common stockholders | $ | 62,975 |
| | $ | 53,255 |
| | $ | 35,357 |
| | $ | 138 |
|
Basic earnings per weighted average common share (See Note 19) | $ | 1.45 |
| | $ | 0.60 |
| | $ | — |
| | $ | — |
|
Diluted earnings per weighted average common share (See Note 19) | $ | 1.42 |
| | $ | 0.60 |
| | $ | — |
| | $ | — |
|
Dividends declared per common share | $ | 1.62 |
| | $ | 0.70 |
| | $ | — |
| | $ | — |
|
Basic weighted average number of shares of common stock outstanding | 43,445,384 |
| | 43,234,671 |
| | — |
| | — |
|
Diluted weighted average number of shares of common stock outstanding | 52,039,997 |
| | 43,234,671 |
| | — |
| | — |
|
____________________
| |
(1) | Commenced operations on January 7, 2015. |
|
| | | | | | | | | | | | | | | |
| For the Years Ended December 31, |
(in thousands, except share data) | 2018 | | 2017 | | 2016 | | 2015 (1) |
Comprehensive income: | | | | | | | |
Net income attributable to common stockholders | $ | 62,975 |
| | $ | 53,255 |
| | $ | 35,357 |
| | $ | 138 |
|
Other comprehensive (loss) income, net of tax: | | | | | | | |
Unrealized (loss) gain on available-for-sale securities, net | (192 | ) | | 112 |
| | (112 | ) | | — |
|
Other comprehensive (loss) income | (192 | ) | | 112 |
| | (112 | ) | | — |
|
Comprehensive income attributable to common stockholders | $ | 62,783 |
| | $ | 53,367 |
| | $ | 35,245 |
| | $ | 138 |
|
____________________
| |
(1) | Commenced operations on January 7, 2015. |
|
| | | | | | | | | | | | | | | |
| At December 31, |
(in thousands) | 2018 | | 2017 | | 2016 | | 2015 |
Loans held-for-investment | $ | 3,167,913 |
| | $ | 2,304,266 |
| | $ | 1,364,291 |
| | $ | 582,693 |
|
Total assets | $ | 3,361,881 |
| | $ | 2,499,130 |
| | $ | 1,495,607 |
| | $ | 722,744 |
|
Repurchase agreements | $ | 1,500,543 |
| | $ | 1,521,608 |
| | $ | 451,167 |
| | $ | 59,349 |
|
Securitized debt obligations | $ | 654,263 |
| | $ | — |
| | $ | — |
| | $ | — |
|
Revolving credit facilities | $ | 75,000 |
| | $ | — |
| | $ | — |
| | $ | — |
|
Convertible senior notes | $ | 268,138 |
| | $ | 121,314 |
| | $ | — |
| | $ | — |
|
Note payable to affiliate | $ | — |
| | $ | — |
| | $ | 593,631 |
| | $ | 167,262 |
|
Total stockholders’ equity | $ | 827,531 |
| | $ | 828,621 |
| | $ | 427,991 |
| | $ | 486,942 |
|
Item 7. Management’s Discussion and Analysis of Financial Condition and Results of Operations
The following discussion and analysis should be read in conjunction with the consolidated financial statements and accompanying notes included elsewhere in this Annual Report on Form 10-K.
Our Company
We are a Maryland corporation that focuses primarily on directly originating, investing in and managing senior floating-rate commercial mortgage loans and other debt and debt-like commercial real estate investments. We were formed to continue and expand the commercial real estate lending business established by Two Harbors Investment Corp., or Two Harbors, a publicly traded hybrid mortgage real estate investment trust. In the first quarter of 2015, Two Harbors established its commercial real estate lending business, TH Commercial Holdings LLC, collectively with its subsidiaries, our Predecessor. Concurrently with the closing of our initial public offering, or the IPO, on June 28, 2017, we completed a formation transaction, or the Formation Transaction, pursuant to which we acquired from Two Harbors the equity interests in our Predecessor, including its portfolio of commercial real estate debt investments and related financing. In exchange, we issued 33,071,000 shares of our common stock and 1,000 shares of our 10% cumulative redeemable preferred stock to Two Harbors. Upon the completion of the Formation Transaction, our Predecessor became our wholly owned indirect subsidiary. On November 1, 2017, Two Harbors distributed to its common stockholders the 33,071,000 shares of our common stock it had acquired in connection with the Formation Transaction, allowing our market capitalization to be fully floating. We are externally managed by Pine River Capital Management L.P., or our Manager.
We are a long-term, fundamental value-oriented investor. We construct our investment portfolio on a loan-by-loan basis, emphasizing rigorous credit underwriting, selectivity and diversification, and assess each investment from a fundamental value perspective relative to other opportunities available in the market. Our primary target investments are directly originated floating-rate performing senior commercial mortgage loans, typically with terms of three to five years, usually ranging in size from $25 million to $150 million. We typically provide intermediate-term bridge or transitional financing for a variety of purposes, including acquisitions, recapitalizations, refinancings and a range of business plans including lease-up, renovation, repositioning and repurposing of the property. We generally target the top 25, and up to the top 50, metropolitan statistical areas in the United States, or MSAs. We believe that those markets provide ample supply of high credit quality properties to lend against, sufficient numbers of owners and sponsors with institutional attributes, and adequate market liquidity. We believe this approach enables us to deliver attractive risk-adjusted returns to our stockholders while preserving our capital base through diverse business cycles.
Our origination strategy relies on our extensive and longstanding direct relationships with a wide array of national, regional and local private owner/operators, private equity firms, funds, REITs, brokers and co-lenders. Our team’s reach across the United States and active dialogue with market participants has produced a significant volume of investment opportunities since our Predecessor’s formation, and our reputation as a reliable counterparty has led to multiple investment opportunities with repeat clients. We have deep experience in the commercial real estate finance markets, with each of the senior members of our team of commercial real estate professionals having over 20 years of experience in commercial real estate debt markets.
We believe that the U.S. commercial real estate debt markets offer enduring investment opportunities. A significant amount of commercial real estate debt is scheduled to mature over the next five years, and there is a sustained need for acquisition, repositioning and recapitalization loans. We expect that traditional lenders, including banks which have historically accounted for approximately half of the market, will not be able to meet borrower demand due to structural and regulatory constraints. As a result, we believe that there are significant opportunities to originate floating-rate senior commercial real estate loans on transitional properties at attractive risk-adjusted return.
We have elected to be treated as a REIT for U.S. federal income tax purposes. To qualify as a REIT, we are required to meet certain investment and operating tests and annual distribution requirements. We generally will not be subject to U.S. federal income taxes on our taxable income to the extent that we annually distribute all of our net taxable income to stockholders, do not participate in prohibited transactions and maintain our intended qualification as a REIT. However, certain activities that we may perform may cause us to earn income which will not be qualifying income for REIT purposes. We have designated one of our subsidiaries as a taxable REIT subsidiary, or TRS, as defined in the Code, to engage in such activities, and we may form additional TRSs in the future. We also operate our business in a manner that will permit us to maintain our exclusion from registration under the Investment Company Act of 1940, as amended, or the Investment Company Act.
Our Portfolio
As of December 31, 2018, our investment portfolio consisted of 92 commercial real estate loans and two commercial mortgage-backed securities, or CMBS, having an aggregate principal balance of $3.2 billion and $39.5 million, respectively, with an additional $626.2 million of potential future funding obligations, diversified across geographies, property types, structures and credits.
We focus on originating senior commercial mortgage loans backed by different types of commercial real estate properties located in various markets across the United States. We may, from time to time, invest in other debt and debt-like commercial real estate investments. Together, we refer to these investments as our target investments. Our target investments include:
Primary Target Investments
| |
• | Senior Mortgage Loans. Commercial mortgage loans that are secured by real estate and evidenced by a first priority mortgage. These loans may vary in term, may bear interest at a fixed or floating rate (although our focus is floating-rate loans), and may amortize and typically require a balloon payment of principal at maturity. These investments may encompass a whole loan or may include pari passu participations within such a mortgage loan. These loans may finance stabilized properties or properties that are subject to a business plan that is expected to enhance the value of the property through lease-up, refurbishment, updating or repositioning. |
Secondary Target Investments
As part of our financing strategy, we may from time-to-time syndicate senior participations in our originated senior commercial mortgage loans to other investors and retain a subordinated debt position for our portfolio in the form of a mezzanine loan or subordinated mortgage interest, as described below. Alternatively, we may opportunistically co-originate the investments described below with senior lenders, or acquire them in the secondary market.
| |
• | Mezzanine Loans. Mezzanine loans are secured by a pledge of equity interests in the property. These loans are subordinate to a senior mortgage loan, but senior to the property owner’s equity. |
| |
• | Preferred Equity. Investments that are subordinate to any mortgage and mezzanine loans, but senior to the property owner’s common equity. |
| |
• | Subordinated Mortgage Interests. Sometimes referred to as a B-note, a subordinated mortgage interest is an investment in a junior portion of a mortgage loan. B-notes have the same borrower and benefit from the same underlying secured obligation and collateral as the senior mortgage loan, but are subordinated in priority payments in the event of default. |
| |
• | Other Real Estate Securities. Investments in real estate that take the form of CMBS or collateralized loan obligations, or CLOs, that are collateralized by pools of real estate debt instruments, which are often senior mortgage loans, or other securities. These may be classified as available-for-sale, or AFS, securities or held-to-maturity, or HTM, securities. |
Based on current market conditions, we expect that the majority of our investments will continue to consist of senior commercial mortgage loans directly originated by us and secured by cash-flowing properties located in the United States. These investments typically pay interest at rates that are determined periodically on the basis of a floating base lending rate, primarily LIBOR plus a premium,and have an expected term between three and five years.
We may opportunistically adjust our capital allocation to our target investments, with the proportion and types of investments changing over time depending on our views on, among other things, the current economic and credit environment. In addition, we may invest in assets other than our target investments, in each case subject to maintaining our qualification as a REIT for U.S. federal income tax purposes and our exclusion from regulation under the Investment Company Act.
Overview
Our 2018 efforts focused on four strategic objectives that we believe have positioned us for long-term success.
| |
• | Efficiently deploying capital available either from capital markets activities or repayments of our investments. Over the second half of 2017, we successfully and prudently invested the capital we raised in our June 2017 IPO. To provide additional growth capital, in December 2017 we accessed the capital markets via the private issuance of 5 year senior unsecured convertible notes. As a result, we began 2018 with significant investable funds allowing us to further grow our business. Over the course of the year, we prudently deployed our investable capital into assets with an attractive risk-return profile. By the end of the third quarter of 2018, our capital was substantially fully invested, at which point, in October 2018, we again successfully accessed the capital markets via the public issuance of 5 year senior unsecured convertible notes to provide us with additional funds to further grow our business. |
| |
• | Diversifying capital structure and financing sources. We are focused on actively managing the funding sources we use to finance our investments. Over the course of 2018 we engaged in various activities to diversify and expand our financing sources. In April 2018, established a short-term secured financing facility to help us manage our liquidity and our loan closing process. Additionally, in May 2018, we issued our inaugural CLO securitization, which provided us with efficiently priced, term-matched, non-recourse, and non-mark-to-market financing. Both initiatives further diversified our liabilities structure, which remains one of our ongoing strategic objectives. |
| |
• | Managing a portfolio of commercial real estate debt and related instruments to generate attractive returns with balanced risks. We are a long-term, fundamental value-oriented investor in floating senior commercial real estate loans and other debt related instruments. We construct our investment portfolio on a loan-by-loan basis, emphasizing rigorous credit underwriting, selectivity and diversification, and assess each investment from a fundamental value |
perspective relative to other opportunities available in the market. We believe this approach enables us to deliver attractive risk-adjusted returns to our stockholders while preserving our capital base through diverse business cycles.
| |
• | Maintaining “best in class” investment, corporate governance, investor relations and disclosure practices. We have established effective controls in the areas of operations, accounting, information technology and investor relations. |
Factors Affecting our Operating Results
The results of our operations are affected by a number of factors and primarily depend on, among other things, the level of our net interest income, the market value of our assets, credit performance of our assets and the supply of, and demand for, commercial real estate loans, other commercial real estate debt instruments and other financial assets available for investment in the market. Our net interest income, which reflects the amortization of origination fees and direct costs, is recognized based on the contractual rate and the outstanding principal balance of the loans we originate. The objective of the interest method is to arrive at periodic interest income that yields a level rate of return over the loan term. Interest rates vary according to the type of loan or security, conditions in the financial markets, credit worthiness of our borrowers, competition and other factors, none of which can be predicted with any certainty. Our operating results may also be impacted by credit losses in excess of initial anticipations or unanticipated credit events experienced by our borrowers.
Loan Originations
Our business model is mainly focused on directly originating, investing in and managing senior floating-rate commercial mortgage loans and other debt and debt-like commercial real estate investments. As a result of this strategy, our operating performance is subject to overall market demand for commercial real estate loan products and other debt and debt-like commercial real estate investments. We manage originations and acquisitions of our target investments by diversifying our investment portfolio across geographical regions and local markets, property types, borrower types, loan structures and types. We do not limit our investments to any number of geographical areas or property types for our originations and will continue to develop a well-diversified investment portfolio. Additionally, our CRE team has extensive experience originating and acquiring commercial real estate loans and other debt and debt-like commercial real estate investments, through a network of long-standing relationships with borrowers, sponsors and industry brokers.
Financing Availability
We are subject to availability and cost of financing to successfully execute on our business strategy and generate attractive risk-adjusted returns to our stockholders. Much of our financing is in the form of repurchase agreements or other types of credit facilities provided to us by our lender counterparties. We mitigate this counterparty risk by seeking to diversify our lending partners, focusing on establishing borrowing relationships with strong counterparties and continuously monitoring them through a thoughtful approach to counterparty risk oversight. Additionally, as part of our broader risk management strategy, and to the extent available in the market, we finance our business through other means which may include, but not be limited to, securitizations, note sales and issuance of unsecured debt and equity instruments. We will continue to actively explore additional types of funding facilities in order to further diversify our financing sources.
In October 2018, we closed an underwritten public offering of $131.6 million aggregate principal amount of convertible senior notes due 2023. The net proceeds from the offering were approximately $127.7 million after deducting underwriting discounts and expenses. The notes are unsecured, pay interest semiannually at a rate of 6.375% per annum and are convertible at the option of the holder into shares of our common stock. The notes will mature in October 2023, unless earlier converted or repurchased in accordance with their terms. We do not not have the right to redeem the notes prior to maturity, but may be required to repurchase the notes from holders under certain circumstances. As of December 31, 2018, the notes had a conversion rate of 48.8496 shares of common stock per $1,000 principal amount of the notes.
In the second quarter of 2018, we financed a pool of our commercial real estate loans through a collateralized loan obligation, or CLO, retaining the subordinate securities in our investment portfolio. The securitization was accounted for as a financing with the non-retained securitized debt obligations recognized on our balance sheet. The net proceeds from the securitized debt obligations were used to repay a portion of the outstanding balances of our repurchase facilities, to re-invest in our target assets and for other general corporate purposes.
On December 12, 2017, we closed a private placement of $125.0 million aggregate principal amount of convertible senior notes due 2022. On January 10, 2018, an additional $18.8 million in notes were issued in connection with the exercise of the initial purchaser’s option. The notes are unsecured, pay interest semiannually at a rate of 5.625% per annum and are convertible at the option of the holder into shares of our common stock. The notes will mature in December 2022, unless earlier converted or repurchased in accordance with their terms. We do not have the right to redeem the notes prior to maturity, but may be required to repurchase the notes from holders under certain circumstances. As of December 31, 2018, the notes had a conversion rate of 50.1610 shares of common stock per $1,000 principal amount of the notes. The net proceeds from the offering were approximately $139.5 million after deducting underwriting discounts and estimated offering expenses. We intend to use these proceeds to originate and acquire our target assets and for general corporate purposes.
During 2017, a portion of our portfolio was financed through a note payable to TH Insurance Holdings Company LLC, or TH Insurance, a captive insurance company and indirect subsidiary of Two Harbors and a member of the Federal Home Loan Bank of Des Moines, or the FHLB. In exchange for the note with TH Insurance, we received an allocated portion of TH Insurance’s advances from the FHLB and pledged to the FHLB a portion of our loans held-for-investment as collateral for TH Insurance’s advances. The affiliate note payable reflected terms consistent with TH Insurance’s FHLB advances. During 2017, the note payable to TH Insurance was in effect to assist with cash management and operational processes as the investments in our portfolio pledged to the FHLB were released and transitioned to our repurchase facilities. The affiliate note payable matured on October 27, 2017 and was repaid in full.
Credit Risk
We are subject to varying degrees of credit risk in connection with our target investments. We seek to mitigate this risk by seeking to originate or acquire assets of higher quality at appropriate rates of return given anticipated and unanticipated losses, by employing a comprehensive review and selection process and by proactively monitoring originated or acquired investments. Nevertheless, unanticipated credit losses could occur that could adversely impact our operating results.
Operating Expenses - Investment Management and Corporate Overhead
We incur significant general and administrative costs, including certain costs related to being a public company and costs incurred on our behalf by our Manager. We expect these costs to decline as a percentage of revenue as our company and portfolio continue to grow. We rely on our Manager to provide or obtain on our behalf the personnel and services necessary for us to conduct our business because we have no employees of our own. Our Manager performs these services for us and provides us with a comprehensive suite of investment and portfolio management services.
Under our management agreement with our Manager, we pay all costs and expenses of our Manager incurred on our behalf in order to operate our business, as well as all compensation costs for certain personnel providing services to us under the management agreement, other than personnel directly involved in supporting the investment function. We also pay our Manager a quarterly base management fee equal to 0.375% (a 1.50% annual rate) of our equity and an incentive fee, which is payable, if earned, beginning in the fourth quarter of 2018, as defined in the management agreement. See further discussion of the base management fee and incentive fee calculations in Note 14 - Commitments and Contingencies of the notes to the consolidated financial statements.
Market Conditions
We believe that the commercial real estate debt markets offer compelling investment opportunities especially when approached fundamentally with a focus on strong credit and cash flow characteristics, and high quality borrowers and sponsors. These investment opportunities are supported by active real estate transaction volumes, continuous need for refinancing of legacy loans, and borrower and sponsor demand for debt capital to renovate, reposition or redevelop their properties. Additionally, the stricter regulatory environment after the financial crisis of 2007 to 2009 for traditional providers of financing in this market, such as banks and insurance companies, limits the capacity of available funding for certain types of commercial real estate loans which comprise a large part of our target investments. We believe that this reduced funding capacity in the market combined with strong demand from borrowers provides us with the opportunities consistent with our investment strategy to invest our capital and generate attractive risk-adjusted returns for our stockholders.
Changes in the Fair Value of Our Investments
We intend to hold our target investments for the long-term, and as such they are carried at amortized cost on our consolidated balance sheets. We evaluate our investments for impairment on a quarterly basis and impairments are recognized when it is probable that we will not be able to collect all amounts estimated to be collected at the time of origination of the investment. We evaluate impairment (both interest and principal) based on the present value of expected future cash flows discounted at the investment’s effective interest rate or the fair value of the collateral less estimated costs to sell.
Although we intend to hold our target investments for the long-term, we may occasionally classify some of our investments as available-for-sale. Investments classified as available-for-sale are carried at their fair value, with changes in fair value recorded through accumulated other comprehensive income, a component of stockholders’ equity, rather than through earnings. We do not intend to hold any of our investments for trading purposes.
Changes in Market Interest Rates
Although our strategy is to primarily originate, invest in and manage senior floating-rate commercial mortgage loans, from time-to-time we may acquire fixed-rate investments, which exposes our operating results to the risks posed by fluctuation in interest rates. To the extent that this applies to us, we may choose to actively manage this risk through the use of our Manager’s sophisticated hedging strategies.
Critical Accounting Policies and Use of Estimates
The preparation of financial statements in accordance with U.S. GAAP requires us to make certain judgments and assumptions, based on information available at the time of our preparation of the financial statements, in determining accounting estimates used in preparation of the statements. Our significant accounting policies are described in Note 2 to the consolidated financial statements, included under Item 8 of this Annual Report on Form 10-K. Our most critical accounting policies involve decisions and assessments that could affect our reported assets and liabilities, as well as its reported revenues and expenses. We believe that all of the decisions and assessments used to prepare our financial statements are based upon reasonable assumptions given the information available at that time. The accounting policies and estimates that we believe are most critical to an investor’s understanding of our financial results and condition are discussed below.
Revenue Recognition
Interest income from loans receivable is recognized over the life of each investment using the effective interest method and is recorded on the accrual basis. Recognition of fees, premiums, and discounts associated with these investments is deferred until the loan is advanced and is then recorded over the term of the loan as an adjustment to yield. Income accrual is generally suspended for loans at the earlier of the date at which payments become more than 60 days past due or when recovery of income and principal becomes doubtful. Income is then recorded on the basis of cash received until accrual is resumed when the loan becomes contractually current and performance is demonstrated to be resumed. In addition, for loans originated, the related origination expenses are similarly deferred, however expenses related to loans acquired are included in general and administrative expenses as incurred.
Loans Held-for-Investment and Provision for Loan Losses
Loans held-for-investment are reported at cost, net of any unamortized acquisition premiums or discounts, loan fees and origination costs as applicable, unless the loans are deemed impaired. Impairment is indicated when it is deemed probable that we will not be able to collect all amounts due pursuant to the contractual terms of the loan. Because commercial mortgage loans are collateralized either by real property or by equity interests in the borrower, impairment is measured by comparing the estimated fair value of the underlying collateral less estimated costs to sell to the amortized cost of the respective loan. The valuation of the underlying collateral requires significant judgment, which includes assumptions regarding capitalization rates, leasing, credit worthiness of major tenants, occupancy rates, availability of financing, exit plan, loan sponsorship, actions of other lenders, overall economic conditions, the broader commercial real estate market, local geographic sub-markets, and other factors deemed necessary. If a loan is determined to be impaired, an allowance to reduce the carrying value of the loan is recorded through a charge to provision for loan losses. Actual losses, if any, could ultimately differ from these estimates.
A review of our portfolio is undertaken monthly, with more intense analysis and oversight done on a quarterly basis, and each loan is evaluated for impairment by assessing the risk factors of each loan and assigning a risk rating based on a variety of factors. Risk ratings are defined as follows:
| |
4 – | Higher Risk: A loan that has exhibited material deterioration in cash flows and/or other credit factors, which, if negative trends continue, could be indicative of future loss. |
| |
5 – | Impaired/Loss Likely: A loan that has a significantly increased probability of default or principal loss. |
Income Taxes
We intend to operate in a manner that will allow us to qualify to be taxed as a REIT for U.S. federal income tax purposes. As a result of our expected REIT qualification, we do not generally expect to pay U.S. federal corporate level taxes. To qualify as a REIT, we must meet a number of organizational and operational requirements, including a requirement to distribute annually at least 90% of our REIT taxable income to our stockholders. If we fail to qualify as a REIT in any taxable year, we will be subject to U.S. federal and state income taxes at regular corporate rates and may not be able to qualify as a REIT for four subsequent taxable years. Even if we qualify for taxation as a REIT, we may be subject to certain U.S. federal, state, local and foreign taxes on our income and property and to U.S. federal income and excise taxes on our undistributed REIT taxable income.
Summary of Results of Operations and Financial Condition
As a result of our Formation Transaction on June 28, 2017, we are considered a continuation of our Predecessor’s business operations. Accordingly, our Predecessor’s historical results of operations and cash flows are included in our consolidated financial statements and the following financial results discussion.
Our U.S. GAAP net income attributable to common stockholders was $16.7 million and $63.0 million ($0.37 and $1.42 per diluted weighted average share) for the three and twelve months ended December 31, 2018, as compared to U.S. GAAP net income attributable to common stockholders of $14.1 million and $53.3 million ($0.33 and $0.60 per diluted weighted average share) for the three and twelve months ended December 31, 2017. We have calculated earnings per share only for the period common stock was outstanding, referred to as the post-formation period. We have defined the post-formation period to be the period from the date we commenced operations as a publicly traded company on June 28, 2017 and on. Earnings per share is calculated by dividing the net income for the post-formation period by the weighted average number of shares outstanding during the post-formation period.
With our accounting treatment for AFS securities, unrealized fluctuations in the market values of AFS securities do not impact our U.S. GAAP net income or taxable income but are recognized on our consolidated balance sheets as a change in stockholders’ equity under “accumulated other comprehensive income.” For the three and twelve months ended December 31, 2018, net unrealized gains on AFS securities recognized as other comprehensive income, net of tax, were $223,971 and $(191,975), respectively. This, combined with U.S. GAAP net income attributable to common stockholders of $16.7 million and $63.0 million, resulted in comprehensive income attributable to common stockholders of $16.4 million and $62.8 million for the three and twelve months ended December 31, 2018, respectively. For the three and twelve months ended December 31, 2017, net unrealized losses on AFS securities recognized as other comprehensive loss, net of tax, were $15,998 and and net unrealized gains on AFS securities recognized as other comprehensive income, net of tax, were $111,985, respectively. This, combined with U.S. GAAP net income attributable to common stockholders of $14.1 million and $53.3 million, resulted in comprehensive income attributable to common stockholders of $14.1 million and $53.4 million for the three and twelve months ended December 31, 2017, respectively.
The following tables present the components of our comprehensive income for the three and twelve months ended December 31, 2018 and 2017, and the twelve months ended December 31, 2016:
|
| | | | | | | | | | | | | | | | | | | | |
(in thousands, except share data) | | Three Months Ended | | Year Ended |
Income Statement Data: | | December 31, | | December 31, |
| | 2018 | | 2017 | | 2018 | | 2017 | | 2016 |
Interest income: | | (unaudited) | |
|
Loans held-for-investment | | $ | 51,708 |
| | $ | 35,837 |
| | $ | 179,284 |
| | $ | 113,050 |
| | $ | 55,627 |
|
Available-for-sale securities | | 309 |
| | 268 |
| | 1,160 |
| | 1,035 |
| | 1,002 |
|
Held-to-maturity securities | | 716 |
| | 934 |
| | 3,194 |
| | 3,726 |
| | 4,192 |
|
Cash and cash equivalents | | 101 |
| | 16 |
| | 242 |
| | 26 |
| | 7 |
|
Total interest income | | 52,834 |
| | 37,055 |
| | 183,880 |
| | 117,837 |
| | 60,828 |
|
Interest expense: | | | | | | | | | | |
Repurchase agreements | | 17,000 |
| | 15,659 |
| | 62,432 |
| | 37,968 |
| | 8,611 |
|
Securitized debt obligations | | 7,092 |
| | — |
| | 17,660 |
| | — |
| | — |
|
Convertible senior notes | | 4,182 |
| | 397 |
| | 10,783 |
| | 397 |
| | — |
|
Revolving credit facilities | | 276 |
| | — |
| | 648 |
| | — |
| | |
Note payable to affiliate | | — |
| | 31 |
| | — |
| | 4,098 |
| | 2,418 |
|
Total interest expense | | 28,550 |
| | 16,087 |
| | 91,523 |
| | 42,463 |
| | 11,029 |
|
Net interest income | | 24,284 |
| | 20,968 |
| | 92,357 |
| | 75,374 |
| | 49,799 |
|
Other-than-temporary impairment losses | | — |
| | — |
| | — |
| | — |
| | — |
|
Other income: | | | | | | | | | | |
Fee income | | — |
| | — |
| | 1,446 |
| | — |
| | 203 |
|
Total other income | | — |
| | — |
| | 1,446 |
| | — |
| | 203 |
|
Expenses: | | | | | | | | | | |
Management fees | | 3,075 |
| | 3,020 |
| | 12,509 |
| | 9,737 |
| | 7,173 |
|
Servicing expense | | 628 |
| | 392 |
| | 2,196 |
| | 1,354 |
| | 605 |
|
Other operating expenses | | 3,884 |
| | 3,421 |
| | 16,025 |
| | 10,982 |
| | 6,878 |
|
Total expenses | | 7,587 |
| | 6,833 |
| | 30,730 |
| | 22,073 |
| | 14,656 |
|
Income before income taxes | | 16,697 |
| | 14,135 |
| | 63,073 |
| | 53,301 |
| | 35,346 |
|
Benefit from income taxes | | — |
| | (1 | ) | | (2 | ) | | (4 | ) | | (11 | ) |
Net income | | 16,697 |
| | 14,136 |
| | 63,075 |
| | 53,305 |
| | 35,357 |
|
Dividends on preferred stock | | 25 |
| | 25 |
| | 100 |
| | 50 |
| | — |
|
Net income attributable to common stockholders | | $ | 16,672 |
| | $ | 14,111 |
| | $ | 62,975 |
| | $ | 53,255 |
| | $ | 35,357 |
|
Basic earnings per weighted average common share (See Note 19) | | $ | 0.38 |
| | $ | 0.33 |
| | $ | 1.45 |
| | $ | 0.60 |
| | $ | — |
|
Diluted earnings per weighted average common share (See Note 19) | | $ | 0.37 |
| | $ | 0.33 |
| | $ | 1.42 |
| | $ | 0.60 |
| | |
Dividends declared per common share | | $ | 0.42 |
| | $ | 0.38 |
| | $ | 1.62 |
| | $ | 0.70 |
| | $ | — |
|
Weighted average number of shares of common stock outstanding: | | | | | | | | | | |
Basic | | 43,502,583 |
| | 43,235,103 |
| | 43,445,384 |
| | 43,234,671 |
| | |
Diluted | | 56,264,771 |
| | 43,235,103 |
| | 52,039,997 |
| | 43,234,671 |
| | — |
|
|
| | | | | | | | | | | | | | | | | | | | |
(in thousands, except share data) | | Three Months Ended | | Year Ended |
Income Statement Data: | | December 31, | | December 31, |
| | 2018 | | 2017 | | 2018 | | 2017 | | 2016 |
Comprehensive income: | | (unaudited) | | |
Net income attributable to common stockholders | | $ | 16,672 |
| | $ | 14,111 |
| | $ | 62,975 |
| | $ | 53,255 |
| | $ | 35,357 |
|
Other comprehensive (loss) income, net of tax: | | | | | | | | | | |
Unrealized (loss) gain on available-for-sale securities | | (224 | ) | | (16 | ) | | (192 | ) | | 112 |
| | (112 | ) |
Other comprehensive (loss) income | | (224 | ) | | (16 | ) | | (192 | ) | | 112 |
| | (112 | ) |
Comprehensive income attributable to common stockholders | | $ | 16,448 |
| | $ | 14,095 |
| | $ | 62,783 |
| | $ | 53,367 |
| | $ | 35,245 |
|
|
| | | | | | | | |
(in thousands) | | December 31,
2018 | | December 31,
2017 |
Balance Sheet Data: | | |
| | (unaudited) | | |
Loans held-for-investment | | $ | 3,167,913 |
| | $ | 2,304,266 |
|
Total assets | | $ | 3,361,881 |
| | $ | 2,499,130 |
|
Repurchase agreements | | $ | 1,500,543 |
| | $ | 1,521,608 |
|
Securitized debt obligations | | $ | 654,263 |
| | $ | — |
|
Revolving credit facilities | | $ | 75,000 |
| | $ | — |
|
Convertible senior notes | | $ | 268,138 |
| | $ | 121,314 |
|
Total stockholders’ equity | | $ | 827,531 |
| | $ | 828,621 |
|
Results of Operations
The following analysis focuses on financial results during the three and twelve months ended December 31, 2018 and 2017.
Interest Income
Interest income increased from $37.1 million and $117.8 million for the three and twelve months ended December 31, 2017 to $52.8 million and $183.9 million for the same periods in 2018, due to the origination of 44 commercial real estate loans with a principal balance of $1.2 billion, additional fundings of $139.5 million provided on existing loan commitments and upsizings of $24.5 million, offset by repayments of $484.2 million during the period from December 31, 2017 to December 31, 2018.
Interest Expense
Interest expense increased from $16.1 million and $42.5 million for the three and twelve months ended December 31, 2017 to $28.6 million and $91.5 million for the same periods in 2018, due to increased financing on the originations and acquisitions described above, as well as an increase in the proportion of total borrowings financed through repurchase agreements, securitized debt obligations and revolving credit facilities (relative to the note payable to TH Insurance), increases in borrowing rates due to increases in LIBOR and the issuance of convertible senior notes.
Net Interest Income
The following tables present the components of interest income and average annualized net asset yield earned by asset type, the components of interest expense and average annualized cost of funds on borrowings incurred by collateral type, and net interest income and average annualized net interest rate spread for the three and twelve months ended December 31, 2018 and 2017:
|
| | | | | | | | | | | | | | | | | | | | | |
| Three Months Ended December 31, 2018 | | Year Ended December 31, 2018 |
(dollars in thousands) | Average Balance | | Interest Income/Expense | | Net Yield/Cost of Funds | | Average Balance | | Interest Income/Expense | | Net Yield/Cost of Funds |
Interest-earning assets (1) | | | | | | | | | | | |
Loans held-for-investment | | | | | | | | | | |
|
|
Senior loans (2) | $ | 2,868,457 |
| | $ | 50,495 |
| | 7.0 | % | | $ | 2,525,123 |
| | $ | 173,367 |
| | 6.9 | % |
Subordinated loans | 46,474 |
| | 1,213 |
| | 10.4 | % | | 57,278 |
| | 5,917 |
| | 10.3 | % |
Available-for-sale securities | 12,798 |
| | 309 |
| | 9.7 | % | | 12,798 |
| | 1,160 |
| | 9.1 | % |
Held-to-maturity securities | 28,666 |
| | 716 |
| | 10.0 | % | | 34,096 |
| | 3,194 |
| | 9.4 | % |
Other | | | 101 |
| | | | | | 242 |
| |
|
|
Total interest income/net asset yield | $ | 2,956,395 |
| | $ | 52,834 |
| | 7.1 | % | | $ | 2,629,295 |
| | $ | 183,880 |
| | 7.0 | % |
Interest-bearing liabilities | | | | | | | | | | | |
Repurchase agreements and securitized debt obligations collateralized by: | | | | | | | | | | | |
Loans held-for-investment | | | | | | | | | | |
|
|
Senior loans (2) | $ | 1,967,781 |
| | $ | 23,917 |
| | 4.9 | % | | $ | 1,690,665 |
| | $ | 78,793 |
| | 4.7 | % |
Subordinated loans | 9,551 |
| | 129 |
| | 5.4 | % | | 12,328 |
| | 580 |
| | 4.7 | % |
Available-for-sale securities | 8,367 |
| | 93 |
| | 4.4 | % | | 8,400 |
| | 346 |
| | 4.1 | % |
Held-to-maturity securities | 18,482 |
| | 229 |
| | 5.0 | % | | 22,178 |
| | 1,021 |
| | 4.6 | % |
Other unsecured: | | | | |
|
| | | | | |
|
|
Convertible senior notes | 268,029 |
| | 4,182 |
| | 6.2 | % | | 168,321 |
| | 10,783 |
| | 6.4 | % |
Total interest expense/cost of funds | $ | 2,272,210 |
| | $ | 28,550 |
| | 5.0 | % | | $ | 1,901,892 |
| | $ | 91,523 |
| | 4.8 | % |
Net interest income/spread | | | $ | 24,284 |
| | 2.1 | % | | | | $ | 92,357 |
| | 2.2 | % |
|
| | | | | | | | | | | | | | | | | | | | | |
| Three Months Ended December 31, 2017 | | Year Ended December 31, 2017 |
(dollars in thousands) | Average Balance | | Interest Income/Expense | | Net Yield/Cost of Funds | | Average Balance | | Interest Income/Expense | | Net Yield/Cost of Funds |
Interest-earning assets (1) | | | | | | | | | | | |
Loans held-for-investment | | | | | | | | | | | |
Senior loans (2) | $ | 2,109,498 |
| | $ | 33,283 |
| | 6.3 | % | | $ | 1,694,445 |
| | $ | 103,200 |
| | 6.1 | % |
Subordinated loans | 103,919 |
| | 2,554 |
| | 9.8 | % | | 103,553 |
| | 9,850 |
| | 9.5 | % |
Available-for-sale securities | 12,798 |
| | 268 |
| | 8.4 | % | | 12,798 |
| | 1,035 |
| | 8.1 | % |
Held-to-maturity securities | 42,815 |
| | 934 |
| | 8.7 | % | | 44,172 |
| | 3,726 |
| | 8.4 | % |
Other | | | 16 |
| | | | | | 26 |
| | |
Total interest income/net asset yield | $ | 2,269,030 |
| | $ | 37,055 |
| | 6.5 | % | | $ | 1,854,968 |
| | $ | 117,837 |
| | 6.4 | % |
Interest-bearing liabilities | | | | | | | | | | | |
Repurchase agreements and note payable to affiliate collateralized by: | | | | | | | | | | | |
Loans held-for-investment | | | | | | | | | | | |
Senior loans (2) | $ | 1,466,658 |
| | $ | 15,148 |
| | 4.1 | % | | $ | 1,210,790 |
| | $ | 40,002 |
| | 3.3 | % |
Subordinated loans | 22,087 |
| | 213 |
| | 3.9 | % | | 22,940 |
| | 800 |
| | 3.5 | % |
Available-for-sale securities | 8,475 |
| | 73 |
| | 3.4 | % | | 8,270 |
| | 267 |
| | 3.2 | % |
Held-to-maturity securities | 25,996 |
| | 256 |
| | 3.9 | % | | 26,754 |
| | 997 |
| | 3.7 | % |
Other unsecured: | | | | | | | | | | | |
Convertible senior notes | 26,373 |
| | 397 |
| | 6.0 | % | | 6,647 |
| | 397 |
| | 6.0 | % |
Total interest expense/cost of funds | $ | 1,549,589 |
| | 16,087 |
| | 4.1 | % | | $ | 1,275,401 |
| | 42,463 |
| | 3.3 | % |
Net interest income/spread | | | $ | 20,968 |
| | 2.4 | % | | | | $ | 75,374 |
| | 3.1 | % |
____________________
| |
(1) | Average balance represents average amortized cost on loans held-for-investment, AFS securities and HTM securities. |
| |
(2) | Loans primarily secured by a first priority lien on commercial real property and related personal property and also includes, when applicable, any companion subordinate loans. |
The increase in yields on both senior loans and subordinated loans for the three and twelve months ended December 31, 2018, as compared to the same periods in 2017, was driven by increases in LIBOR, as the majority are floating-rate loans. The increase in cost of funds on both senior loans and subordinated loans for the three and twelve months ended December 31, 2018, as compared to the same periods in 2017, was primarily the result of an increase in the proportion of total borrowings financed through repurchase agreements, revolving credit facilities, securitized debt obligations (relative to the note payable to TH Insurance) and increases in borrowing rates due to increases in LIBOR. The cost of funds associated with our repurchase agreements, revolving credit facilities and securitized debt obligations also includes amortization of deferred debt issuance costs.
The increase in yields on AFS and HTM securities for the three and twelve months ended December 31, 2018, as compared to the same periods in 2017, was driven by increases in LIBOR, as these CMBS are floating-rate assets. The increase in cost of funds associated with the financing of AFS and HTM securities for the three and twelve months ended December 31, 2018, as compared to the same periods in 2017, was the result of increases in borrowing rates due to increases in LIBOR.
Our convertible senior notes were issued in December 2017 and October 2018, are unsecured and pay interest semiannually at a rate of 5.625% and 6.375%, respectively, per annum. The cost of funds associated with our convertible senior notes also includes amortization of deferred debt issuance costs.
Fee Income
During the twelve months ended December 31, 2018, we recognized $1.4 million in fee income related to penalty fees charged for early prepayments of loans held-for-investment. We did not recognize any fee income during the three months ended December 31, 2018 and the three and twelve months ended December 31, 2017.
Management Fees
We do not have any employees and are externally managed by our Manager under the terms of a management agreement entered into in connection with closing of the IPO and Formation Transaction on June 28, 2017. Under the management agreement, our Manager and its affiliates provide us with the personnel and resources necessary to operate our business. In accordance with the management agreement, we incurred $3.1 million and $12.5 million as a management fee to our Manager for the three and twelve months ended December 31, 2018, respectively, and $3.0 million and $6.3 million as a management fee to our Manager for the three and twelve months ended December 31, 2017, respectively. The management fee is calculated based on our equity with certain adjustments outlined in the management agreement. See further discussion of the base management fee calculation in Note 14 - Commitments and Contingencies of the notes to the consolidated financial statements.
Prior to the IPO and Formation Transaction, our Predecessor was allocated its proportionate share of management fees incurred by Two Harbors under the management agreement that Two Harbors has with PRCM Advisers LLC, or PRCM Advisers, a subsidiary of our Manager. Under its management agreement with PRCM Advisers as in effect during the relevant period, Two Harbors paid PRCM Advisers a base management fee equal to 1.5% of its adjusted equity on an annualized basis. Our Predecessor was allocated management fees incurred by Two Harbors of $3.4 million for the period from January 1, 2017 through June 27, 2017.
Servicing Expenses
For the three and twelve months ended December 31, 2018, we recognized $0.6 million and $2.2 million, respectively, in servicing expenses related to the subservicing of commercial real estate loans, compared to $0.4 million and $1.4 million for the same periods in 2017. The increase in servicing expenses during the three and twelve months ended December 31, 2018, as compared to the same period in 2017, was driven by the growth of our investment portfolio, as described above.
Other Operating Expenses
For the three and twelve months ended December 31, 2018, we recognized $3.9 million and $16.0 million of other operating expenses, which represents an annualized expense ratio of 1.9% of average equity for both periods. For the three and twelve months ended December 31, 2017, we recognized $3.4 million and $11.0 million of other operating expenses, which represents an annualized expense ratio of 1.6% and 1.7% of average equity, respectively. The increase in our operating expense ratio during the three and twelve months ended December 31, 2018, as compared to the same periods in 2017, resulted primarily from an increase in expenses related to the personnel and infrastructure to support the operation and growth of our business, as well as certain expenses required to maintain a public company.
Included in other operating expenses for the three and twelve months ended December 31, 2018 and 2017 are direct and allocated costs incurred by our Manager on our behalf and reimbursed by us. For the three and twelve months ended December 31, 2018, these direct and allocated costs totaled approximately $1.9 million and $8.6 million, respectively, compared to $1.2 million and $2.2 million for the same periods in 2017. Included in these reimbursed costs was compensation paid to employees of Pine River serving as our principal financial officer, chief operating officer and general counsel of $0.2 million and $1.3 million for the three and twelve months ended December 31, 2018, respectively, compared to $0.2 million and $0.3 million for the same periods in 2017. The allocation of compensation paid to employees of Pine River serving as our chief operating officer, principal financial officer and general counsel is based on time spent overseeing our company’s activities in accordance with the management agreement; we do not reimburse our Manager for any expenses related to the compensation of our chief executive officer or chief investment officer. Equity based compensation expense for the three and twelve months ended December 31, 2018 and 2017 also includes the amortization of the restricted stock awarded to our executive officers in conjunction with the Company’s 2017 Equity Incentive Plan, or the Plan (see discussion in Note 17 - Equity Incentive Plan), including our chief executive officer, chief investment officer, chief operating officer, principal financial officer and general counsel of $0.4 million and $2.6 million, respectively, compared to $0.4 million and $0.8 million for the same periods in 2017.
Also included in other operating expenses for the three and twelve months ended December 31, 2017 are direct and allocated costs that were paid by Two Harbors to PRCM Advisers and other third-party vendors. These direct and allocated costs totaled approximately $0.2 million and $4.5 million for the three and twelve months ended December 31, 2017, respectively.
Year Ended December 31, 2017 Compared to Year Ended December 31, 2016
The following analysis focuses on financial results during the years ended December 31, 2017 and 2016.
Interest Income
Interest income increased from $60.8 million for the year ended December 31, 2016 to $117.8 million for the year ended December 31, 2017, due to the origination and acquisition of 27 commercial real estate debt and related investments with a principal balance of $1.0 billion and additional fundings of $69.1 million provided on existing loan commitments and upsizings of $1.2 million, offset by repayments of $106.5 million during the period from December 31, 2016 to December 31, 2017.
Interest Expense
Interest expense increased from $11.0 million for the year ended December 31, 2016 to $42.5 million for the year ended December 31, 2017, due to increased financing on the originations and acquisitions described above, as well as increases in borrowing rates due to increases in LIBOR and the issuance of convertible senior notes.
Net Interest Income
The following table presents the components of interest income and average annualized net asset yield earned by asset type, the components of interest expense and average annualized cost of funds on borrowings incurred by collateral type, and net interest income and average annualized net interest rate spread for the years ended December 31, 2017 and 2016:
|
| | | | | | | | | | | | | | | | | | | | | |
| Year Ended December 31, 2017 | | Year Ended December 31, 2016 |
(dollars in thousands) | Average Balance | | Interest Income/Expense | | Net Yield/Cost of Funds | | Average Balance | | Interest Income/Expense | | Net Yield/Cost of Funds |
Interest-earning assets (1) | | | | | | | | | | | |
Loans held-for-investment | | | | | | | | | | | |
Senior loans (2) | $ | 1,694,445 |
| | $ | 103,200 |
| | 6.1 | % | | $ | 822,172 |
| | $ | 46,817 |
| | 5.7 | % |
Subordinated loans | 103,553 |
| | 9,850 |
| | 9.5 | % | | 89,661 |
| | 8,810 |
| | 9.8 | % |
Available-for-sale securities | 12,798 |
| | 1,035 |
| | 8.1 | % | | 13,273 |
| | 1,002 |
| | 7.5 | % |
Held-to-maturity securities | 44,172 |
| | 3,726 |
| | 8.4 | % | | 53,401 |
| | 4,192 |
| | 7.9 | % |
Other | | | 26 |
| | | | | | 7 |
| | |
Total interest income/net asset yield | $ | 1,854,968 |
| | $ | 117,837 |
| | 6.4 | % | | $ | 978,507 |
| | $ | 60,828 |
| | 6.2 | % |
Interest-bearing liabilities | | | | | | | | | | | |
Repurchase agreements and securitized debt obligations collateralized by: | | | | | | | | | | | |
Loans held-for-investment | | | | | | | | | | | |
Senior loans (2) | $ | 1,210,790 |
| | $ | 40,002 |
| | 3.3 | % | | $ | 550,169 |
| | $ | 9,240 |
| | 1.7 | % |
Subordinated loans | 22,940 |
| | 800 |
| | 3.5 | % | | 22,024 |
| | 554 |
| | 2.5 | % |
Available-for-sale securities | 8,270 |
| | 267 |
| | 3.2 | % | | 8,457 |
| | 226 |
| | 2.7 | % |
Held-to-maturity securities | 26,754 |
| | 997 |
| | 3.7 | % | | 31,850 |
| | 1,009 |
| | 3.2 | % |
Other unassignable: | | | | | | | | | | | |
Convertible senior notes | 6,647 |
| | 397 |
| | 6.0 | % | | — |
| | — |
| | — | % |
Total interest expense/cost of funds | $ | 1,275,401 |
| | 42,463 |
| | 3.3 | % | | $ | 612,500 |
| | 11,029 |
| | 1.8 | % |
Net interest income/spread | | | $ | 75,374 |
| | 3.1 | % | | | | $ | 49,799 |
| | 4.4 | % |
____________________
| |
(1) | Average balance represents average amortized cost on loans held-for-investment, AFS securities, and HTM securities. |
| |
(2) | Loans primarily secured by a first priority lien on commercial real property and related personal property and also includes, when applicable, any companion subordinate loans. |
The increase in yields on senior loans, subordinated loans, AFS securities and HTM securities for the year ended December 31, 2017, as compared to the year ended December 31, 2016, was driven by increases in LIBOR, as the majority are floating-rate assets. The increase in cost of funds on senior loans, subordinated loans, AFS securities and HTM securities for the year ended December 31, 2017, as compared to the year ended December 31, 2016, was primarily the result of an increase in the proportion of total borrowings financed through repurchase agreements (relative to the note payable to TH Insurance) and secondarily the result of increases in borrowing rates due to increases in LIBOR.
Our convertible senior notes were issued in December 2017, are unsecured and pay interest semiannually at a rate of 5.625% per annum. The cost of funds associated with our convertible senior notes also includes amortization of deferred debt issuance costs.
Management Fees
We do not have any employees and are externally managed by our Manager under the terms of a management agreement entered into in connection with closing of the IPO and Formation Transaction on June 28, 2017. Under the management agreement, our Manager and its affiliates provide us with the personnel and resources necessary to operate our business. In accordance with the management agreement with our Manager, we incurred $6.3 million as a management fee to our Manager for the year ended December 31, 2017. The management fee is calculated based on our equity with certain adjustments outlined in the management agreement. See further discussion of the base management fee calculation in Note 14 - Commitments and Contingencies of the notes to the consolidated financial statements.
Prior to the IPO and Formation Transaction, our Predecessor was allocated its proportionate share of management fees incurred by Two Harbors under the management agreement that Two Harbors has with PRCM Advisers. Under its management agreement with PRCM Advisers as in effect during the relevant period, Two Harbors paid PRCM Advisers a base management fee equal to 1.5% of its adjusted equity on an annualized basis. Our Predecessor was allocated management fees incurred by Two Harbors of $3.4 million for the period from January 1, 2017 through June 27, 2017 and $7.2 million for the year ended December 31, 2016.
Servicing Expenses
For the years ended December 31, 2017 and 2016, we recognized $1.4 million and $0.6 million, respectively, in servicing expenses related to the subservicing of commercial mortgage loans. The increase in servicing expenses during the year ended December 31, 2017, as compared to the year ended December 31, 2016, was driven by the growth of our investment portfolio, as described above.
Other Operating Expenses
For the years ended December 31, 2017 and 2016, we recognized $11.0 million and $6.9 million of other operating expenses, which represents an annualized expense ratio of 1.7% and 1.5% of average common equity for the respective periods. The increase in our operating expense ratio resulted primarily from an increase in expenses related to the personnel and infrastructure to support the operation and growth of our business, as well as certain expenses required to maintain a public company incurred during the year ended December 31, 2017.
Included in other operating expenses for the year ended December 31, 2017 were direct and allocated costs incurred by our Manager on our behalf and reimbursed by us of approximately $1.2 million. Included in these reimbursed costs was compensation paid to employees of Pine River serving as our principal financial officer, chief operating officer and general counsel of $0.3 million for the year ended December 31, 2017. We did not have any named officers in 2016. The allocation of compensation paid to employees of Pine River serving as our chief operating officer, principal financial officer and general counsel is based on time spent overseeing our company’s activities in accordance with the management agreement; we do not reimburse our Manager for any expenses related to the compensation of our chief executive officer or chief investment officer. Equity based compensation expense for the year ended December 31, 2017 also includes the amortization of the restricted stock awarded to our executive officers in conjunction with the Plan (see discussion in Note 17 - Equity Incentive Plan), including our chief executive officer, chief investment officer, chief operating officer, principal financial officer and general counsel of $0.8 million.
Also included in other operating expenses are direct and allocated costs that were paid by Two Harbors to PRCM Advisers and other third-party vendors. For the years ended December 31, 2017 and 2016, these direct and allocated costs totaled approximately $4.5 million and $6.9 million, respectively.
Financial Condition
We originate and acquire commercial real estate debt and related instruments generally to be held as long-term investments. These assets are classified as loans held-for-investment on the consolidated balance sheets. Loans held-for-investment are reported at cost, net of any unamortized acquisition premiums or discounts, loan fees and origination costs as applicable, unless the assets are deemed impaired. We also hold CMBS, representing interests in pools of commercial mortgage loans issued by trusts.
The following tables provide a summary of our portfolio as of December 31, 2018:
|
| | | | | | | | | | | | | | | | | | | | | | | | | |
(dollars in thousands) | | | | | | | | | | | | | | |
Type | | Maximum Loan Commitment | | Principal Balance | | Carrying Value | | Cash Coupon (2) | | Yield (3) | | Original Term (Years) | | Initial LTV (4) | | Stabilized LTV (5) |
Senior loans (1) | | $ | 3,773,465 |
| | $ | 3,147,310 |
| | $ | 3,121,582 |
| | L+3.98% | | L+4.75% | | 3.3 |
| | 67.1 | % | | 63.0 | % |
Subordinated loans | | 46,331 |
| | 46,331 |
| | 46,331 |
| | L+9.03% | | L+9.33% | | 6.0 |
| | 61.7 | % | | 56.7 | % |
CMBS | | 39,494 |
| | 39,494 |
| | 39,302 |
| | L+7.14% | | L+7.70% | | 2.8 |
| | 73.8 | % | | 73.7 | % |
Total/Wtd. Avg. | | $ | 3,859,290 |
| | $ | 3,233,135 |
| | $ | 3,207,215 |
| | L+4.06% | | L+4.83% | | 3.3 |
| | 67.1 | % | | 63.0 | % |
|
| | | | | | | | | | | | | | | | | | | | | | |
(dollars in millions) | | | | | | | | | | | | | | | | | | | | |
Type (1) | | Origination/ Acquisition Date | | Maximum Loan Commitment | | Principal Balance | | Carrying Value | | Cash Coupon (2) | | Yield (3) | | Original Term (Years) | | State | | Property Type | | Initial LTV (4) | | Stabilized LTV (5) |
Senior | | 07/18 | | $144.3 | | $112.9 | | $111.5 | | L+3.34% | | L+4.27% | | 2.0 | | CA | | Retail | | 50.7% | | 55.9% |
Senior | | 09/17 | | 125.0 | | 108.0 | | 107.3 | | L+4.45% | | L+5.03% | | 3.0 | | CT | | Office | | 62.9% | | 58.9% |
Senior | | 07/16 | | 120.4 | | 108.7 | | 108.0 | | L+4.45% | | L+4.99% | | 4.0 | | Various | | Office | | 62.8% | | 61.5% |
Senior | | 12/15 | | 119.9 | | 119.9 | | 119.8 | | L+3.65% | | L+4.43% | | 4.0 | | LA | | Mixed-Use | | 65.5% | | 60.0% |
Senior | | 12/18 | | 92.0 | | 27.0 | | 26.0 | | L+3.75% | | L+5.21% | | 3.0 | | NY | | Mixed-Use | | 26.2% | | 47.6% |
Senior | | 04/16 | | 89.0 | | 89.0 | | 89.0 | | L+3.70% | | L+5.44% | | 3.0 | | NY | | Industrial | | 75.9% | | 55.4% |
Senior | | 05/17 | | 86.7 | | 79.1 | | 78.4 | | L+3.50% | | L+4.82% | | 4.0 | | MA | | Office | | 71.3% | | 71.5% |
Senior | | 11/16 | | 82.3 | | 59.0 | | 58.6 | | L+3.25% | | L+5.78% | | 3.0 | | OR | | Office | | 66.5% | | 51.1% |
Senior | | 10/17 | | 74.8 | | 44.5 | | 44.2 | | L+4.07% | | L+4.47% | | 4.0 | | DC | | Office | | 67.0% | | 66.0% |
Senior | | 11/17 | | 73.3 | | 68.8 | | 68.2 | | L+4.45% | | L+5.20% | | 3.0 | | TX | | Hotel | | 68.2% | | 61.6% |
Senior | | 06/16 | | 68.4 | | 58.2 | | 57.9 | | L+3.87% | | L+4.93% | | 4.0 | | HI | | Retail | | 76.2% | | 57.4% |
Senior | | 11/17 | | 68.3 | | 60.8 | | 60.3 | | L+4.10% | | L+4.73% | | 3.0 | | CA | | Office | | 66.8% | | 67.0% |
Senior | | 08/16 | | 65.0 | | 63.5 | | 63.1 | | L+3.95% | | L+5.54% | | 4.0 | | NJ | | Office | | 60.8% | | 63.0% |
Senior | | 04/18 | | 64.0 | | 64.0 | | 63.5 | | L+3.78% | | L+4.23% | | 3.0 | | GA | | Hotel | | 68.8% | | 59.8% |
Senior | | 12/16 | | 62.3 | | 62.3 | | 61.2 | | L+3.30% | | L+4.87% | | 4.0 | | FL | | Office | | 73.3% | | 63.2% |
Senior | | 12/18 | | 60.1 | | 42.8 | | 42.3 | | L+2.90% | | L+3.44% | | 3.0 | | TX | | Office | | 68.5% | | 66.7% |
Senior | | 01/17 | | 58.6 | | 44.6 | | 44.3 | | L+4.50% | | L+5.16% | | 3.0 | | CA | | Industrial | | 51.0% | | 60.4% |
Senior | | 01/17 | | 56.2 | | 56.2 | | 55.8 | | L+4.75% | | L+5.24% | | 4.0 | | SC | | Office | | 67.6% | | 67.1% |
Senior | | 11/15 | | 54.3 | | 46.6 | | 46.5 | | L+4.55% | | L+5.13% | | 4.0 | | MD | | Office | | 80.0% | | 64.5% |
Senior | | 09/17 | | 54.0 | | 53.1 | | 52.8 | | L+4.38% | | L+4.91% | | 3.0 | | NY | | Industrial | | 68.7% | | 72.0% |
Senior | | 10/18 | | 52.2 | | 47.5 | | 47.1 | | L+2.70% | | L+3.10% | | 3.0 | | NJ | | Industrial | | 73.9% | | 68.8% |
Senior | | 05/17 | | 52.0 | | 36.0 | | 35.7 | | L+4.70% | | L+5.50% | | 3.0 | | HI | | Hotel | | 60.8% | | 59.4% |
Senior | | 12/15 | | 51.5 | | 50.2 | | 50.2 | | L+4.65% | | L+4.87% | | 4.0 | | PA | | Office | | 74.5% | | 67.5% |
Senior | | 11/15 | | 51.4 | | 51.4 | | 51.2 | | L+4.75% | | L+4.67% | | 3.0 | | NY | | Office | | 66.4% | | 68.7% |
Senior | | 12/18 | | 51.0 | | 51.0 | | 50.5 | | L+2.99% | | L+3.40% | | 3.0 | | IL | | Multifamily | | 78.6% | | 74.9% |
Senior | | 09/18 | | 50.1 | | 19.2 | | 18.8 | | L+3.25% | | L+4.13% | | 3.0 | | IL | | Office | | 47.9% | | 56.1% |
Senior | | 05/18 | | 50.0 | | 49.7 | | 49.3 | | L+3.60% | | L+3.85% | | 3.0 | | TX | | Multifamily | | 71.1% | | 71.4% |
Senior | | 10/18 | | 49.0 | | 15.0 | | 14.6 | | L+4.15% | | L+5.24% | | 3.0 | | IL | | Multifamily | | 60.7% | | 62.4% |
Senior | | 12/18 | | 49.0 | | 40.8 | | 40.4 | | L+2.93% | | L+3.39% | | 3.0 | | NY | | Industrial | | 56.5% | | 56.3% |
Senior | | 02/16 | | 47.6 | | 46.0 | | 45.7 | | L+3.78% | | L+4.72% | | 3.0 | | TX | | Office | | 72.9% | | 70.4% |
Senior | | 12/17 | | 47.0 | | 31.0 | | 30.6 | | L+4.38% | | L+5.26% | | 3.0 | | MA | | Mixed-Use | | 72.9% | | 62.0% |
Senior | | 08/17 | | 47.0 | | 40.5 | | 40.1 | | L+3.65% | | L+4.88% | | 3.0 | | LA | | Multifamily | | 64.6% | | 60.9% |
Senior | | 05/18 | | 46.5 | | 29.9 | | 29.6 | | L+4.07% | | L+4.63% | | 3.0 | | NY | | Mixed-Use | | 57.0% | | 51.1% |
Senior | | 06/18 | | 46.0 | | 41.0 | | 40.6 | | L+3.60% | | L+4.06% | | 3.0 | | WY | | Hotel | | 67.4% | | 62.3% |
Senior | | 06/17 | | 45.0 | | 45.0 | | 44.7 | | L+4.50% | | L+5.24% | | 3.0 | | CA | | Hotel | | 54.7% | | 48.6% |
Senior | | 08/18 | | 44.8 | | 38.3 | | 38.0 | | L+2.93% | | L+3.32% | | 3.0 | | TX | | Multifamily | | 68.9% | | 63.6% |
Senior | | 08/17 | | 40.0 | | 40.0 | | 39.8 | | L+4.24% | | L+4.40% | | 3.0 | | KY | | Multifamily | | 79.8% | | 73.1% |
Senior | | 11/18 | | 39.6 | | 16.2 | | 15.8 | | L+4.54% | | L+5.50% | | 3.0 | | CA | | Mixed-Use | | 69.9% | | 67.9% |
Senior | | 05/18 | | 38.8 | | 32.0 | | 31.8 | | L+3.55% | | L+3.95% | | 3.0 | | MA | | Office | | 47.0% | | 41.1% |
Senior | | 06/18 | | 38.1 | | 33.5 | | 33.1 | | L+7.76% | | L+10.13% | | 1.0 | | PA | | Office | | 55.6% | | 63.4% |
Senior | | 12/17 | | 37.2 | | 31.8 | | 31.5 | | L+3.90% | | L+4.55% | | 3.0 | | CA | | Office | | 69.8% | | 66.4% |
Senior | | 11/16 | | 37.0 | | 34.4 | | 34.2 | | L+4.27% | | L+5.03% | | 3.0 | | NY | | Multifamily | | 61.3% | | 56.9% |
Senior | | 10/18 | | 36.8 | | 29.4 | | 29.0 | | L+2.85% | | L+3.45% | | 3.0 | | NY | | Industrial | | 71.2% | | 70.8% |
|
| | | | | | | | | | | | | | | | | | | | | | |
(dollars in millions) | | | | | | | | | | | | | | | | | | | | |
Type (1) | | Origination/ Acquisition Date | | Maximum Loan Commitment | | Principal Balance | | Carrying Value | | Cash Coupon (2) | | Yield (3) | | Original Term (Years) | | State | | Property Type | | Initial LTV (4) | | Stabilized LTV (5) |
Senior | | 05/17 | | 35.2 | | 28.6 | | 28.3 | | L+5.00% | | L+5.97% | | 3.0 | | TX | | Office | | 68.7% | | 65.1% |
Senior | | 06/18 | | 34.9 | | 16.8 | | 16.5 | | L+4.07% | | L+4.75% | | 3.0 | | OH | | Hotel | | 70.6% | | 57.4% |
Senior | | 12/18 | | 34.1 | | 26.9 | | 26.6 | | L+2.92% | | L+3.27% | | 4.0 | | IL | | Multifamily | | 70.8% | | 62.1% |
Senior | | 10/17 | | 34.1 | | 21.9 | | 21.7 | | L+4.05% | | L+4.69% | | 3.0 | | AZ | | Office | | 62.6% | | 59.5% |
Senior | | 05/17 | | 33.8 | | 27.6 | | 27.4 | | L+4.40% | | L+5.36% | | 3.0 | | AZ | | Office | | 69.5% | | 59.0% |
Senior | | 03/16 | | 33.8 | | 33.8 | | 33.6 | | 5.11% | | 5.26% | | 10.0 | | NJ | | Office | | 74.9% | | 74.9% |
Senior | | 10/16 | | 32.2 | | 27.2 | | 27.1 | | L+4.55% | | L+5.16% | | 3.0 | | CA | | Office | | 68.6% | | 48.6% |
Senior | | 05/17 | | 30.9 | | 28.5 | | 28.4 | | L+3.50% | | L+5.19% | | 4.0 | | FL | | Office | | 69.3% | | 68.5% |
Senior | | 07/17 | | 30.0 | | 30.0 | | 29.9 | | L+4.10% | | L+4.58% | | 3.0 | | NY | | Multifamily | | 76.5% | | 76.5% |
Senior | | 06/18 | | 29.3 | | 19.0 | | 18.7 | | L+3.40% | | L+4.18% | | 3.0 | | CA | | Office | | 69.1% | | 64.3% |
Senior | | 06/18 | | 29.0 | | 29.0 | | 28.7 | | L+3.55% | | L+3.96% | | 3.0 | | TX | | Multifamily | | 74.3% | | 68.2% |
Senior | | 11/18 | | 28.6 | | 23.8 | | 23.4 | | L+3.50% | | L+4.12% | | 3.0 | | TN | | Office | | 61.8% | | 63.6% |
Senior | | 12/18 | | 27.5 | | 20.5 | | 20.3 | | L+3.90% | | L+4.42% | | 3.0 | | MN | | Hotel | | 64.7% | | 57.7% |
Senior | | 09/17 | | 26.9 | | 23.5 | | 23.4 | | L+4.90% | | L+5.52% | | 3.0 | | MA | | Hotel | | 67.3% | | 63.9% |
CMBS | | 11/15 | | 26.7 | | 26.7 | | 26.7 | | L+7.25% | | L+8.06% | | 2.8 | | Various | | Office | | 77.6% | | 77.5% |
Senior | | 07/17 | | 26.0 | | 23.5 | | 23.3 | | L+4.20% | | L+4.86% | | 3.0 | | CA | | Office | | 62.3% | | 64.2% |
Senior | | 01/18 | | 26.0 | | 26.0 | | 25.9 | | L+5.13% | | L+5.58% | | 3.0 | | AZ | | Hotel | | 65.8% | | 61.3% |
Senior | | 12/18 | | 26.0 | | 20.7 | | 20.4 | | L+2.95% | | L+3.43% | | 3.0 | | FL | | Office | | 61.9% | | 65.5% |
Senior | | 06/18 | | 25.9 | | 25.9 | | 25.6 | | L+3.50% | | L+4.37% | | 3.0 | | PA | | Industrial | | 72.1% | | 66.1% |
Senior | | 09/18 | | 25.5 | | 21.0 | | 20.8 | | L+3.87% | | L+4.42% | | 3.0 | | NY | | Mixed-Use | | 60.2% | | 59.3% |
Senior | | 10/15 | | 25.0 | | 25.0 | | 24.8 | | L+4.07% | | L+5.76% | | 3.0 | | MO | | Hotel | | 73.2% | | 57.8% |
Senior | | 10/18 | | 23.7 | | 8.3 | | 8.2 | | L+4.21% | | L+5.16% | | 3.0 | | CT | | Hotel | | 75.4% | | 66.9% |
Senior | | 08/17 | | 23.6 | | 23.6 | | 23.5 | | L+4.20% | | L+4.50% | | 3.0 | | NY | | Office | | 72.7% | | 66.7% |
Senior | | 08/16 | | 23.4 | | 23.4 | | 23.3 | | L+5.15% | | L+5.42% | | 4.0 | | NY | | Industrial | | 70.0% | | 67.6% |
Senior | | 01/18 | | 23.3 | | 19.7 | | 19.5 | | L+4.77% | | L+5.50% | | 3.0 | | PA | | Mixed-Use | | 66.8% | | 67.3% |
Senior | | 03/18 | | 23.0 | | 23.0 | | 22.9 | | L+4.05% | | L+4.65% | | 2.0 | | FL | | Office | | 60.8% | | 60.8% |
Senior | | 06/18 | | 22.8 | | 16.3 | | 16.2 | | L+4.21% | | L+4.73% | | 3.0 | | FL | | Retail | | 74.0% | | 69.4% |
Senior | | 04/18 | | 22.2 | | 19.9 | | 19.7 | | L+4.05% | | L+4.46% | | 3.0 | | KS | | Multifamily | | 72.1% | | 67.4% |
Senior | | 08/17 | | 21.9 | | 16.7 | | 16.6 | | L+4.77% | | L+5.49% | | 3.0 | | PA | | Office | | 66.7% | | 67.3% |
Senior | | 12/18 | | 21.8 | | 7.5 | | 7.3 | | L+4.44% | | L+5.56% | | 3.0 | | PA | | Multifamily | | 61.5% | | 67.0% |
Senior | | 07/17 | | 21.5 | | 20.0 | | 19.9 | | L+4.15% | | L+4.42% | | 3.0 | | GA | | Multifamily | | 75.6% | | 65.8% |
Senior | | 10/18 | | 21.5 | | 18.2 | | 18.0 | | L+3.24% | | L+3.69% | | 3.0 | | TX | | Office | | 73.0% | | 69.9% |
Senior | | 12/18 | | 21.2 | | 19.5 | | 19.4 | | L+3.42% | | L+3.88% | | 2.0 | | MN | | Multifamily | | 73.6% | | 73.7% |
Senior | | 02/18 | | 21.2 | | 17.3 | | 17.1 | | L+4.05% | | L+4.54% | | 3.0 | | CA | | Office | | 71.9% | | 62.0% |
Senior | | 08/17 | | 20.8 | | 15.0 | | 14.9 | | L+5.25% | | L+6.12% | | 3.0 | | FL | | Multifamily | | 74.1% | | 60.9% |
Senior | | 10/16 | | 20.0 | | 17.7 | | 17.6 | | L+4.85% | | L+5.90% | | 3.0 | | NY | | Multifamily | | 73.8% | | 62.5% |
Senior | | 03/18 | | 19.8 | | 19.8 | | 19.5 | | L+5.15% | | L+5.71% | | 3.0 | | CA | | Hotel | | 67.2% | | 60.0% |
Senior | | 01/17 | | 19.0 | | 19.0 | | 18.8 | | L+4.80% | | L+5.27% | | 4.0 | | TX | | Retail | | 70.4% | | 69.5% |
Senior | | 11/18 | | 19.0 | | 13.1 | | 12.9 | | L+3.20% | | L+3.83% | | 3.0 | | CA | | Office | | 73.1% | | 64.5% |
Senior | | 04/18 | | 18.7 | | 18.7 | | 18.6 | | L+4.29% | | L+4.65% | | 3.0 | | NV | | Multifamily | | 78.7% | | 66.1% |
Senior | | 04/18 | | 18.5 | | 18.5 | | 18.4 | | L+3.25% | | L+3.53% | | 3.0 | | CA | | Multifamily | | 77.1% | | 70.6% |
Senior | | 04/18 | | 18.5 | | 18.5 | | 18.4 | | L+3.25% | | L+3.53% | | 3.0 | | CA | | Multifamily | | 76.8% | | 64.0% |
Senior | | 12/16 | | 17.5 | | 12.6 | | 12.5 | | L+5.90% | | L+6.97% | | 3.0 | | CA | | Office | | 70.4% | | 72.0% |
Mezzanine | | 08/15 | | 17.0 | | 17.0 | | 17.0 | | L+8.75% | | L+9.03% | | 2.0 | | FL | | Hotel | | 70.7% | | 67.9% |
Senior | | 07/18 | | 16.6 | | 10.4 | | 10.3 | | L+3.75% | | L+4.35% | | 3.0 | | CA | | Office | | 77.1% | | 63.5% |
Senior | | 09/18 | | 16.5 | | 16.5 | | 16.5 | | L+2.85% | | L+3.06% | | 3.0 | | SC | | Multifamily | | 79.4% | | 72.2% |
Senior | | 11/18 | | 16.2 | | 16.0 | | 15.8 | | L+3.15% | | L+3.65% | | 3.0 | | TX | | Multifamily | | 68.8% | | 68.7% |
Mezzanine | | 01/17 | | 14.7 | | 14.7 | | 14.6 | | 8.00% | | 8.11% | | 10.0 | | HI | | Hotel | | 41.4% | | 36.2% |
CMBS | | 12/15 | | 12.8 | | 12.8 | | 12.6 | | L+6.91% | | L+6.95% | | 2.8 | | Various | | Office | | 65.8% | | 65.8% |
Mezzanine | | 08/15 | | 9.9 | | 9.9 | | 9.9 | | L+9.50% | | L+9.84% | | 5.0 | | GA | | Office | | 73.3% | | 67.1% |
Mezzanine | | 11/15 | | 4.8 | | 4.8 | | 4.8 | | 13.00% | | 12.50% | | 10.0 | | NY | | Hotel | | 68.3% | | 58.0% |
Total/Weighted Average | | $3,859.3 | | $3,233.1 | | $3,207.2 | | L+4.06% | | L+4.83% | | 3.3 | | | | | | 67.1% | | 63.0% |
____________________
| |
(1) | “Senior” means a loan primarily secured by a first priority lien on commercial real property and related personal property and also includes, when applicable, any companion subordinate loans. |
| |
(2) | Cash coupon does not include origination or exit fees. Weighted average cash coupon excludes fixed rate loans. |
| |
(3) | Yield includes net origination fees and exit fees, but does not include future fundings, and is expressed as a monthly equivalent. Weighted average yield excludes fixed rate loans. |
| |
(4) | Initial LTV is calculated as the initial loan amount (plus any financing that is pari passu with or senior to such loan) divided by the as is appraised value (as determined in conformance with the Uniform Standards of Professional Appraisal Practice, or USPAP) as of the date of the loan was originated set forth in the original appraisal. |
| |
(5) | Stabilized LTV is calculated as the fully funded loan amount (plus any financing that is pari passu with or senior to such loan), including all contractually provided for future fundings, divided by the as stabilized value (as determined in conformance with USPAP) set forth in the original appraisal. As stabilized value may be based on certain assumptions, such as future construction completion, projected re-tenanting, payment of tenant improvement or leasing commissions allowances or free or abated rent periods, or increased tenant occupancies. |
As of December 31, 2018, our borrowings consisted of repurchase agreements and revolving credit facilities collateralized by our pledge of loans held-for-investment, AFS and HTM securities (CMBS) and certain cash balances, securitized debt obligations issued by a CLO and collateralized by a pool of loans held-for-investment and long-term unsecured convertible senior notes.
As of December 31, 2018, we had outstanding $1.5 billion of repurchase agreements, and the term to maturity ranged from from 39 days to approximately 1.5 years. Repurchase agreements had a weighted average borrowing rate of 4.61% and weighted average remaining maturities of 0.9 years as of December 31, 2018.
As of December 31, 2018, we had outstanding $75.0 million of revolving credit facilities with a weighted average borrowing rate of 5.2% and weighted average remaining maturities of 1.3 years.
As of December 31, 2018, we had outstanding $654.3 million of securitized debt obligations with a weighted average borrowing rate of 3.58% and weighted average remaining maturities of 1.7 years.
On December 12, 2017, we closed a private placement of $125.0 million aggregate principal amount of convertible senior notes due 2022. On January 10, 2018, an additional $18.8 million in notes were issued in connection with the exercise of the initial purchaser’s option. The net proceeds from the offering were approximately $139.5 million after deducting underwriting discounts and estimated offering expenses, which were used to originate and acquire our target assets and for general corporate purposes. The notes are unsecured, pay interest semiannually at a rate of 5.625% per annum and are convertible at the option of the holder into shares of our common stock. The notes will mature in December 2022, unless earlier converted or repurchased in accordance with their terms. We do not have the right to redeem the notes prior to maturity, but may be required to repurchase the notes from holders under certain circumstances. As of December 31, 2018, the notes had a conversion rate of 50.1610 shares of common stock per $1,000 principal amount of the notes. As of December 31, 2018, the outstanding amount due on convertible senior notes was $268.1 million, net of deferred issuance costs.
In October 2018, we closed an underwritten public offering of $131.6 million aggregate principal amount of convertible senior notes due 2023. The net proceeds from the offering were approximately $127.7 million after deducting underwriting discounts and expenses. The notes are unsecured, pay interest semiannually at a rate of 6.375% per annum and are convertible at the option of the holder into shares of our common stock. The notes will mature in October 2023, unless earlier converted or repurchased in accordance with their terms. We do not not have the right to redeem the notes prior to maturity, but may be required to repurchase the notes from holders under certain circumstances. As of December 31, 2018, the notes had a conversion rate of 48.8496 shares of common stock per $1,000 principal amount of the notes.
As of December 31, 2018, the debt-to-equity ratio with respect to our loans held-for-investment, AFS securities and HTM securities, which includes unsecured borrowings under convertible senior notes, was 3.0:1.0. We believe our debt-to-equity ratio provides unused borrowing capacity and, thus, improves our liquidity and the strength of our balance sheet.
The following table provides the quarterly average balances, the quarter-end balances, and the maximum balances at any month-end within that quarterly period, of borrowings under repurchase agreements, revolving credit facilities, securitized debt obligations and convertible senior notes for the three months ended December 31, 2018, and the four immediately preceding quarters:
|
| | | | | | | | | | | |
(in thousands) | Quarterly Average | | End of Period Balance | | Maximum Balance of Any Month-End |
For the Three Months Ended December 31, 2018 | $ | 2,272,209 |
| | $ | 2,497,944 |
| | $ | 2,497,945 |
|
For the Three Months Ended September 30, 2018 | $ | 1,953,052 |
| | $ | 2,074,563 |
| | $ | 2,074,563 |
|
For the Three Months Ended June 30, 2018 | $ | 1,762,115 |
| | $ | 1,811,046 |
| | $ | 1,900,561 |
|
For the Three Months Ended March 31, 2018 | $ | 1,634,541 |
| | $ | 1,664,201 |
| | $ | 1,685,529 |
|
For the Three Months Ended December 30, 2017 | $ | 1,549,588 |
| | $ | 1,642,922 |
| | $ | 1,642,922 |
|
U.S. GAAP to Estimated Taxable Income
The following tables provide reconciliations of our GAAP net income (loss) to our estimated taxable income (loss) split between our REIT and taxable REIT subsidiaries for the years ended December 31, 2018 and December 31, 2017:
|
| | | | | | | | | | | |
| Year Ended December 31, 2018 |
(dollars in millions) | TRS | | REIT | | Consolidated |
GAAP net income, pre-tax | $ | — |
| | $ | 63.1 |
| | $ | 63.1 |
|
Permanent differences | | | | | |
GAAP net income prior to formation | — |
| | — |
| | — |
|
Other permanent differences | — |
| | (0.4 | ) | | (0.4 | ) |
Temporary differences | | | | | |
Net accretion of OID and market discount | — |
| | 6.3 |
| | 6.3 |
|
Net realized gains | — |
| | 5.0 |
| | 5.0 |
|
Other temporary differences | — |
| | 2.6 |
| | 2.6 |
|
Estimated taxable income | — |
| | 76.6 |
| | 76.6 |
|
Dividend declaration deduction | — |
| | (76.6 | ) | | (76.6 | ) |
Estimated taxable income post-dividend deduction | $ | — |
| | $ | — |
| | $ | — |
|
|
| | | | | | | | | | | |
| Year Ended December 31, 2017 |
(dollars in millions) | TRS | | REIT | | Consolidated |
GAAP net income, pre-tax | $ | — |
| | $ | 53.3 |
| | $ | 53.3 |
|
Permanent differences | | | | | |
GAAP net income prior to formation | — |
| | (27.5 | ) | | (27.5 | ) |
Other permanent differences | — |
| | (0.1 | ) | | (0.1 | ) |
Temporary differences | | | | | — |
|
Net accretion of OID and market discount | — |
| | 6.0 |
| | 6.0 |
|
Net realized gains | — |
| | — |
| | — |
|
Other temporary differences | — |
| | 0.7 |
| | 0.7 |
|
Estimated taxable income | — |
| | 32.4 |
| | 32.4 |
|
Dividend declaration deduction | — |
| | (32.4 | ) | | (32.4 | ) |
Estimated taxable income post-dividend deduction | $ | — |
| | $ | — |
| | $ | — |
|
The permanent tax differences recorded in 2018 and 2017 include income prior to our formation as well as a recurring difference in compensation expense related to restricted stock dividends. Temporary differences were principally timing differences between U.S. GAAP and tax accounting related to accretion from loans held-for-investment and amendments to loans treated as “significant modifications” for tax under applicable Treasury regulations.
Dividends
For the year ended December 31, 2018, we declared dividends totaling $1.62 per share. As a REIT, we are required to distribute at least 90% of our taxable income to stockholders, subject to certain distribution requirements. For the year ended December 31, 2018, our board of directors elected to distribute the majority of our taxable income to avoid U.S. Federal Income taxes. As such, temporary differences between GAAP net income (loss) and taxable income can generate deterioration in book value on a permanent and temporary basis as taxable income is distributed that has not been earned for U.S. GAAP purposes. The following table presents cash dividends declared on our common stock since our formation:
|
| | | | | | | | |
Declaration Date | | Record Date | | Payment Date | | Cash Dividend Per Share |
December 19, 2018 | | December 31, 2018 | | January 18, 2019 | | $ | 0.42 |
|
September 20, 2018 | | October 2, 2018 | | October 18, 2018 | | $ | 0.42 |
|
June 20, 2018 | | July 2, 2018 | | July 18, 2018 | | $ | 0.40 |
|
March 15, 2018 | | March 29, 2018 | | April 18, 2018 | | $ | 0.38 |
|
December 18, 2017 | | December 29, 2017 | | January 18, 2018 | | $ | 0.38 |
|
September 18, 2017 | | September 29, 2017 | | October 18, 2017 | | $ | 0.32 |
|
The following table summarizes dividends declared since our formation and their related tax characterization (per share amounts):
|
| | | | | | | | | | | | | | | | |
| | | | Tax Characterization of Dividends |
Year Ended December 31, | | Dividends Declared | | Ordinary Dividends (Non-Qualified) | | Qualified Ordinary Dividends | | Capital Gain Distribution |
2018 | | $ | 1.62 |
| | $ | 1.59 |
| | $ | — |
| | $ | 0.03 |
|
2017 | | $ | 0.70 |
| | $ | 0.70 |
| | $ | — |
| | $ | — |
|
Liquidity and Capital Resources
Liquidity is a measure of our ability to meet potential cash requirements, including ongoing commitments to repay borrowings, fund and maintain our target investments and operations, make distributions to our stockholders and other general business needs. We use cash to acquire our target investments, repay principal and interest on our borrowings, make distributions to our stockholders and fund our operations. Our primary sources of cash consist of unused borrowing capacity under our financing sources, securitizations, the net proceeds of future equity and debt offerings, payments of principal and interest we receive on our portfolio of assets and cash generated from our operating results. In the second quarter of 2018, we financed a pool of our commercial real estate loans through our first CLO securitization transaction. The net proceeds from the CLO issuance were used to repay a portion of the outstanding balances of our repurchase facilities, to re-invest in our target assets and for other general corporate purposes. We expect that our primary sources of financing will be, to the extent available to us, through (a) repurchase agreements and other types of credit facilities, (b) securitizations, (c) other sources of private financing, and (d) offerings of our equity or debt securities.
In the future, we may use other additional sources of financing to fund the origination or acquisition of our target investments, including other credit facilities, warehouse facilities, repurchase facilities and other secured and unsecured forms of borrowing. These financings may be collateralized or non-collateralized and may involve one or more lenders. We expect that these facilities will typically have maturities ranging from two to five years and may accrue interest at either fixed or floating rates. We may also finance our business through the non-recourse sale of senior loan interests.
We may also seek to raise further equity capital and issue additional debt securities in order to fund our future investments. We may also seek to enhance the returns on our commercial real estate loan portfolio through additional securitizations, if available.
On February 5, 2019, the Company closed an underwritten public offering of 6,850,000 shares of its common stock. The Company received total proceeds from the offering of approximately $130.0 million. In addition, the Company granted the underwriters a thirty-day option to purchase up to an additional 1,027,500 shares of its common stock.
As of December 31, 2018, we held $91.7 million in cash and cash equivalents available to support our operations; $3.2 billion of loans held-for-investment, AFS securities and HTM securities; and $2.5 billion of outstanding debt in the form of repurchase agreements, revolving credit facilities, securitized debt obligations and long-term unsecured convertible senior notes. During the three and twelve months ended December 31, 2018, our debt-to-equity ratio increased from 2.5:1.0 to 3.0:1.0
and from 2.0:1.0 to 3.0:1.0, respectively, predominantly driven by the origination of and increased financing on loans held-for-investment. We intend to use prudent amounts of leverage to increase potential returns to our stockholders. To that end, subject to maintaining our qualification as a REIT and our exclusion from registration under the Investment Company Act, we intend to use borrowings to fund the origination or acquisition of our target investments. Given current market conditions and our focus on senior floating-rate mortgage loans, we currently expect that such leverage will not exceed, on a debt-to-equity basis, a 3.5-to-1 ratio on a company basis. The amount of leverage we deploy for our target investments depends upon our assessment of a variety of factors, which may include the anticipated liquidity and price volatility of the investments in our portfolio, the potential for losses in our portfolio, the gap between the duration of our assets and liabilities, including hedges, the availability and cost of financing the investments, our opinion of the creditworthiness of our financing counterparties, the health of the U.S. economy and commercial real estate financing markets, our outlook for the level and volatility of interest rates, the slope of the yield curve, the credit quality of our investments, the collateral underlying our investments, and our outlook for investment spreads relative to LIBOR.
Our primary sources of liquidity include cash and cash equivalents. As of December 31, 2018, we held approximately $91.7 million in cash and cash equivalents. Potential additional sources of liquidity may be unused borrowing capacity on our unpledged commercial real estate loans held-for-investment. Obtaining such liquidity is at the discretion of our lending counterparties and may not be available to us when desired. Generally, unused borrowing capacity may be the result of our election not to utilize certain financing, as well as delays in the timing in which funding is provided for a specific investment. We monitor and forecast our available, or excess, liquidity on a daily basis. If borrowing rates and/or collateral requirements change in the near term, we believe we are subject to less earnings volatility than a more leveraged organization.
During the year ended December 31, 2018, we did not experience any restrictions to our funding sources, although balance sheet capacity of counterparties has tightened due to compliance with the Basel III regulatory capital reform rules as well as management of perceived risk in the volatile interest rate environment. We expect ongoing sources of financing to be primarily repurchase agreements, revolving credit facilities, securitizations, convertible notes, issuance of common stock, potential additional securitizations and similar financing arrangements. We will continue to explore other types of funding facilities to further diversify our financing sources. We plan to finance our assets with a moderate amount of leverage, the level of which may vary based upon the particular characteristics of our portfolio and market conditions.
As of December 31, 2018, we had repurchase agreements in place with five counterparties (lenders) and a revolving credit facility in place with one counterparty to finance loans held for investment, and two other asset-specific facilities to finance our CMBS, and we continue to evaluate additional counterparties to manage and reduce counterparty risk. Under our repurchase agreements and revolving credit facilities, we are required to pledge additional cash as collateral to our lenders when the estimated fair value of the existing pledged collateral under such agreements declines and such lenders, through a margin call, demand additional collateral. Such counterparties may make margin calls because of a perceived decline in the value of our assets collateralizing the repurchase agreements due to credit or market events, depending on the repurchase agreement or revolving credit facility. To cover a margin call, we may pledge additional cash. At maturity, any cash on deposit as collateral is generally applied against the repurchase agreement balance, thereby reducing the amount borrowed. Should the value of our assets suddenly decrease, significant margin calls on our repurchase agreements could result, causing an adverse change in our liquidity position.
An overview of our repurchase and revolving credit facilities that provide short- and long-term financing for our loans held-for-investment is presented in the table below:
|
| | | | | | | | | | | | | | | |
| December 31, 2018 |
(in thousands) | Expiration Date (1) | | Committed | | Amount Outstanding | | Unused Capacity | | Total Capacity |
Repurchase facilities: | | | | | | | | | |
Morgan Stanley Bank | June 28, 2020 | | No | | $ | 475,474 |
| | $ | 124,526 |
| | $ | 600,000 |
|
JPMorgan Chase Bank | June 28, 2019 | | No | | $ | 455,900 |
| | $ | 44,100 |
| | $ | 500,000 |
|
Goldman Sachs Bank | May 2, 2019 | | No | | $ | 251,785 |
| | $ | 248,215 |
| | $ | 500,000 |
|
Citibank | June 28, 2020 | | No | | $ | 182,991 |
| | $ | 67,009 |
| | $ | 250,000 |
|
Wells Fargo Bank (2) | June 28, 2019 | | No | | $ | 108,540 |
| | $ | 91,460 |
| | $ | 200,000 |
|
Revolving credit facilities: | | | | | | | | | |
Citibank (3) | April 13, 2020 | | No | | $ | 75,000 |
| | $ | 30,000 |
| | $ | 105,000 |
|
____________________
| |
(1) | The facilities are set to mature on the stated expiration date, unless extended pursuant to their terms. |
| |
(2) | We retain an option to increase the maximum facility capacity amount up to $475 million, subject to customary terms and conditions. |
| |
(3) | The facility was temporarily upsized from $75 million to $105 million at December 31, 2018. |
We are subject to a variety of financial covenants under our lending agreements. The following represent the most restrictive financial covenants across the agreements as of December 31, 2018:
| |
• | Unrestricted cash cannot be less than the greater of $30.0 million and 5.0% of recourse indebtedness. As of December 31, 2018, our unrestricted cash, as defined, was $91.7 million, while 5.0% of our recourse indebtedness, as defined, was $39.3 million. |
| |
• | Tangible net worth must be greater than the sum of 75.0% of tangible net worth as of June 28, 2017 and 75.0% of net cash proceeds of additional equity issuances, which calculates to $626.5 million. As of December 31, 2018, our tangible net worth, as defined, was $827.5 million. |
| |
• | Target asset leverage ratio cannot exceed 75.0% and our total leverage ratio cannot exceed 80.0%. As of December 31, 2018, our target asset leverage ratio, as defined, was 69.5% and our total leverage ratio, as defined, was 75.4%. |
| |
• | Minimum interest coverage must be greater than 1.5:1.0. As of December 31, 2018, our minimum interest coverage, as defined, was 1.9:1.0. |
We may also be subject to additional financial covenants in connection with various other agreements we enter into in the normal course of our business. We intend to continue to operate in a manner which complies with all of our financial covenants.
The following table summarizes assets at carrying values that were pledged or restricted as collateral for the future payment obligations of repurchase agreements, revolving credit facilities and securitized debt obligations as of December 31, 2018 and December 31, 2017:
|
| | | | | | | |
(in thousands) | December 31,
2018 | | December 31,
2017 |
Loans held-for-investment | $ | 2,807,810 |
| | $ | 2,202,049 |
|
Available-for-sale securities, at fair value | 12,606 |
| | 12,798 |
|
Held-to-maturity securities | 26,696 |
| | 42,169 |
|
Restricted cash | 2,922 |
| | 565 |
|
Total | $ | 2,850,034 |
| | $ | 2,257,581 |
|
Although we generally intend to hold our target assets as long-term investments, we may sell certain of our assets in order to manage our liquidity needs, to meet other operating objectives and to adapt to market conditions. Commercial real estate loans are subject to longer trade timelines than securities and, as a result, market conditions could significantly and adversely affect the liquidity of our assets. Any illiquidity of our assets may make it difficult for us to sell such assets if the need or desire arises. Our ability to quickly sell certain assets may be limited by delays due to the time period needed for negotiating transaction documents and conducting diligence. Consequently, even if we identify a buyer for our commercial real estate loans, there is no assurance that we would be able to quickly sell such assets if the need or desire arises.
In addition, if we are required to liquidate all or a portion of our portfolio quickly, we may realize significantly less than the value at which we previously recorded our assets. Assets that are illiquid are more difficult to finance, and to the extent that we use leverage to finance assets that become illiquid, we may lose that leverage or have it reduced. Assets tend to become less liquid during times of financial stress, which is often the time that liquidity is most needed. As a result, our ability to sell assets or vary our portfolio in response to changes in economic and other conditions may be limited by liquidity constraints, which could adversely affect our results of operations and financial condition.
We cannot predict the timing and impact of future sales of our assets, if any. Because many of our assets are financed with repurchase agreements and revolving credit facilities, a significant portion of the proceeds from sales of our assets (if any), prepayments and scheduled amortization would be used to repay balances under these financing sources.
The following table provides the maturities of our repurchase agreements, revolving credit facilities, securitized debt obligations and convertible senior notes as of December 31, 2018 and December 31, 2017:
|
| | | | | | | |
(in thousands) | December 31,
2018 | | December 31,
2017 |
Within 30 days | $ | — |
| | $ | 22,032 |
|
30 to 59 days | 25,854 |
| | 34,514 |
|
60 to 89 days | — |
| | — |
|
90 to 119 days | 36,371 |
| | — |
|
120 to 364 days | 874,317 |
| | — |
|
One year and over | 1,293,264 |
| | 1,465,062 |
|
Three to five years | 268,138 |
| | 121,314 |
|
Five to ten years | — |
| | — |
|
Ten years and over | — |
| | — |
|
Total | $ | 2,497,944 |
| | $ | 1,642,922 |
|
For the year ended December 31, 2018, our restricted and unrestricted cash balance increased approximately $12.7 million to $123.4 million at December 31, 2018. The cash movements can be summarized by the following:
| |
• | Cash flows from operating activities. For the year ended December 31, 2018, operating activities increased our cash balances by approximately $57.4 million, primarily driven by our financial results for the year. |
| |
• | Cash flows from investing activities. For the year ended December 31, 2018, investing activities decreased our cash balances by approximately $835.3 million, primarily driven by originations of loans held-for-investment, offset by repayments of loans held-for-investment and held-to-maturity securities. |
| |
• | Cash flows from financing activities. For the year ended December 31, 2018, financing activities increased our cash balance by approximately $790.6 million, primarily driven by net proceeds from revolving credit facilities, securitized debt obligations and the issuance of convertible senior notes, offset by the payment of the common stock dividends. |
Off-Balance Sheet Arrangements
We have not participated in transactions that create relationships with unconsolidated entities or financial partnerships which would have been established for the purpose of facilitating off-balance sheet arrangements. Further, we have not guaranteed any obligations of unconsolidated entities or entered into any commitment or intent to provide funding to any such entities. However, as of December 31, 2018, we had unfunded commitments on commercial real estate loans held-for-investment of $626.2 million to be used for future fundings to borrowers, generally to finance lease-related or capital expenditures.
Aggregate Contractual Obligations
The following table summarizes the effect on our liquidity and cash flows from contractual obligations for repurchase agreements, convertible senior notes, revolving credit facilities, interest expense on borrowings, our non-cancelable office leases, management fees payable under our management agreement and unfunded commitments on commercial mortgage loans held-for-investment:
|
| | | | | | | | | | | | | | | | | | | | | | | | | | | |
| Due During the Year Ended December 31, |
(in thousands) | 2019 | | 2020 | | 2021 | | 2022 | | 2023 | | Thereafter | | Total |
Repurchase agreements | $ | 842,078 |
| | $ | 658,465 |
| | $ | — |
| | $ | — |
| | $ | — |
| | $ | — |
| | $ | 1,500,543 |
|
Convertible senior notes | — |
| | — |
| | — |
| | 140,316 |
| | 127,822 |
| | — |
| | 268,138 |
|
Revolving credit facilities | — |
| | 75,000 |
| | — |
| | — |
| | — |
| | — |
| | 75,000 |
|
Interest expense on borrowings (1) | 67,153 |
| | 32,223 |
| | 16,041 |
| | 15,393 |
| | 6,117 |
| | — |
| | 136,927 |
|
Long-term operating lease obligations | 694 |
| | 849 |
| | 849 |
| | 869 |
| | 896 |
| | 1,858 |
| | 6,015 |
|
Management fee (2) | 12,299 |
| | 43,203 |
| | — |
| | — |
| | — |
| | — |
| | 55,502 |
|
Unfunded commitments on loans held-for-investment (3) | 148,717 |
| | 337,095 |
| | 140,343 |
| | — |
| | — |
| | — |
| | 626,155 |
|
Total | $ | 1,070,941 |
| | $ | 1,146,835 |
| | $ | 157,233 |
| | $ | 156,578 |
| | $ | 134,835 |
| | $ | 1,858 |
| | $ | 2,668,280 |
|
____________________
| |
(1) | Interest expense on repurchase agreements, convertible senior notes and revolving credit facilities calculated based on rates at December 31, 2018. |
| |
(2) | Contractual obligation for the management fee is estimated through the contract expiration date of June 28, 2020, inclusive of the termination fee as defined in the management agreement between us and our Manager. Disclosure assumes the agreement is not renewed or terminated without cause. |
| |
(3) | Allocation of unfunded commitments on loans held-for-investment is based on the earlier of the commitment expiration date or the loan maturity date. |
We are party to a management agreement with our Manager, pursuant to which our Manager is entitled to receive a management fee and the reimbursement of certain expenses from us. We reimburse our Manager for (i) our allocable share of the compensation paid by our Manager to its personnel serving as our chief operating officer, principal financial officer and general counsel and personnel employed by our Manager as in-house legal, tax, accounting, consulting, auditing, administrative, information technology, valuation, computer programming and development and back-office resources to us, and (ii) any amounts for personnel of our Manager’s affiliates arising under a shared facilities and services agreement. We also have certain costs allocated to us by our Manager for data services and technology, but most direct expenses with third-party vendors are paid directly by us.
We are also party to contracts that contain a variety of indemnification obligations, including with brokers and underwriters. The maximum potential future payment amount we could be required to pay under these indemnification obligations may be unlimited.
Recently Issued Accounting Standards
Refer to Note 2 of the notes to the consolidated financial statements included in Item 8 of this Annual Report on Form 10-K.
Inflation
Virtually all of our assets and liabilities are interest rate sensitive in nature. As a result, interest rates and other factors influence our performance far more so than does inflation. Changes in interest rates do not necessarily correlate with inflation rates or changes in inflation rates. Our financial statements are prepared in accordance with U.S. GAAP and our distributions will be determined by our board of directors consistent with our obligation to distribute to our stockholders at least 90% of our REIT taxable income on an annual basis in order to maintain our REIT qualification; in each case, our activities and balance sheet are measured with reference to historical cost and/or fair market value without considering inflation.
Other Matters
We intend to conduct our business so as to maintain our exempt status under, and not to become regulated as, an investment company for purposes of the Investment Company Act. If we failed to maintain our exempt status under the Investment Company Act and became regulated as an investment company, our ability to, among other things, use leverage would be substantially reduced and, as a result, we would be unable to conduct our business as described in Item 1, “Business - Our Business - Operating and Regulatory Structure” of this Annual Report on Form 10-K. Accordingly, we monitor our compliance with both the 55% Test and the 80% Tests of the Investment Company Act in order to maintain our exempt status. As of December 31, 2018, we determined that we maintained compliance with both the 55% Test and the 80% Test requirements.
We calculate that at least 75% of our assets were qualified REIT assets, as defined in the Code for the year ended December 31, 2018. We also calculate that our revenue qualifies for the 75% source of income test and for the 95% source of income test rules for the year ended December 31, 2018. Consequently, we met the REIT income and asset tests. We also met all REIT requirements regarding the ownership of our common stock and the distribution of our net income. Therefore, for the year ended December 31, 2018, we believe that we qualified as a REIT under the Code.
The Protecting Americans from Tax Hikes Act of 2015 contains changes to certain aspects of the U.S. federal income tax rules applicable to REITs. In particular, the act reduced the maximum allowable value of assets attributable to our TRSs from 25% to 20%, which is applicable with respect to tax years beginning after December 31, 2017. We currently monitor our compliance with this TRS asset test and, in light of this change, we intend to continue to meet the requirement.
The Tax Cuts and Jobs Act of 2017 (“TCJA”) made many significant changes to the U.S. federal income tax laws applicable to businesses, including REITs and taxable REIT subsidiaries. Pursuant to the TCJA, as of January 1, 2018, the federal income tax rate applicable to corporations was reduced to 21% and the corporate alternative minimum tax was repealed. In addition, the deduction of net interest expense is limited for all businesses; provided that certain businesses, including real estate businesses, may elect not to be subject to such limitations and instead to depreciate their real property related assets over longer depreciable lives. This limitation could adversely affect our taxable REIT subsidiaries.
Additional changes to the tax laws are likely to continue to occur, and we intend to continue to monitor such changes.
Item 7A. Quantitative and Qualitative Disclosures about Market Risk
We seek to manage our risks related to the credit quality of our investments, interest rates, liquidity and market value while, at the same time, seeking to generate attractive risk-adjusted returns to our stockholders. While we are exposed to certain types of market risk in our business, we seek to actively manage them and rely on our Manager’s sophisticated risk management infrastructure and philosophy centered around quantifying and measuring various market risks on a continuous basis. We seek to be fairly compensated through the returns we earn on our investments for taking those risks and focus on maintaining liquidity and capital levels consistent with the risks to which we are exposed.
Credit Risk
We are subject to varying degrees of credit risk in connection with holding a portfolio of our target investments. The performance and value of our investments depend upon the sponsors’ ability to operate the properties that serve as our collateral so that they produce cash flows adequate to pay interest and principal due to us. We seek to manage credit risk by performing deep fundamental credit analysis of our potential investments. Credit risk is also addressed through our on-going review, and our investment portfolio is monitored for variance from expected defaults, severities, losses and cash flow on a monthly basis, with more intense analysis and oversight done on a quarterly basis.
Interest Rate Risk
Generally, the composition of our investments is such that rising interest rates increase our net income, while declining interest rates decrease net income. As of December 31, 2018, approximately 98.3% of our portfolio by carrying value earned a floating rate of interest. The remaining approximately 1.7% of our portfolio earns a fixed rate of interest. If interest rates were to decline, the value of these fixed-rate investments may increase and if interest rates were to increase, the value of these fixed-rate investments may fall; however, the interest income generated by these investments would not be affected by market interest rate fluctuations. The interest rates we pay under our repurchase agreements and securitized debt obligations are primarily floating rate. Accordingly, our interest expense generally increases as interest rates increase and decreases as interest rates decrease.
Our analysis of risks is based on our experience, estimates, models and assumptions. These analyses rely on models which utilize estimates of fair value and interest rate sensitivity. Actual economic conditions or our implementation of decisions may produce results that differ significantly from the estimates and assumptions used in our models.
The information presented in the following interest rate sensitivity table projects the potential impact of sudden parallel changes in interest rates on our financial results and financial condition over the next 12 months, based on our interest sensitive financial instruments at December 31, 2018. All changes in value are measured as the change from our December 31, 2018 financial position. All projected changes in annualized net interest income are measured as the change from our projected annualized net interest income based off current performance returns.
|
| | | | | | | | | | | | | | | |
| Changes in Interest Rates |
(in thousands) | -100 bps | | -50 bps | | +50 bps | | +100 bps |
Change in value of financial position: | | | | | | | |
Loans held-for-investment | $ | 1,165 |
| | $ | 646 |
| | $ | (649 | ) | | $ | (1,298 | ) |
Available-for-sale securities | 5 |
| | 3 |
| | (3 | ) | | (5 | ) |
Held-to-maturity securities | 11 |
| | 6 |
| | (6 | ) | | (11 | ) |
Repurchase agreements | (647 | ) | | (323 | ) | | 323 |
| | 647 |
|
Securitized debt obligations | (275 | ) | | (138 | ) | | 138 |
| | 275 |
|
Convertible senior notes | (9,612 | ) | | (4,751 | ) | | 4,643 |
| | 9,182 |
|
Total net assets | $ | (9,353 | ) | | $ | (4,557 | ) | | $ | 4,446 |
| | $ | 8,790 |
|
| | | | | | | |
| -100 bps | | -50 bps | | +50 bps | | +100 bps |
Change in annualized net interest income: | $ | (6,697 | ) | | $ | (4,826 | ) | | $ | 4,894 |
| | $ | 9,788 |
|
The interest rate sensitivity table quantifies the potential changes in annualized net interest income and portfolio value, should interest rates immediately change. The interest rate sensitivity table presents the estimated impact of interest rates instantaneously rising 50 and 100 basis points, and falling 50 and 100 basis points. The cash flows associated with the portfolio for each rate change are calculated based on assumptions, including yield on future originations and acquisitions, slope of the yield curve, and size of the portfolio. Assumptions made on the interest rate sensitive liabilities include anticipated interest rates, collateral requirements as a percentage of borrowings and amount and term of borrowing.
Certain assumptions have been made in connection with the calculation of the information set forth in the foregoing interest rate sensitivity table and, as such, there can be no assurance that assumed events will occur or that other events will not occur that would affect the outcomes. The base interest rate scenario assumes interest rates at December 31, 2018. The analysis utilizes assumptions and estimates based on management’s judgment and experience. Furthermore, while we generally expect to retain such assets and the associated interest rate risk to maturity, future originations, acquisitions and sales of assets could materially change our interest rate risk profile.
The information set forth in the interest rate sensitivity table above and all related disclosures constitutes forward-looking statements within the meaning of Section 27A of the Securities Act and Section 21E of the Exchange Act. Actual results could differ significantly from those estimated in the foregoing interest rate sensitivity table.
Borrower Performance
In addition to the risks related to fluctuations in cash flows and investment values associated with movements in interest rates, there is also the risk of borrower non-performance on our floating-rate investments. If interest rates were to significantly rise, it is possible that the increased debt service costs may negatively impact operating cash flows on properties securing our commercial real estate loan investments, resulting in potential non-performance of our borrowers. This risk is partially mitigated by various facts we consider during our rigorous underwriting process, which in certain cases include a requirement for our borrower to purchase an interest rate cap contract. As of December 31, 2018, none of the commercial real estate loans in our portfolio were non-performing.
Capital Markets Risk
As a REIT, we are required to distribute a significant portion of our taxable income annually, which constrains our ability to accumulate significant operating cash flow and therefore requires us to utilize capital markets, both debt and equity, to finance our business. As a result, we are exposed to risks related to the capital markets and our related ability to raise capital through the issuance of our common stock or other equity instruments. We are also exposed to risks related to the debt capital markets, and our related ability to finance our business through borrowings under credit facilities or other debt instruments, such as securitizations or unsecured debt. We seek to mitigate these risks by monitoring the debt and equity capital markets to inform our decisions on the amount, timing, and terms of capital we raise.
Real Estate Risk
Our business strategy focuses on commercial real estate related debt investments. As a result, we will be exposed to the risks generally associated with the commercial real estate market, including occupancy rates, capitalization rates, absorption rates, and other macroeconomic factors beyond our control.
Additionally, commercial real estate debt investments may be affected by a number of factors, including, national, regional and local economic and real estate conditions, changes in business trends of specific industry segments, property construction characteristics, demographic factors, and changes to building codes. Any combination of these factors may affect the value of real estate collateral for investments within our investment portfolio and the potential proceeds available to a borrower to repay the underlying loans, which could cause us to suffer losses. We seek to manage these risks through our rigorous and fundamentally driven underwriting and investment management processes.
Liquidity Risk
Our liquidity risk is principally associated with our financing of longer-maturity investments with shorter-term borrowings in the form of repurchase agreements and revolving credit facilities. Should the value of our investments pledged as collateral on our repurchase agreements significantly decrease, our lenders may exercise their margin call rights, causing an adverse change in our liquidity position. Additionally, if one or more of our repurchase agreement and revolving credit facility counterparties chose not to provide ongoing funding, our ability to finance our investments would decline or exist at possibly less advantageous terms. As such, we cannot assure you that we will always be able to roll over our repurchase agreements or other sources of financing which require us to renew them on a periodic basis.
Risk Management
To the extent consistent with maintaining our REIT qualification, we seek to manage risk exposure by closely monitoring our portfolio and actively managing the financing, interest rate, credit, and other risks associated with holding a portfolio of our target investments. Generally, with the guidance and experience of our Manager:
| |
• | we manage our portfolio with focus on diligent, investment-specific market review, enforcement of loan and security rights, and timely execution of disposition strategies; |
| |
• | we actively employ portfolio-wide and investment-specific risk measurement and management processes in our daily operations, including utilizing our Manager’s risk management tools; and |
| |
• | we seek to manage credit risk through our rigorous underwriting due diligence process prior to origination or acquisition of our target investments and through the use of non-recourse financing, when and where available and appropriate. |
Item 8. Financial Statements and Supplementary Data
GRANITE POINT MORTGAGE TRUST INC.
INDEX TO CONSOLIDATED FINANCIAL STATEMENTS AND SCHEDULES
Report of Independent Registered Public Accounting Firm
To the Stockholders and the Board of Directors
of Granite Point Mortgage Trust Inc.
Opinion on the Financial Statements
We have audited the accompanying consolidated balance sheets of Granite Point Mortgage Trust Inc. (the Company) as of December 31, 2018 and 2017, the related consolidated statements of comprehensive income, stockholders’ equity and cash flows for each of the three years in the period ended December 31, 2018, and the related notes and financial statement schedule listed in the Index at Item 15(a) (collectively referred to as the “consolidated financial statements”). In our opinion, the consolidated financial statements present fairly, in all material respects, the financial position of the Company at December 31, 2018 and 2017, and the results of its operations and its cash flows for each of the three years in the period ended December 31, 2018, in conformity with U.S. generally accepted accounting principles.
We also have audited, in accordance with the standards of the Public Company Accounting Oversight Board (United States) (PCAOB), the Company’s internal control over financial reporting as of December 31, 2018, based on criteria established in Internal Control-Integrated Framework issued by the Committee of Sponsoring Organizations of the Treadway Commission (2013 framework) and our report dated February 27, 2019 expressed an unqualified opinion thereon.
Basis for Opinion
These financial statements are the responsibility of the Company’s management. Our responsibility is to express an opinion on the Company’s financial statements based on our audits. We are a public accounting firm registered with the PCAOB and are required to be independent with respect to the Company in accordance with the U.S. federal securities laws and the applicable rules and regulations of the Securities and Exchange Commission and the PCAOB.
We conducted our audits in accordance with the standards of the PCAOB. Those standards require that we plan and perform the audit to obtain reasonable assurance about whether the financial statements are free of material misstatement, whether due to error or fraud. Our audits included performing procedures to assess the risks of material misstatement of the financial statements, whether due to error or fraud, and performing procedures that respond to those risks. Such procedures included examining, on a test basis, evidence regarding the amounts and disclosures in the financial statements. Our audits also included evaluating the accounting principles used and significant estimates made by management, as well as evaluating the overall presentation of the financial statements. We believe that our audits provide a reasonable basis for our opinion.
/s/ Ernst & Young LLP
We have served as the Company’s auditor since 2017.
Minneapolis, Minnesota
February 27, 2019
GRANITE POINT MORTGAGE TRUST INC.
CONSOLIDATED BALANCE SHEETS
(in thousands, except share data)
|
| | | | | | | |
| December 31,
2018 | | December 31,
2017 |
ASSETS | | | |
Loans held-for-investment | $ | 3,167,913 |
| | $ | 2,304,266 |
|
Available-for-sale securities, at fair value | 12,606 |
| | 12,798 |
|
Held-to-maturity securities | 26,696 |
| | 42,169 |
|
Cash and cash equivalents | 91,700 |
| | 107,765 |
|
Restricted cash | 31,723 |
| | 2,953 |
|
Accrued interest receivable | 10,268 |
| | 7,105 |
|
Deferred debt issuance costs | 3,924 |
| | 8,872 |
|
Prepaid expenses | 1,055 |
| | 390 |
|
Other assets | 15,996 |
| | 12,812 |
|
Total Assets (1) | $ | 3,361,881 |
| | $ | 2,499,130 |
|
LIABILITIES AND STOCKHOLDERS’ EQUITY | | | |
Liabilities | | | |
Repurchase agreements | $ | 1,500,543 |
| | $ | 1,521,608 |
|
Securitized debt obligations | 654,263 |
| | — |
|
Revolving credit facilities | 75,000 |
| | — |
|
Convertible senior notes | 268,138 |
| | 121,314 |
|
Accrued interest payable | 6,394 |
| | 3,119 |
|
Unearned interest income | 510 |
| | 197 |
|
Dividends payable | 18,346 |
| | 16,454 |
|
Other liabilities | 10,156 |
| | 6,817 |
|
Total Liabilities | 2,533,350 |
| | 1,669,509 |
|
10% cumulative redeemable preferred stock, par value $0.01 per share; 50,000,000 shares authorized and 1,000 and 1,000 shares issued and outstanding, respectively | 1,000 |
| | 1,000 |
|
Stockholders’ Equity | | | |
Common stock, par value $0.01 per share; 450,000,000 shares authorized and 43,621,174 and 43,235,103 shares issued and outstanding, respectively | 436 |
| | 432 |
|
Additional paid-in capital | 836,288 |
| | 829,704 |
|
Accumulated other comprehensive loss | (192 | ) | | — |
|
Cumulative earnings | 91,875 |
| | 28,800 |
|
Cumulative distributions to stockholders | (100,876 | ) | | (30,315 | ) |
Total Stockholders’ Equity | 827,531 |
| | 828,621 |
|
Total Liabilities and Stockholders’ Equity | $ | 3,361,881 |
| | $ | 2,499,130 |
|
____________________
| |
(1) | consolidated balance sheets include assets of consolidated variable interest entities, or VIEs, that can only be used to settle obligations of these VIEs, and liabilities of the consolidated VIEs for which creditors do not have recourse to Granite Point Mortgage Trust Inc. At December 31, 2018 and December 31, 2017, assets of the VIEs totaled $829,147 and $46,068, and liabilities of the VIEs totaled $654,952 and $0, respectively. See Note 3 - Variable Interest Entities for additional information. |
The accompanying notes are an integral part of these consolidated financial statements.
GRANITE POINT MORTGAGE TRUST INC.
CONSOLIDATED STATEMENTS OF COMPREHENSIVE INCOME
(in thousands, except share data)
|
| | | | | | | | | | | |
| Year Ended |
| December 31, |
| 2018 | | 2017 | | 2016 |
Interest income: | |
Loans held-for-investment | $ | 179,284 |
| | $ | 113,050 |
| | 55,627 |
|
Available-for-sale securities | 1,160 |
| | 1,035 |
| | 1,002 |
|
Held-to-maturity securities | 3,194 |
| | 3,726 |
| | 4,192 |
|
Cash and cash equivalents | 242 |
| | 26 |
| | 7 |
|
Total interest income | 183,880 |
| | 117,837 |
| | 60,828 |
|
Interest expense: | | | | | |
Repurchase agreements | 62,432 |
| | 37,968 |
| | 8,611 |
|
Securitized debt obligations | 17,660 |
| | — |
| | — |
|
Convertible senior notes | 10,783 |
| | 397 |
| | — |
|
Revolving credit facilities | 648 |
| | — |
| | — |
|
Note payable to affiliate | — |
| | 4,098 |
| | 2,418 |
|
Total interest expense | 91,523 |
| | 42,463 |
| | 11,029 |
|
Net interest income | 92,357 |
| | 75,374 |
| | 49,799 |
|
Other income: | | | | | |
Fee income | 1,446 |
| | — |
| | 203 |
|
Total other income | 1,446 |
| | — |
| | 203 |
|
Expenses: | | | | | |
Management fees | 12,509 |
| | 9,737 |
| | 7,173 |
|
Servicing expenses | 2,196 |
| | 1,354 |
| | 605 |
|
Other operating expenses | 16,025 |
| | 10,982 |
| | 6,878 |
|
Total expenses | 30,730 |
| | 22,073 |
| | 14,656 |
|
Income before income taxes | 63,073 |
| | 53,301 |
| | 35,346 |
|
Benefit from income taxes | (2 | ) | | (4 | ) | | (11 | ) |
Net income | 63,075 |
| | 53,305 |
| | 35,357 |
|
Dividends on preferred stock | 100 |
| | 50 |
| | — |
|
Net income attributable to common stockholders | $ | 62,975 |
| | $ | 53,255 |
| | $ | 35,357 |
|
Basic earnings per weighted average common share (See Note 19) | $ | 1.45 |
| | $ | 0.60 |
| | $ | — |
|
Diluted earnings per weighted average common share (See Note 19) | $ | 1.42 |
| | $ | 0.60 |
| | $ | — |
|
Dividends declared per common share | $ | 1.62 |
| | $ | 0.70 |
| | $ | — |
|
Weighted average number of shares of common stock outstanding: | | | | | |
Basic weighted average number of shares of common stock outstanding | 43,445,384 |
| | 43,234,671 |
| | — |
|
Diluted weighted average number of shares of common stock outstanding | 52,039,997 |
| | 43,234,671 |
| | — |
|
Comprehensive income: | | | | | |
Net income attributable to common stockholders | $ | 62,975 |
| | $ | 53,255 |
| | $ | 35,357 |
|
Other comprehensive (loss) income, net of tax: | | | | | |
Unrealized (loss) gain on available-for-sale securities | (192 | ) | | 112 |
| | (112 | ) |
Other comprehensive (loss) income | (192 | ) | | 112 |
| | (112 | ) |
Comprehensive income attributable to common stockholders | $ | 62,783 |
| | $ | 53,367 |
| | $ | 35,245 |
|
The accompanying notes are an integral part of these consolidated financial statements.
GRANITE POINT MORTGAGE TRUST INC.
CONSOLIDATED STATEMENTS OF STOCKHOLDERS’ EQUITY
(in thousands, except share data)
|
| | | | | | | | | | | | | | | | | | | | | | | | | | |
| Common Stock | | | | | | | | | | |
| Shares | | Amount | | Additional Paid-in Capital | | Accumulated Other Comprehensive (Loss) Income | | Cumulative Earnings | | Cumulative Distributions to Stockholders | | Total Stockholders’ Equity |
| | | | | | | | | | | | | |
Balance, December 31, 2015 | — |
| | $ | — |
| | $ | 486,804 |
| | $ | — |
| | $ | 138 |
| | $ | — |
| | $ | 486,942 |
|
Capital contributions from Two Harbors Investment Corp. | — |
| | — |
| | 10,000 |
| | — |
| | — |
| | — |
| | 10,000 |
|
Distributions to Two Harbors Investment Corp. | — |
| | — |
| | (104,196 | ) | | — |
| | — |
| | — |
| | (104,196 | ) |
Net income | — |
| | — |
| | — |
| | — |
| | 35,357 |
| | — |
| | 35,357 |
|
Other comprehensive loss before reclassifications, net of tax | — |
| | — |
| | — |
| | (112 | ) | | — |
| | — |
| | (112 | ) |
Amounts reclassified from accumulated other comprehensive income, net of tax | — |
| | — |
| | — |
| | — |
| | — |
| | — |
| | — |
|
Net other comprehensive loss, net of tax | — |
| | — |
| | — |
| | (112 | ) | | — |
| | — |
| | (112 | ) |
Balance, December 31, 2016 | — |
| | $ | — |
| | $ | 392,608 |
| | $ | (112 | ) | | $ | 35,495 |
| | $ | — |
| | $ | 427,991 |
|
Capital contributions from Two Harbors Investment Corp. | — |
| | — |
| | 254,785 |
| | — |
| | — |
| | — |
| | 254,785 |
|
Distributions to Two Harbors Investment Corp. | — |
| | — |
| | (308 | ) | | — |
| | (60,000 | ) | | — |
| | (60,308 | ) |
Net income | — |
| | — |
| | — |
| | — |
| | 53,305 |
| | — |
| | 53,305 |
|
Other comprehensive income before reclassifications | — |
| | — |
| | — |
| | 112 |
| | — |
| | — |
| | 112 |
|
Amounts reclassified from accumulated other comprehensive income | — |
| | — |
| | — |
| | — |
| | — |
| | — |
| | — |
|
Net other comprehensive income | — |
| | — |
| | — |
| | 112 |
| | — |
| | — |
| | 112 |
|
Issuance of common stock, net of offering costs | 43,071,000 |
| | 431 |
| | 181,533 |
| | — |
| | — |
| | — |
| | 181,964 |
|
Common dividends declared | — |
| | — |
| | — |
| | — |
| | — |
| | (30,265 | ) | | (30,265 | ) |
Preferred dividends declared | — |
| | — |
| | — |
| | — |
| | — |
| | (50 | ) | | (50 | ) |
Non-cash equity award compensation | 164,103 |
| | 1 |
| | 1,086 |
| | — |
| | — |
| | — |
| | 1,087 |
|
Balance, December 31, 2017 | 43,235,103 |
| | $ | 432 |
| | $ | 829,704 |
| | $ | — |
| | $ | 28,800 |
| | $ | (30,315 | ) | | $ | 828,621 |
|
Net income | — |
| | — |
| | — |
| | — |
| | 63,075 |
| | — |
| | 63,075 |
|
Other comprehensive loss before reclassifications | — |
| | — |
| | — |
| | (192 | ) | | — |
| | — |
| | (192 | ) |
Amounts reclassified from accumulated other comprehensive income | — |
| | — |
| | — |
| | — |
| | — |
| | — |
| | — |
|
Net other comprehensive loss | — |
| | — |
| | — |
| | (192 | ) | | — |
| | — |
| | (192 | ) |
Issuance of common stock, net of offering costs | 164,940 |
| | 2 |
| | 3,090 |
| | — |
| | — |
| | — |
| | 3,092 |
|
Common dividends declared | — |
| | — |
| | — |
| | — |
| | — |
| | (70,461 | ) | | (70,461 | ) |
Preferred dividends declared | — |
| | — |
| | — |
| | — |
| | — |
| | (100 | ) | | (100 | ) |
Non-cash equity award compensation | 221,131 |
| | 2 |
| | 3,494 |
| | — |
| | — |
| | — |
| | 3,496 |
|
Balance, December 31, 2018 | 43,621,174 |
| | $ | 436 |
| | $ | 836,288 |
| | $ | (192 | ) | | $ | 91,875 |
| | $ | (100,876 | ) | | $ | 827,531 |
|
The accompanying notes are an integral part of these consolidated financial statements.
GRANITE POINT MORTGAGE TRUST INC.
CONSOLIDATED STATEMENTS OF CASH FLOWS
(in thousands)
|
| | | | | | | | | | | |
| Year Ended |
| December 31, |
| 2018 | | 2017 | | 2016 |
Cash Flows From Operating Activities: | | | |
Net income | $ | 63,075 |
| | $ | 53,305 |
| | $ | 35,357 |
|
Adjustments to reconcile net income to net cash provided by operating activities: | | | | | |
|
Accretion of discounts and net deferred fees on loans held-for-investment | (12,852 | ) | | (7,963 | ) | | (7,244 | ) |
Amortization of deferred debt issuance costs on convertible senior notes and securitized debt obligations | 3,785 |
| | 4,573 |
| | 1,375 |
|
Equity based compensation | 3,496 |
| | 1,087 |
| | — |
|
Depreciation of fixed assets | 19 |
| | — |
| | — |
|
Net change in assets and liabilities: | | | | | |
Increase in accrued interest receivable | (3,163 | ) | | (3,360 | ) | | (2,178 | ) |
Increase in prepaid expenses | (665 | ) | | (390 | ) | | — |
|
Increase in other assets | (3,203 | ) | | (5,072 | ) | | (5,431 | ) |
Increase in accrued interest payable | 3,275 |
| | 2,464 |
| | 582 |
|
Increase (decrease) in unearned interest income | 313 |
| | 54 |
| | (12 | ) |
Increase in income taxes payable | — |
| | — |
| | (70 | ) |
(Decrease) increase in other payables to affiliates | — |
| | (21,460 | ) | | 13,173 |
|
Increase (decrease) in other liabilities | 3,339 |
| | 6,258 |
| | (47 | ) |
Increase in 10% cumulative redeemable preferred stock | — |
| | 1,000 |
| | — |
|
Net cash provided by operating activities | 57,419 |
| | 30,496 |
| | 35,505 |
|
Cash Flows From Investing Activities: | | | | | |
Originations, acquisitions and additional fundings of loans held-for-investment, net of deferred fees | (1,319,529 | ) | | (1,032,478 | ) | | (775,731 | ) |
Proceeds from repayment of loans held-for-investment | 468,734 |
| | 100,466 |
| | 1,377 |
|
Principal payments on available-for-sale securities | — |
| | — |
| | 2,202 |
|
Principal payments on held-to-maturity securities | 15,473 |
| | 6,083 |
| | 15,008 |
|
Decrease (increase) in due from counterparties | — |
| | 249 |
| | (249 | ) |
Net cash used in investing activities | (835,322 | ) | | (925,680 | ) | | $ | (757,393 | ) |
The accompanying notes are an integral part of these consolidated financial statements.
GRANITE POINT MORTGAGE TRUST INC.
CONSOLIDATED STATEMENTS OF CASH FLOWS, continued
(in thousands)
|
| | | | | | | | | | | |
| Year Ended |
| December 31, |
| 2018 | | 2017 | | 2016 |
Cash Flows From Financing Activities: | | | | | |
Proceeds from repurchase agreements | 1,228,361 |
| | 1,735,685 |
| | 998,698 |
|
Principal payments on repurchase agreements | (1,249,426 | ) | | (665,244 | ) | | (606,880 | ) |
Proceeds from issuance of securitized debt obligations | 651,374 |
| | — |
| | — |
|
Proceeds from convertible senior notes | 145,928 |
| | 121,288 |
| | — |
|
Proceeds from revolving credit facilities | 124,394 |
| | — |
| | — |
|
Repayment of revolving credit facilities | (49,394 | ) | | — |
| | — |
|
Proceeds from note payable to affiliate | — |
| | 110,653 |
| | 437,888 |
|
Repayment of note payable to affiliate | — |
| | (704,285 | ) | | (11,518 | ) |
Decrease (increase) in deferred debt issuance costs | 4,948 |
| | (11,054 | ) | | (2,163 | ) |
Proceeds from issuance of common stock, net of offering costs | 3,092 |
| | 181,964 |
| | — |
|
Proceeds from capital contribution from Two Harbors Investment Corp. | — |
| | 254,785 |
| | 10,000 |
|
Payments for distributions of capital to Two Harbors Investment Corp. | — |
| | (60,308 | ) | | (104,196 | ) |
Dividends paid on preferred stock | (100 | ) | | (25 | ) | | — |
|
Dividends paid on common stock | (68,569 | ) | | (13,836 | ) | | — |
|
Net cash provided by financing activities | 790,608 |
| | 949,623 |
| | 721,829 |
|
Net increase (decrease) in cash, cash equivalents and restricted cash | 12,705 |
| | 54,439 |
| | (59 | ) |
Cash, cash equivalents, and restricted cash at beginning of period | 110,718 |
| | 56,279 |
| | 56,338 |
|
Cash, cash equivalents, and restricted cash at end of period | $ | 123,423 |
| | $ | 110,718 |
| | $ | 56,279 |
|
Supplemental Disclosure of Cash Flow Information: | | | | | |
Cash paid for interest | $ | 88,248 |
| | $ | 39,999 |
| | $ | 10,448 |
|
Cash (received) paid for taxes | $ | (5 | ) | | $ | (4 | ) | | $ | 64 |
|
Noncash Activities: | | | | | |
Acquisition of TH Commercial Holdings LLC from Two Harbors Investment Corp. in exchange for common and preferred shares (See Note 1) | $ | — |
| | $ | 651,000 |
| | $ | — |
|
Dividends declared but not paid at end of period | $ | 18,346 |
| | $ | 16,454 |
| | $ | — |
|
The accompanying notes are an integral part of these consolidated financial statements.
GRANITE POINT MORTGAGE TRUST INC.
Notes to the Consolidated Financial Statements
Note 1. Organization and Operations
Granite Point Mortgage Trust Inc., or the Company, is a Maryland corporation that focuses primarily on directly originating, investing in and managing senior floating-rate commercial mortgage loans and other debt and debt-like commercial real estate investments. The Company is externally managed by Pine River Capital Management L.P., or the Manager. The Company’s common stock is listed on the New York Stock Exchange, or NYSE, under the symbol “GPMT”.
The Company was incorporated on April 7, 2017 and commenced operations as a publicly traded company on June 28, 2017, upon completion of an initial public offering, or the IPO. Concurrently with the closing of the IPO, the Company completed a formation transaction, or the Formation Transaction, pursuant to which the Company acquired the equity interests in TH Commercial Holdings LLC, or the Predecessor, from Two Harbors Investment Corp., or Two Harbors, a publicly traded hybrid mortgage real estate investment trust (NYSE: TWO). In exchange, the Company issued 33,071,000 shares of its common stock, representing approximately 76.5% of its outstanding common stock after the IPO, and 1,000 shares of its 10% cumulative redeemable preferred stock to Two Harbors. Upon the completion of the Formation Transaction, the Predecessor became the Company’s wholly owned indirect subsidiary. On November 1, 2017, Two Harbors distributed to its common stockholders the 33,071,000 shares of the Company’s common stock it had acquired in connection with the Formation Transaction, allowing the Company’s market capitalization to be fully floating.
The Company has elected to be treated as a real estate investment trust, or REIT, as defined under the Internal Revenue Code of 1986, as amended, or the Code, for U.S. federal income tax purposes. As long as the Company continues to comply with a number of requirements under federal tax law and maintains its qualification as a REIT, the Company generally will not be subject to U.S. federal income taxes to the extent that the Company distributes its taxable income to its stockholders on an annual basis and does not engage in prohibited transactions. However, certain activities that the Company may perform may cause it to earn income which will not be qualifying income for REIT purposes. The Company has designated one of its subsidiaries as a taxable REIT subsidiary, or TRS, as defined in the Code, to engage in such activities.
Note 2. Basis of Presentation and Significant Accounting Policies
Consolidation and Basis of Presentation
The accompanying consolidated financial statements include the accounts of all subsidiaries; inter-company accounts and transactions have been eliminated. Certain prior period amounts have been reclassified to conform to the current period presentation. The accounting and reporting policies of the Company conform to U.S. generally accepted accounting principles, or U.S. GAAP.
All trust entities in which the Company holds investments that are considered VIEs for financial reporting purposes were reviewed for consolidation under the applicable consolidation guidance. Whenever the Company has both the power to direct the activities of a trust that most significantly impact the entities’ performance, and the obligation to absorb losses or the right to receive benefits of the entities that could be significant, the Company consolidates the trust.
Use of Estimates
The preparation of financial statements in conformity with U.S. GAAP requires management to make a number of significant estimates. These include estimates of fair value of certain assets and liabilities, amount and timing of allowances for loan losses and impairments and other estimates that affect the reported amounts of certain assets and liabilities as of the date of the consolidated financial statements and the reported amounts of certain revenues and expenses during the reported period. It is likely that changes in these estimates (e.g., valuation changes to the underlying collateral of loans due to changes in capitalization rates, leasing, credit worthiness of major tenants, occupancy rates, availability of financing, exit plan, loan sponsorship, actions of other lenders, overall economic conditions, the broader commercial real estate market, local geographic sub-markets or other factors) will occur in the near term. The Company’s estimates are inherently subjective in nature and actual results could differ from its estimates and the differences may be material.
GRANITE POINT MORTGAGE TRUST INC.
Notes to the Consolidated Financial Statements
Significant Accounting Policies
Formation Transaction
On June 28, 2017, the Company completed the Formation Transaction, through which the Company acquired the equity interests in the Predecessor from Two Harbors. In accordance with Accounting Standards Codification (ASC) 805, Business Combinations, the Predecessor is considered the acquiring or surviving entity, meaning the historical assets and liabilities of TH Commercial Holdings LLC included in the consolidated balance sheets are recorded at the Predecessor’s historical carryover cost basis. As a result of the Formation Transaction, the Company is considered a continuation of the Predecessor’s business operations and its historical results of operations and cash flows are included in the Company’s consolidated financial statements. In consideration for the contribution, Two Harbors received 33,071,000 shares of the Company’s common stock and 1,000 shares of cumulative redeemable preferred stock with an aggregate liquidation preference of $1,000 per share.
Loans Held-for-Investment
The Company originates and acquires commercial real estate debt and related instruments generally to be held as long-term investments. These assets are classified as loans held-for-investment on the consolidated balance sheets. Additionally, the Company was the sole certificate holder of a trust entity that held a commercial mezzanine loan. The trust was considered a VIE for financial reporting purposes and, thus, was reviewed for consolidation under the applicable consolidation guidance. As the Company had both the power to direct the activities of the trust that most significantly impact the entity’s performance, and the obligation to absorb losses or the right to receive benefits of the entity that could be significant, the Company consolidated the trust. The underlying loan was classified as a loan held-for-investment on the consolidated balance sheets. The loan was legally isolated from the Company and had been structured to be beyond the reach of creditors of the Company. In the second quarter of 2018, the Company financed a pool of its commercial real estate loans through a CLO, which is considered a VIE for financial reporting purposes and, thus, was reviewed for consolidation under the applicable consolidation guidance. Because the Company has both the power to direct the activities of the CLO that most significantly impact the entity’s performance, and the obligation to absorb losses or the right to receive benefits of the entity that could be significant, the Company consolidates the CLO and classifies the underlying loans as loans held-for-investment. Interest income on loans held-for-investment is recorded on the consolidated statements of comprehensive income.
Loans held-for-investment are reported at cost, net of any unamortized acquisition premiums or discounts, loan fees and origination costs as applicable, unless the assets are deemed impaired. Impairment is indicated when it is deemed probable that the Company will not be able to collect all amounts due pursuant to the contractual terms of the loan. Because the Company’s loans held-for-investment are collateralized by real property or are collateral dependent, impairment is measured by comparing the estimated fair value of the underlying collateral less estimated costs to sell to the amortized cost of the respective loan. The valuation of the underlying collateral requires significant judgment, which includes assumptions regarding capitalization rates, leasing, credit worthiness of major tenants, occupancy rates, availability of financing, exit plan, loan sponsorship, actions of other lenders, overall economic conditions, the broader commercial real estate market, local geographic sub-markets, and other factors deemed necessary. If a loan is determined to be impaired, the Company records an allowance to reduce the carrying value of the loan through a charge to provision for loan losses. Actual losses, if any, could ultimately differ from these estimates.
Interest income on loans held-for-investment is recognized at the loan coupon rate. Any premiums or discounts, loan fees, contractual exit fees and origination costs are amortized or accreted into interest income over the lives of the loans using the effective interest method. Loans are considered past due when they are 30 days past their contractual due date. Interest income recognition is suspended when loans are placed on nonaccrual status. Generally, commercial mortgage loans are placed on nonaccrual status when delinquent for more than 60 days or when determined not to be probable of full collection. Interest accrued, but not collected, at the date loans are placed on nonaccrual is reversed and subsequently recognized only to the extent it is received in cash or until it qualifies for return to accrual status. However, where there is doubt regarding the ultimate collectability of loan principal, all cash received is applied to reduce the carrying value of such loans. Commercial mortgage loans are restored to accrual status only when contractually current or the collection of future payments is reasonably assured.
Available-for-Sale Securities, at Fair Value
From time to time, the Company may selectively invest in commercial mortgage-backed securities, or CMBS, representing interests in pools of commercial mortgage loans issued by trusts. The Company has designated investments in certain CMBS as available-for-sale, or AFS, because the Company may dispose of them prior to maturity. All assets classified as AFS are reported at estimated fair value with unrealized gains and losses, excluding other than temporary impairments, included in accumulated other comprehensive loss.
GRANITE POINT MORTGAGE TRUST INC.
Notes to the Consolidated Financial Statements
Interest income on available-for-sale securities is accrued based on the outstanding principal balance and their contractual terms. Premiums and discounts associated with CMBS are amortized into interest income over the life of such securities using the effective yield method.
The Company evaluates its available-for-sale securities, on a quarterly basis, to assess whether a decline in the fair value of an AFS security below the Company’s amortized cost basis is an other-than-temporary impairment, or OTTI. The presence of OTTI is based upon a fair value decline below a security’s amortized cost basis and a corresponding adverse change in expected cash flows due to credit related factors as well as non-credit factors, such as changes in interest rates and market spreads. Impairment is considered other-than-temporary if an entity (i) intends to sell the security, (ii) will more likely than not be required to sell the security before it recovers in value, or (iii) does not expect to recover the security’s amortized cost basis, even if the entity does not intend to sell the security. Under these scenarios, the impairment is other-than-temporary and the full amount of impairment should be recognized currently in earnings and the cost basis of the investment security is adjusted. However, if an entity does not intend to sell the impaired debt security and it is more likely than not that it will not be required to sell before recovery, the OTTI is separated into (i) the estimated amount relating to credit loss, or credit component, and (ii) the amount relating to all other factors, or non-credit component. Only the estimated credit loss amount is recognized currently in earnings, with the remainder of the loss amount recognized in other comprehensive income (loss). The difference between the new amortized cost basis and the cash flows expected to be collected is accreted as interest income in accordance with the effective interest method.
Held-to-Maturity Securities
From time to time, the Company may selectively invest in commercial mortgage-backed securities, or CMBS, representing interests in pools of commercial mortgage loans issued by trusts. The Company has designated investments in certain CMBS as held-to-maturity, or HTM, because the Company has both the ability and intent to hold them until maturity. All assets classified as HTM are reported at stated cost plus any premiums or discounts, which are amortized or accreted through the consolidated statement of comprehensive income using the effective interest method.
The Company evaluates its HTM securities, on a quarterly basis, to assess whether a decline in the fair value of an HTM security below the Company’s amortized cost basis is an OTTI. The presence of OTTI is based upon a fair value decline below a security’s amortized cost basis and a corresponding adverse change in expected cash flows due to credit related factors. Impairment is considered other-than-temporary if an entity does not expect to recover the security’s amortized cost basis. Impairment is recognized currently in earnings and the cost basis of the HTM security is adjusted.
Cash and Cash Equivalents
Cash and cash equivalents include cash held in bank accounts and cash held in money market funds on an overnight basis.
Restricted Cash
Restricted cash includes certain cash balances the Company is required to maintain in restricted accounts as collateral for the Company’s repurchase agreements and with counterparties to support activities related to securities. Cash held by counterparties as collateral, which resides in non-interest bearing accounts, is not available to the Company for general corporate purposes, but may be applied against amounts due to securities and repurchase agreement counterparties or returned to the Company when the collateral requirements are exceeded or at the maturity of the repurchase agreement.
Accrued Interest Receivable
Accrued interest receivable represents interest that is due and payable to the Company. Cash interest is generally received within thirty days of recording the receivable.
Due from Counterparties
Due from counterparties includes cash held by counterparties as collateral against the Company’s repurchase agreements but represents excess capacity and deemed unrestricted and a receivable from the counterparty as of the balance sheet date.
Deferred Debt Issuance Costs
Because the outstanding balance of the Company’s repurchase agreement facilities may fluctuate as the Company borrows and repays amounts, the Company presents unamortized deferred debt issuance costs related to these credit facilities as an asset on its consolidated balance sheets. Amortization of deferred debt issuance costs over the term of the related repurchase facility is reported within interest expense on repurchase agreements on the consolidated statements of comprehensive income.
GRANITE POINT MORTGAGE TRUST INC.
Notes to the Consolidated Financial Statements
Repurchase Agreements
The Company finances the acquisition of its loans held-for-investment, AFS securities and HTM securities through the use of repurchase agreements. Borrowings under repurchase agreements generally bear interest rates of a specified margin over one-month LIBOR and are generally uncommitted. The repurchase agreements are treated as collateralized financing transactions and are carried at their contractual amounts, as specified in the respective agreements.
Securitized Debt Obligations
In the second quarter of 2018, the Company financed a pool of its commercial real estate loans through a collateralized loan obligation, or CLO, retaining the subordinate securities in its investment portfolio. The securitization was accounted for as a financing arrangement and consolidated on the Company’s consolidated financial statements. The securitized debt obligations not retained by the Company, which are nonrecourse to the Company beyond the assets held in the CLO, are recorded at outstanding principal balance, net of any unamortized deferred debt issuance costs, on the Company’s consolidated balance sheets.
Revolving Credit Facilities
The Company finances the acquisition of its loans held-for-investment through the use of revolving credit facilities. Borrowings under revolving credit generally bear interest rates of a specified margin over one-month LIBOR and are generally uncommitted. The revolving credit facilities are treated as collateralized financing transactions and are carried at their contractual amounts, as specified in the respective agreements.
Convertible Senior Notes
Convertible senior notes include unsecured convertible debt that are carried at their unpaid principal balance, net of any unamortized deferred issuance costs, on the Company’s consolidated balance sheet. Interest on the notes is payable semiannually until such time the notes mature or are converted into shares of the Company’s common stock. Amortization of deferred debt issuance costs over the term of the notes is reported within interest expense on convertible senior notes on the consolidated statements of comprehensive income.
Note Payable to Affiliate
During the years ended December 31, 2017 and 2016, the Company financed certain of its loans held-for-investment through a revolving note payable to TH Insurance Holdings Company LLC, or TH Insurance, a captive insurance company and indirect subsidiary of Two Harbors and a member of the Federal Home Loan Bank of Des Moines, or the FHLB. In exchange for the note with TH Insurance, the Company received an allocated portion of TH Insurance’s advances from the FHLB and pledged to the FHLB a portion of its loans held-for-investment as collateral for TH Insurance’s advances. The affiliate note payable reflected terms consistent with TH Insurance’s FHLB advances. During the year ended December 31, 2017, the note payable to TH Insurance was in effect to assist with cash management and operational processes as the investments in the Company’s portfolio pledged to the FHLB were released and transitioned to its repurchase facilities. The affiliate note payable matured on October 27, 2017 and was repaid in full.
Accrued Interest Payable
Accrued interest payable represents interest that is due and payable to third parties. Interest is generally paid within 30 days to three months of recording the payable, based upon the Company’s remittance requirements.
Income Taxes
The Company has elected to be taxed as a REIT under the Code and the corresponding provisions of state law. To qualify as a REIT, the Company must distribute at least 90% of its annual REIT taxable income to stockholders (not including taxable income retained in its taxable subsidiaries) within the time frame set forth in the tax Code and the Company must also meet certain other requirements. In addition, because certain activities, if performed by the Company, may cause the Company to earn income which is not qualifying for the REIT gross income tests, the Company has formed a TRS, as defined in the Code, to engage in such activities. The TRS’s activities are subject to income taxes as well as any REIT taxable income not distributed to stockholders.
The Company assesses its tax positions for all open tax years (2015, 2016 and 2017) and determines whether the Company has any material unrecognized liabilities in accordance with ASC 740, Income Taxes. The Company records these liabilities to the extent the Company deems them more likely than not to be incurred. The Company classifies interest and penalties on material uncertain tax positions as interest expense and other expense, respectively, in its consolidated statements of comprehensive income. There were no interest or penalties recorded during the periods presented in these financial statements.
GRANITE POINT MORTGAGE TRUST INC.
Notes to the Consolidated Financial Statements
The Tax Cuts and Jobs Act of 2017 (“TCJA”) made many significant changes to the U.S. federal income tax laws applicable to businesses, including REITs and taxable REIT subsidiaries. Pursuant to the TCJA, as of January 1, 2018, the federal income tax rate applicable to corporations was reduced from 35% to 21% and the corporate alternative minimum tax was repealed. In addition, the deduction of net interest expense is limited for all businesses; provided that certain businesses, including real estate businesses, may elect not to be subject to such limitations and instead to depreciate their real property related assets over longer depreciable lives.
Related Party Management Fee and Operating Expenses
The Company does not have any employees and is externally managed by the Manager under the terms of a management agreement entered into in connection with closing of the IPO and Formation Transaction on June 28, 2017. Under the management agreement, the Manager and its affiliates provide the Company with the personnel and resources necessary to operate the Company’s business. In exchange, the Company pays the Manager a base management fee that is equal to 1.5% of the Company’s equity on an annualized basis as well as an incentive fee, which will be payable, if earned, beginning in the fourth quarter of 2018, in accordance with the terms of the management agreement. See further discussion of the base management fee and incentive fee calculations in Note 14 - Commitments and Contingencies.
Prior to the IPO and Formation Transaction, the Predecessor was allocated its proportionate share of management fees incurred by Two Harbors under the management agreement that Two Harbors has with PRCM Advisers LLC, or PRCM Advisers, a subsidiary of the Manager. Under its management agreement with PRCM Advisers, Two Harbors pays the Manager Advisers a base management fee equal to 1.5% of its equity on an annualized basis.
Additionally, certain direct and allocated operating expenses paid by the Manager to third-party vendors and by Two Harbors to PRCM Advisers and other third-party vendors are included in the Company’s consolidated statements of comprehensive income.
Preferred Stock
The Company accounts for its preferred stock in accordance with ASC 480, Distinguishing Liabilities from Equity. Holders of the Company’s preferred stock have certain preference rights with respect to the common stock. Based on the Company’s analysis, the preferred stock has been classified as redeemable interests outside of permanent equity in the mezzanine section of the Company’s consolidated balance sheet as a result of certain redemption requirements or other terms.
Earnings Per Share
Basic and diluted earnings per share are computed by dividing net income by the weighted average number of common shares and potential common shares outstanding during the period from the date the Company commenced operations as a publicly traded company and completed its IPO and Formation Transaction on June 28, 2017 through December 31, 2018. Prior to its IPO and Formation Transaction, the Company did not have any publicly issued common stock. For both basic and diluted per share calculations, potential common shares represents issued and unvested shares of restricted stock, which have full rights to the common stock dividend declarations of the Company. If the assumed conversion of convertible notes into common shares is dilutive, diluted earnings per share is adjusted by adding back the periodic interest expense (net of any tax effects) associated with dilutive convertible notes to net income attributable to common stockholders and adding the shares issued in an assumed conversion to the diluted weighted average share count.
Other Comprehensive Income (Loss)
Current period net unrealized gains and losses on AFS securities are reported as components of accumulated other comprehensive income (loss) on the consolidated statements of stockholders’ equity and in the consolidated statements of comprehensive income.
Equity Incentive Plan
The Company has adopted the 2017 Equity Incentive Plan, or the Plan, to provide incentive compensation to attract and retain qualified directors, officers, advisors, consultants and other personnel, including certain personnel of the Manager and its affiliates. The Plan is administered by the compensation committee of the Company’s board of directors. The Plan permits the granting of restricted shares of common stock, phantom shares, dividend equivalent rights and other equity-based awards. See Note 17 - Equity Incentive Plan for further details regarding the Plan.
The cost of equity-based compensation awarded to personnel provided by the manager is measured at fair value at each reporting date based on the price of the Company’s stock as of period end in accordance with ASC 505, Equity, or ASC 505, and amortized over the vesting term.
GRANITE POINT MORTGAGE TRUST INC.
Notes to the Consolidated Financial Statements
Offsetting Assets and Liabilities
Certain of the Company’s repurchase agreements are governed by underlying agreements that provide for a right of setoff in the event of default of either party to the agreement. Under certain of these agreements, the Company and the counterparty may be required to post cash collateral based upon the net underlying market value of the Company’s open positions with the counterparty.
Under U.S. GAAP, if the Company has a valid right of setoff, it may offset the related asset and liability and report the net amount. The Company presents repurchase agreements subject to master netting arrangements or similar agreements on a gross basis. Regardless of whether or not the Company pledges or receives any cash collateral in accordance with its repurchase agreements, the Company does not offset financial assets and liabilities with the associated cash collateral on its consolidated balance sheets.
The following table presents information about the Company’s repurchase agreements that are subject to master netting arrangements or similar agreements and can potentially be offset on the Company’s consolidated balance sheets as of December 31, 2018 and December 31, 2017:
|
| | | | | | | |
(in thousands) | December 31,
2018 | | December 31,
2017 |
Gross amounts of repurchase agreements | $ | 1,500,543 |
| | $ | 1,521,608 |
|
Gross amounts offset in the consolidated balance sheets | — |
| | — |
|
Net amounts of repurchase agreements presented in the consolidated balance sheets | 1,500,543 |
| | 1,521,608 |
|
Gross amounts not offset against repurchase agreements in the consolidated balance sheets (1): | | | |
Financial instruments | (1,500,543 | ) | | (1,521,608 | ) |
Cash collateral received (pledged) | — |
| | — |
|
Net amount | $ | — |
| | $ | — |
|
____________________
| |
(1) | Amounts presented are limited in total to the net amount of liabilities presented in the consolidated balance sheets by instrument. Excess cash collateral or financial assets that are pledged to counterparties may exceed the financial liabilities subject to a master netting arrangement or similar agreement. These excess amounts are excluded from the table above, although separately reported within restricted cash or due from counterparties in the Company’s consolidated balance sheets. |
Recently Issued and/or Adopted Accounting Standards
Revenue from Contracts with Customers
In May 2014, the Financial Accounting Standards Board, or FASB, issued ASU No. 2014-09, which is a comprehensive revenue recognition standard that supersedes virtually all existing revenue guidance under U.S. GAAP. The standard’s core principle is that an entity will recognize revenue when it transfers promised goods or services to customers in an amount that reflects the consideration to which the entity expects to be entitled in exchange for those goods and services. As a result of the issuance of ASU No. 2015-14 in August 2015 deferring the effective date of ASU No. 2014-09 by one year, the ASU is effective for annual periods, and interim periods within those annual periods, beginning on or after December 15, 2017, with early adoption prohibited. The Company has evaluated the new guidance and determined that interest income and gains and losses on financial instruments are outside the scope of ASC 606, Revenues from Contracts with Customers. As a result, the adoption of this ASU did not have a material impact on the Company’s financial condition, results of operations or financial statement disclosures.
Lease Classification and Accounting
In February 2016, the FASB issued ASU No. 2016-02, which requires lessees to recognize on their balance sheets both a lease liability for the obligation to make lease payments and a right-of-use asset for the right to use the underlying asset for the lease term. The ASU is effective for annual periods, and interim periods within those annual periods, beginning on or after December 15, 2018, with early adoption permitted. The Company has determined this ASU will not have a material impact on the Company’s financial condition, results of operations or financial statement disclosures.
GRANITE POINT MORTGAGE TRUST INC.
Notes to the Consolidated Financial Statements
Measurement of Credit Losses on Financial Instruments
In June 2016, the FASB issued ASU No. 2016-13, which changes the impairment model for most financial assets and certain other instruments. Allowances for credit losses on available-for-sale, or AFS, and held-to-maturity, or HTM, debt securities will be recognized, rather than direct reductions in the amortized cost of the investments. The new model also requires the estimation of lifetime expected credit losses and corresponding recognition of allowance for losses on trade and other receivables, HTM debt securities, loans, and other instruments held at amortized cost. The ASU requires certain recurring disclosures and is effective for annual periods, and interim periods within those annual periods, beginning on or after December 15, 2019, with early adoption permitted for annual periods, and interim periods within those annual periods, beginning on or after December 15, 2018. The Company is evaluating the adoption of this ASU to determine the impact it may have on its consolidated financial statements, which at the date of adoption, is expected to increase the allowance for credit losses with a resulting negative adjustment to retained earnings.
Accounting for Share-Based Payments to Nonemployees
In June 2018, the FASB issued ASU No. 2018-07 to simplify the accounting for share-based payments to nonemployees by aligning it with the accounting for share-based payments to employees, with certain exceptions. Under the guidance, equity-classified nonemployee awards will be measured on and fixed at the grant date, rather than measured at fair value at each reporting date until the date at which the nonemployee’s performance is complete. The ASU is effective for annual periods, and interim periods within those annual periods, beginning on or after December 15, 2018, with early adoption permitted. The adoption of this ASU will not have a material impact on the Company’s consolidated financial statements.
Fair Value Measurement Disclosure Requirements
In August 2018, the FASB issued ASU No. 2018-13, which eliminates, adds and modifies certain disclosure requirements for fair value measurements. Under the guidance, entities are no longer required to disclose the amount of and reasons for transfers between Level 1 and Level 2 of the fair value hierarchy, but public companies are required to disclose (1) the changes in unrealized gains and losses for the period included in other comprehensive income for recurring Level 3 fair value measurements of instruments held at the end of the reporting period and (2) the range and weighted average used to develop significant unobservable inputs for Level 3 fair value measurements. The ASU is effective for annual periods, and interim periods within those annual periods, beginning on or after December 15, 2019, with early adoption permitted. Early adoption of this ASU did not have a material impact on the Company’s financial condition, results of operations or financial statement disclosures.
SEC Disclosure Update and Simplification
In August 2018, the SEC adopted a final rule that eliminates or amends disclosure requirements that have become duplicative, overlapping, or outdated in light of other SEC disclosure requirements, U.S. GAAP, or changes in the information environment. However, the guidance also added requirements for entities to include in their interim financial statements a reconciliation of changes in stockholders’ equity for each period for which an income statement is required (both year-to-date and quarterly periods). The final rule is effective for all filings made on or after November 5, 2018. However, the SEC staff said it would not object to a registrant waiting to comply with the new interim disclosure requirement until its Form 10-Q for the quarter that begins after the effective date. As a result, the Company plans to adopt the new interim disclosure requirement in its Form 10-Q for the three months ended March 31, 2019. The Company has determined this final rule will not have a material impact on the Company’s financial condition, results of operations or financial statement disclosures.
Note 3. Variable Interest Entities
In the second quarter of 2018, the Company financed a pool of its commercial real estate loans through a CLO, which is considered a VIE for financial reporting purposes and, thus, was reviewed for consolidation under the applicable consolidation guidance. Because the Company has both the power to direct the activities of the CLO that most significantly impact the entity’s performance, and the obligation to absorb losses or the right to receive benefits of the entity that could be significant, the Company consolidates the CLO.
As of December 31, 2017, the Company was the sole certificate holder of a trust entity that holds a commercial mezzanine loan. The trust is considered a VIE for financial reporting purposes and, thus, was reviewed for consolidation under the applicable consolidation guidance. Because the Company had both the power to direct the activities of the trust that most significantly impact the entity’s performance, and the obligation to absorb losses or the right to receive benefits of the entity that could be significant, the Company consolidated the trust. The loan held by the trust was repaid during the three months ended March 31, 2018. As a result, the Company no longer consolidates the trust on its consolidated financial statements.
GRANITE POINT MORTGAGE TRUST INC.
Notes to the Consolidated Financial Statements
The following table presents a summary of the assets and liabilities of all variable interest entities consolidated on the Company’s consolidated balance sheets as of December 31, 2018 and December 31, 2017:
|
| | | | | | | |
(in thousands) | December 31,
2018 | | December 31,
2017 |
Loans held-for-investment | $ | 795,259 |
| | $ | 45,890 |
|
Restricted cash | 26,136 |
| | — |
|
Accrued interest receivable | 2,622 |
| | 178 |
|
Other assets | 5,130 |
| | — |
|
Total Assets | $ | 829,147 |
| | $ | 46,068 |
|
Securitized debt obligations | $ | 654,263 |
| | $ | — |
|
Accrued interest payable | 689 |
| | — |
|
Total Liabilities | $ | 654,952 |
| | $ | — |
|
The Company is not required to consolidate VIEs for which it has concluded it does not have both the power to direct the activities of the VIEs that most significantly impact the entities’ performance, and the obligation to absorb losses or the right to receive benefits of the entities that could be significant. The Company’s investments in these unconsolidated VIEs include CMBS, which are classified within available-for-sale securities, at fair value, and held-to-maturity securities on the consolidated balance sheets. As of December 31, 2018 and December 31, 2017, the carrying value, which also represents the maximum exposure to loss, of all CMBS in unconsolidated VIEs was $39.3 million and $55.0 million, respectively.
Note 4. Loans Held-for-Investment
The Company originates and acquires commercial real estate debt and related instruments generally to be held as long-term investments. These assets are classified as loans held-for-investment on the consolidated balance sheets. In the second quarter of 2018, the Company financed a pool of its commercial real estate loans through a CLO, which is considered a VIE for financial reporting purposes and, thus, was reviewed for consolidation under the applicable consolidation guidance. Because the Company has both the power to direct the activities of the CLO that most significantly impact the entity’s performance, and the obligation to absorb losses or the right to receive benefits of the entity that could be significant, the Company consolidates the CLO and classifies the underlying loans as loans held-for-investment. Additionally, at December 31, 2017 the Company was the sole certificate holder of a trust entity that held a commercial mezzanine loan. The underlying loan held by the trust was consolidated on the Company’s consolidated balance sheet and classified as loans held-for-investment. See Note 3 - Variable Interest Entities for additional information regarding consolidation of the trust. Loans held-for-investment are reported at cost, net of any unamortized acquisition premiums or discounts, loan fees and origination costs as applicable, unless the assets are deemed impaired.
The following tables summarize the Company’s loans held-for-investment by asset type, property type and geographic location as of December 31, 2018 and December 31, 2017:
|
| | | | | | | | | | | | | | | |
| December 31,
2018 |
(dollars in thousands) | Senior Loans (1) | | Mezzanine Loans | | B-Notes | | Total |
Unpaid principal balance | $ | 3,147,310 |
| | $ | 31,679 |
| | $ | 14,652 |
| | $ | 3,193,641 |
|
Unamortized (discount) premium | (151 | ) | | — |
| | — |
| | (151 | ) |
Unamortized net deferred origination fees | (25,577 | ) | | — |
| | — |
| | (25,577 | ) |
Carrying value | $ | 3,121,582 |
| | $ | 31,679 |
| | $ | 14,652 |
| | $ | 3,167,913 |
|
Unfunded commitments | $ | 626,155 |
| | $ | — |
| | $ | — |
| | $ | 626,155 |
|
Number of loans | 88 |
| | 3 |
| | 1 |
| | 92 |
|
Weighted average coupon | 6.4 | % | | 11.4 | % | | 8.0 | % | | 6.5 | % |
Weighted average years to maturity (2) | 2.0 |
| | 1.9 |
| | 8.1 |
| | 2.0 |
|
GRANITE POINT MORTGAGE TRUST INC.
Notes to the Consolidated Financial Statements
|
| | | | | | | | | | | | | | | |
| December 31,
2017 |
(dollars in thousands) | Senior Loans (1) | | Mezzanine Loans | | B-Notes | | Total |
Unpaid principal balance | $ | 2,220,361 |
| | $ | 88,945 |
| | $ | 14,845 |
| | $ | 2,324,151 |
|
Unamortized (discount) premium | (169 | ) | | (9 | ) | | — |
| | (178 | ) |
Unamortized net deferred origination fees | (19,752 | ) | | 45 |
| | — |
| | (19,707 | ) |
Carrying value | $ | 2,200,440 |
| | $ | 88,981 |
| | $ | 14,845 |
| | $ | 2,304,266 |
|
Unfunded commitments | $ | 337,623 |
| | $ | 1,580 |
| | $ | — |
| | $ | 339,203 |
|
Number of loans | 53 |
| | 5 |
| | 1 |
| | 59 |
|
Weighted average coupon | 5.9 | % | | 9.7 | % | | 8.0 | % | | 6.0 | % |
Weighted average years to maturity (2) | 2.3 |
| | 2.0 |
| | 9.1 |
| | 2.4 |
|
____________________
| |
(1) | Loans primarily secured by a first priority lien on commercial real property and related personal property and also includes, when applicable, any companion subordinate loans. |
| |
(2) | Based on contractual maturity date. Certain loans are subject to contractual extension options which may be subject to conditions as stipulated in the loan agreement. Actual maturities may differ from contractual maturities stated herein as certain borrowers may have the right to prepay with or without paying a prepayment penalty. The Company may also extend contractual maturities in connection with loan modifications. |
|
| | | | | | | | | | | | | | |
(dollars in thousands) | | December 31,
2018 | | December 31,
2017 |
Property Type | | Carrying Value | | % of Loan Portfolio | | Carrying Value | | % of Loan Portfolio |
Office | | $ | 1,495,128 |
| | 47.2 | % | | $ | 1,223,642 |
| | 53.1 | % |
Multifamily | | 569,259 |
| | 18.0 | % | | 356,016 |
| | 15.4 | % |
Hotel | | 427,611 |
| | 13.5 | % | | 274,416 |
| | 11.9 | % |
Retail | | 324,447 |
| | 10.2 | % | | 254,786 |
| | 11.1 | % |
Industrial | | 351,468 |
| | 11.1 | % | | 195,406 |
| | 8.5 | % |
Total | | $ | 3,167,913 |
| | 100.0 | % | | $ | 2,304,266 |
| | 100.0 | % |
|
| | | | | | | | | | | | | | |
(dollars in thousands) | | December 31,
2018 | | December 31,
2017 |
Geographic Location | | Carrying Value | | % of Loan Portfolio | | Carrying Value | | % of Loan Portfolio |
Northeast | | $ | 1,171,691 |
| | 37.0 | % | | $ | 896,361 |
| | 38.9 | % |
West | | 694,223 |
| | 21.9 | % | | 509,088 |
| | 22.1 | % |
Southwest | | 681,108 |
| | 21.5 | % | | 454,088 |
| | 19.7 | % |
Southeast | | 369,961 |
| | 11.7 | % | | 346,623 |
| | 15.0 | % |
Midwest | | 250,930 |
| | 7.9 | % | | 98,106 |
| | 4.3 | % |
Total | | $ | 3,167,913 |
| | 100.0 | % | | $ | 2,304,266 |
| | 100.0 | % |
At December 31, 2018 and December 31, 2017, the Company pledged loans held-for-investment with a carrying value of $2.9 billion and $2.2 billion, respectively, as collateral for repurchase agreements, revolving credit facilities and securitized debt obligations. See Note 10 - Repurchase Agreements, Note 11 - Revolving Credit Facilities and Note 12 - Securitized Debt Obligations.
GRANITE POINT MORTGAGE TRUST INC.
Notes to the Consolidated Financial Statements
The following table summarizes activity related to loans held-for-investment for the years ended December 31, 2018 and December 31, 2017.
|
| | | | | | | |
| Year Ended
December 31, |
(in thousands) | 2018 | | 2017 |
Balance at beginning of period | $ | 2,304,266 |
| | $ | 1,364,291 |
|
Originations, acquisitions and additional fundings | 1,338,224 |
| | 1,048,423 |
|
Repayments | (468,734 | ) | | (100,466 | ) |
Net discount accretion (premium amortization) | 27 |
| | (5 | ) |
Increase in net deferred origination fees | (18,694 | ) | | (15,945 | ) |
Amortization of net deferred origination fees | 12,824 |
| | 7,968 |
|
Allowance for loan losses | — |
| | — |
|
Balance at end of period | $ | 3,167,913 |
| | $ | 2,304,266 |
|
The Company evaluates each loan for impairment at least quarterly by assessing the risk factors of each loan and assigning a risk rating based on a variety of factors. Risk factors include property type, geographic and local market dynamics, physical condition, leasing and tenant profile, projected cash flow, loan structure and exit plan, loan-to-value ratio, project sponsorship, and other factors deemed necessary. Risk ratings are defined as follows:
| |
4 – | Higher Risk: A loan that has exhibited material deterioration in cash flows and/or other credit factors, which, if negative trends continue, could be indicative of future loss. |
| |
5 – | Impaired/Loss Likely: A loan that has a significantly increased probability of default or principal loss. |
The following table presents the number of loans, unpaid principal balance and carrying value (amortized cost) by risk rating for loans held-for-investment as of December 31, 2018 and December 31, 2017:
|
| | | | | | | | | | | | | | | | | | | | | | |
(dollars in thousands) | | December 31,
2018 | | December 31,
2017 |
Risk Rating | | Number of Loans | | Unpaid Principal Balance | | Carrying Value | | Number of Loans | | Unpaid Principal Balance | | Carrying Value |
1 | | 9 |
| | $ | 354,791 |
| | $ | 353,583 |
| | 6 |
| | $ | 414,695 |
| | $ | 413,314 |
|
2 | | 78 |
| | 2,680,297 |
| | 2,656,679 |
| | 50 |
| | 1,840,638 |
| | 1,822,134 |
|
3 | | 3 |
| | 121,133 |
| | 120,496 |
| | 3 |
| | 68,818 |
| | 68,818 |
|
4 | | 2 |
| | 37,420 |
| | 37,155 |
| | — |
| | — |
| | — |
|
5 | | — |
| | — |
| | — |
| | — |
| | — |
| | — |
|
Total | | 92 |
| | $ | 3,193,641 |
| | $ | 3,167,913 |
| | 59 |
| | $ | 2,324,151 |
| | $ | 2,304,266 |
|
The Company has not identified any impaired loans and it has not recorded any allowances for losses as it is not deemed probable that the Company will not be able to collect all amounts due pursuant to the contractual terms of the loans.
GRANITE POINT MORTGAGE TRUST INC.
Notes to the Consolidated Financial Statements
Note 5. Available-for-Sale Securities, at Fair Value
The following table presents the face value and carrying value (which approximates fair value) of AFS securities as of December 31, 2018 and December 31, 2017:
|
| | | | | | | |
(in thousands) | December 31,
2018 | | December 31,
2017 |
Face value | $ | 12,798 |
| | $ | 12,798 |
|
Gross unrealized gains | — |
| | — |
|
Gross unrealized losses | (192 | ) | | — |
|
Carrying value | $ | 12,606 |
| | $ | 12,798 |
|
On December 31, 2018, the Company’s AFS securities had contractual maturities of less than one year.
At December 31, 2018 and December 31, 2017, the Company pledged AFS securities with a carrying value of $12.6 million and $12.8 million, respectively, as collateral for repurchase agreements. See Note 10 - Repurchase Agreements.
At December 31, 2018, the Company’s AFS securities were in an unrealized loss position. At December 31, 2017, the Company’s AFS securities had a carrying value equal to their face value.
Evaluating AFS Securities for Other-Than-Temporary Impairments
In evaluating AFS securities for other-than-temporary impairments, or OTTI, the Company determines whether there has been a significant adverse quarterly change in the cash flow expectations for a security. The Company compares the amortized cost of each security in an unrealized loss position against the present value of expected future cash flows of the security. The Company also considers whether there has been a significant adverse change in the regulatory and/or economic environment as part of this analysis. If the amortized cost of the security is greater than the present value of expected future cash flows using the original yield as the discount rate, an other-than-temporary credit impairment has occurred. If the Company does not intend to sell and will not be more likely than not required to sell the security, the credit loss is recognized in earnings and the balance of the unrealized loss is recognized in other comprehensive (loss) income. If the Company intends to sell the security or will be more likely than not required to sell the security, the full unrealized loss is recognized in earnings. The Company did not record any other-than-temporary credit impairments during the years ended December 31, 2018, 2017 and 2016 as expected cash flows were greater than amortized cost for all AFS securities held.
Gross Realized Gains and Losses
Gains and losses from the sale of AFS securities are recorded as realized gains (losses) in the Company’s consolidated statements of comprehensive income. The Company did not sell any AFS securities during the years ended December 31, 2018, 2017 and 2016.
Note 6. Held-to-Maturity Securities
The following table presents the face value and carrying value of HTM securities by collateral type as of December 31, 2018 and December 31, 2017:
|
| | | | | | | |
(in thousands) | December 31,
2018 | | December 31,
2017 |
Face value | $ | 26,696 |
| | $ | 42,169 |
|
Unamortized premium (discount) | — |
| | — |
|
Carrying value | $ | 26,696 |
| | $ | 42,169 |
|
On December 31, 2018, the Company’s HTM securities had contractual maturities of less than one year.
At December 31, 2018 and December 31, 2017, the Company pledged HTM securities with a carrying value of $26.7 million and $42.2 million, respectively, as collateral for repurchase agreements. See Note 10 - Repurchase Agreements.
GRANITE POINT MORTGAGE TRUST INC.
Notes to the Consolidated Financial Statements
Evaluating HTM Securities for Other-Than-Temporary Impairments
In evaluating HTM securities for OTTI, the Company determines whether there has been a significant adverse quarterly change in the cash flow expectations for a security. The Company compares the amortized cost of each security against the present value of expected future cash flows of the security. The Company also considers whether there has been a significant adverse change in the regulatory and/or economic environment as part of this analysis. If the amortized cost of the security is greater than the present value of expected future cash flows using the original yield as the discount rate, an other-than-temporary credit impairment has occurred and the credit loss is recognized in earnings. The Company did not record any other-than-temporary credit impairments during the years ended December 31, 2018, 2017 and 2016, as expected cash flows were greater than amortized cost for all HTM securities held.
Note 7. Cash, Cash Equivalents and Restricted Cash
Cash and cash equivalents include cash held in bank accounts and cash held in money market funds on an overnight basis.
The Company is required to maintain certain cash balances in restricted accounts as collateral for the Company’s repurchase agreements and with counterparties to support activities related to securities. As of December 31, 2018 and December 31, 2017, the Company had $5.6 million and $3.0 million, respectively, as collateral for repurchase agreements and by counterparties to support activities related to securities. In addition, as of December 31, 2018, the Company held $26.1 million in restricted cash representing proceeds from principal paydowns of loans held in the CLO.
The following table provides a reconciliation of cash, cash equivalents, and restricted cash reported on the Company’s consolidated balance sheets as of December 31, 2018 and December 31, 2017 that sum to the total of the same such amounts shown in the statements of cash flows:
|
| | | | | | | |
(in thousands) | December 31,
2018 | | December 31,
2017 |
Cash and cash equivalents | $ | 91,700 |
| | $ | 107,765 |
|
Restricted cash | 31,723 |
| | 2,953 |
|
Total cash, cash equivalents and restricted cash | $ | 123,423 |
| | $ | 110,718 |
|
Note 8. Accrued Interest Receivable
The following table presents the Company’s accrued interest receivable by collateral type as of December 31, 2018 and December 31, 2017:
|
| | | | | | | |
(in thousands) | December 31,
2018 | | December 31,
2017 |
Loans held-for-investment | $ | 10,089 |
| | $ | 6,880 |
|
Available-for-sale securities | 57 |
| | 51 |
|
Held-to-maturity securities | 122 |
| | 174 |
|
Total | $ | 10,268 |
| | $ | 7,105 |
|
Note 9. Fair Value
Fair Value Measurements
ASC 820 defines fair value as the price that would be received to sell an asset or paid to transfer a liability in an orderly transaction between market participants at the measurement date. ASC 820 clarifies that fair value should be based on the assumptions market participants would use when pricing an asset or liability and establishes a fair value hierarchy that prioritizes the information used to develop those assumptions. The fair value hierarchy gives the highest priority to quoted prices available in active markets (i.e., observable inputs) and the lowest priority to data lacking transparency (i.e., unobservable inputs). Additionally, ASC 820 requires an entity to consider all aspects of nonperformance risk, including the entity’s own credit standing, when measuring fair value of a liability.
GRANITE POINT MORTGAGE TRUST INC.
Notes to the Consolidated Financial Statements
ASC 820 establishes a three-level hierarchy to be used when measuring and disclosing fair value. An instrument’s categorization within the fair value hierarchy is based on the lowest level of significant input to its valuation. Following is a description of the three levels:
| |
Level 1 | Inputs are quoted prices in active markets for identical assets or liabilities as of the measurement date under current market conditions. Additionally, the entity must have the ability to access the active market and the quoted prices cannot be adjusted by the entity. |
| |
Level 2 | Inputs include quoted prices in active markets for similar assets or liabilities; quoted prices in inactive markets for identical or similar assets or liabilities; or inputs that are observable or can be corroborated by observable market data by correlation or other means for substantially the full-term of the assets or liabilities. |
| |
Level 3 | Unobservable inputs are supported by little or no market activity. The unobservable inputs represent the assumptions that market participants would use to price the assets and liabilities, including risk. Generally, Level 3 assets and liabilities are valued using pricing models, discounted cash flow methodologies, or similar techniques that require significant judgment or estimation. |
Following are descriptions of the valuation methodologies used to measure material assets and liabilities at fair value and details of the valuation models, key inputs to those models and significant assumptions utilized.
Available-for-sale securities. The Company holds AFS securities that are carried at fair value on the consolidated balance sheet and are comprised of CMBS. In determining the fair value of the Company’s CMBS AFS, management judgment may be used to arrive at fair value that considers prices obtained from third-party pricing providers or broker quotes received using the bid price, which are both deemed indicative of market activity, and other applicable market data. The third-party pricing providers and brokers use pricing models that generally incorporate such factors as coupons, primary and secondary mortgage rates, rate reset period, issuer, prepayment speeds, credit enhancements and expected life of the security. If observable market prices are not available or insufficient to determine fair value due principally to illiquidity in the marketplace, then fair value is based upon internally developed models that are primarily based on observable market-based inputs but also include unobservable market data inputs (including prepayment speeds, delinquency levels, and credit losses). The Company classified its CMBS AFS as Level 2 fair value assets at December 31, 2018 and December 31, 2017.
Recurring Fair Value
The following tables display the Company’s assets measured at fair value on a recurring basis. The Company does not hold any liabilities measured at fair value on its consolidated balance sheets.
|
| | | | | | | | | | | | | | | |
| Recurring Fair Value Measurements |
| December 31, 2018 |
(in thousands) | Level 1 | | Level 2 | | Level 3 | | Total |
Assets | | | | | | | |
Available-for-sale securities | $ | — |
| | $ | 12,606 |
| | $ | — |
| | $ | 12,606 |
|
Total assets | $ | — |
| | $ | 12,606 |
| | $ | — |
| | $ | 12,606 |
|
|
| | | | | | | | | | | | | | | |
| Recurring Fair Value Measurements |
| December 31, 2017 |
(in thousands) | Level 1 | | Level 2 | | Level 3 | | Total |
Assets | | | | | | | |
Available-for-sale securities | $ | — |
| | $ | 12,798 |
| | $ | — |
| | $ | 12,798 |
|
Total assets | $ | — |
| | $ | 12,798 |
| | $ | — |
| | $ | 12,798 |
|
The Company may be required to measure certain assets or liabilities at fair value from time to time. These periodic fair value measures typically result from application of certain impairment measures under U.S. GAAP. These items would constitute nonrecurring fair value measures under ASC 820. As of December 31, 2018 and December 31, 2017, the Company did not have any assets or liabilities measured at fair value on a nonrecurring basis in the periods presented.
GRANITE POINT MORTGAGE TRUST INC.
Notes to the Consolidated Financial Statements
Transfers between Levels are deemed to take place on the first day of the reporting period in which the transfer has taken place. The Company did not incur transfers between Levels for the years ended December 31, 2018 and 2017.
Fair Value of Financial Instruments
In accordance with ASC 820, the Company is required to disclose the fair value of financial instruments, both assets and liabilities recognized and not recognized in the consolidated balance sheets, for which fair value can be estimated.
The following describes the Company’s methods for estimating the fair value for financial instruments.
| |
• | Loans held-for-investment are carried at cost, net of any unamortized acquisition premiums or discounts, loan fees and origination costs as applicable, unless deemed impaired. The Company estimates the fair value of its loans held-for-investment by assessing any changes in market interest rates, shifts in credit profiles and actual operating results for mezzanine loans and senior loans, taking into consideration such factors as underlying property type, property competitive position within its market, market and submarket fundamentals, tenant mix, nature of business plan, sponsorship, extent of leverage and other loan terms. The Company categorizes the fair value measurement of these assets as Level 3. |
| |
• | AFS securities are recurring fair value measurements; carrying value equals fair value. See discussion of valuation methods and assumptions within the Fair Value Measurements section of this footnote. |
| |
• | HTM securities, which are comprised of CMBS, are carried at cost, net of any unamortized acquisition premiums or discounts, unless deemed other-than-temporarily impaired. In determining the fair value of the Company’s CMBS HTM, management judgment may be used to arrive at fair value that considers prices obtained from third-party pricing providers or broker quotes received using the bid price, which are both deemed indicative of market activity, and other applicable market data. The third-party pricing providers and brokers use pricing models that generally incorporate such factors as coupons, primary and secondary mortgage rates, rate reset period, issuer, prepayment speeds, credit enhancements and expected life of the security. The Company categorizes the fair value measurement of these assets as Level 2. |
| |
• | Cash and cash equivalents and restricted cash have a carrying value which approximates fair value because of the short maturities of these instruments. The Company categorizes the fair value measurement of these assets as Level 1. |
| |
• | The carrying value of repurchase agreements and revolving credit facilities that mature in less than one year generally approximates fair value due to the short maturities. As of December 31, 2018, the Company held $0.7 billion of repurchase agreements and revolving credit facilities that are considered long-term. The Company’s long-term repurchase agreements and revolving credit facilities have floating rates based on an index plus a spread and the credit spread is typically consistent with those demanded in the market. Accordingly, the interest rates on these borrowings are at market and thus carrying value approximates fair value. The Company categorizes the fair value measurement of these liabilities as Level 2. |
| |
• | Securitized debt obligations are recorded at outstanding principal, net of any unamortized deferred debt issuance costs. In determining the fair value of its securitized debt obligations, management judgment may be used to arrive at fair value that considers prices obtained from third-party pricing providers, broker quotes received and other applicable market data. If observable market prices are not available or insufficient to determine fair value due principally to illiquidity in the marketplace, then fair value is based upon internally developed models that are primarily based on observable market-based inputs but also include unobservable market data inputs (including prepayment speeds, delinquency levels, and credit losses). The Company categorizes the fair value measurement of these liabilities as Level 2. |
| |
• | Convertible senior notes are carried at their unpaid principal balance, net of any unamortized deferred issuance costs. The Company estimates the fair value of its convertible senior notes using the market transaction price nearest to December 31, 2018. The Company categorizes the fair value measurement of these assets as Level 2. |
GRANITE POINT MORTGAGE TRUST INC.
Notes to the Consolidated Financial Statements
The following table presents the carrying values and estimated fair values of assets and liabilities that are required to be recorded or disclosed at fair value at December 31, 2018 and December 31, 2017.
|
| | | | | | | | | | | | | | | |
| December 31, 2018 | | December 31, 2017 |
(in thousands) | Carrying Value | | Fair Value | | Carrying Value | | Fair Value |
Assets | | | | | | | |
Loans held-for-investment | $ | 3,167,913 |
| | $ | 3,200,980 |
| | $ | 2,304,266 |
| | $ | 2,322,259 |
|
Available-for-sale securities | $ | 12,606 |
| | $ | 12,606 |
| | $ | 12,798 |
| | $ | 12,798 |
|
Held-to-maturity securities | $ | 26,696 |
| | $ | 26,611 |
| | $ | 42,169 |
| | $ | 42,797 |
|
Cash and cash equivalents | $ | 91,700 |
| | $ | 91,700 |
| | $ | 107,765 |
| | $ | 107,765 |
|
Restricted cash | $ | 31,723 |
| | $ | 31,723 |
| | $ | 2,953 |
| | $ | 2,953 |
|
Liabilities | | | | | | | |
Repurchase agreements | $ | 1,500,543 |
| | $ | 1,500,543 |
| | $ | 1,521,608 |
| | $ | 1,521,608 |
|
Securitized debt obligations | $ | 654,263 |
| | $ | 654,330 |
| | $ | — |
| | $ | — |
|
Revolving credit facilities | $ | 75,000 |
| | $ | 75,000 |
| | $ | — |
| | $ | — |
|
Convertible senior notes | $ | 268,138 |
| | $ | 270,731 |
| | $ | 121,314 |
| | $ | 125,750 |
|
Note 10. Repurchase Agreements
As of December 31, 2018 and December 31, 2017, the Company had outstanding $1.5 billion and $1.5 billion of repurchase agreements with a weighted average borrowing rate of 4.61% and 3.78% and weighted average remaining maturities of 0.9 and 1.8 years, respectively.
At December 31, 2018 and December 31, 2017, the repurchase agreement balances were as follows:
|
| | | | | | | |
(in thousands) | December 31,
2018 | | December 31,
2017 |
Short-term | $ | 842,078 |
| | $ | 56,546 |
|
Long-term | 658,465 |
| | 1,465,062 |
|
Total | $ | 1,500,543 |
| | $ | 1,521,608 |
|
At December 31, 2018 and December 31, 2017, the repurchase agreements had the following characteristics and remaining maturities:
|
| | | | | | | | | | | | | | | | | | | | | | | |
| December 31, 2018 | | December 31, 2017 |
| Collateral Type | | | | Collateral Type | | |
(dollars in thousands) | Loans | | CMBS (1) | | Total Amount Outstanding | | Loans | | CMBS (1) | | Total Amount Outstanding |
Within 30 days | $ | — |
| | $ | — |
| | $ | — |
| | $ | 22,032 |
| | $ | — |
| | $ | 22,032 |
|
30 to 59 days | — |
| | 25,854 |
| | 25,854 |
| | — |
| | 34,514 |
| | 34,514 |
|
60 to 89 days | — |
| | — |
| | — |
| | — |
| | — |
| | — |
|
90 to 119 days | — |
| | — |
| | — |
| | — |
| | — |
| | — |
|
120 to 364 days | 816,224 |
| | — |
| | 816,224 |
| | — |
| | — |
| | — |
|
One year and over | 658,465 |
| | — |
| | 658,465 |
| | 1,465,062 |
| | — |
| | 1,465,062 |
|
Total | $ | 1,474,689 |
| | $ | 25,854 |
| | $ | 1,500,543 |
| | $ | 1,487,094 |
| | $ | 34,514 |
| | $ | 1,521,608 |
|
Weighted average borrowing rate | 4.61 | % | | 4.78 | % | | 4.61 | % | | 3.78 | % | | 3.77 | % | | 3.78 | % |
____________________
| |
(1) | Includes both AFS securities and HTM securities sold under agreements to repurchase. |
GRANITE POINT MORTGAGE TRUST INC.
Notes to the Consolidated Financial Statements
The following table summarizes assets at carrying values that are pledged or restricted as collateral for the future payment obligations of repurchase agreements:
|
| | | | | | | |
(in thousands) | December 31,
2018 | | December 31,
2017 |
Loans held-for-investment | $ | 2,012,550 |
| | $ | 2,202,049 |
|
Available-for-sale securities, at fair value | 12,606 |
| | 12,798 |
|
Held-to-maturity securities | 26,696 |
| | 42,169 |
|
Restricted cash | 2,922 |
| | 565 |
|
Total | $ | 2,054,774 |
| | $ | 2,257,581 |
|
Although the transactions under repurchase agreements represent committed borrowings until maturity, the respective lender retains the right to mark the underlying collateral to fair value. A reduction in the value of pledged assets due to credit or market events, depending on the agreement, would require the Company to fund margin calls or repurchase the underlying collateral.
The following table summarizes certain characteristics of the Company’s repurchase agreements and counterparty concentration at December 31, 2018 and December 31, 2017:
|
| | | | | | | | | | | | | | | | | | | | | | | | | |
| December 31, 2018 | | December 31, 2017 |
(dollars in thousands) | Amount Outstanding | | Net Counterparty Exposure (1) | | Percent of Equity | | Weighted Average Years to Maturity | | Amount Outstanding | | Net Counterparty Exposure (1) | | Percent of Equity | | Weighted Average Years to Maturity |
Morgan Stanley Bank | $ | 475,474 |
| | $ | 203,274 |
| | 25 | % | | 1.49 | | $ | 425,539 |
| | $ | 250,543 |
| | 30 | % | | 2.49 |
JPMorgan Chase Bank | 481,754 |
| | 168,234 |
| | 20 | % | | 0.47 | | 285,457 |
| | 215,068 |
| | 26 | % | | 1.32 |
Goldman Sachs Bank | 251,785 |
| | 93,651 |
| | 11 | % | | 0.33 | | 252,734 |
| | 86,091 |
| | 10 | % | | 1.33 |
Wells Fargo Bank | 108,539 |
| | 37,090 |
| | 4 | % | | 0.49 | | 424,882 |
| | 128,644 |
| | 16 | % | | 1.49 |
All other counterparties (2) | 182,991 |
| | 55,524 |
| | 7 | % | | 1.49 | | 132,996 |
| | 59,645 |
| | 7 | % | | 2.08 |
Total | $ | 1,500,543 |
| | $ | 557,773 |
| | | | | | $ | 1,521,608 |
| | $ | 739,991 |
| | | | |
____________________
| |
(1) | Represents the net carrying value of the loans held-for-investment, AFS securities and HTM securities sold under agreements to repurchase, including accrued interest plus any cash on deposit to secure the repurchase obligation, less the amount of the repurchase liability, including accrued interest. |
| |
(2) | Represents amounts outstanding with one other counterparty as of December 31, 2018 and two counterparties as of December 31, 2017. |
The Company does not anticipate any defaults by its repurchase agreement counterparties. There can be no assurance, however, that any such default or defaults will not occur.
Note 11. Revolving Credit Facilities
To finance loans held-for-investment, the Company has entered into revolving credit facilities collateralized by the value of the loans pledged. As of December 31, 2018, the Company had outstanding long-term borrowings under revolving credit facilities of $75.0 million with a weighted average borrowing rate of 5.2% and weighted average remaining maturities of 1.3 years. There were no amounts outstanding under revolving credit facilities as of December 31, 2017.
GRANITE POINT MORTGAGE TRUST INC.
Notes to the Consolidated Financial Statements
At December 31, 2018 and December 31, 2017, borrowings under revolving credit facilities had the following remaining maturities:
|
| | | | | | | |
(in thousands) | December 31,
2018 | | December 31,
2017 |
Within 30 days | $ | — |
| | $ | — |
|
30 to 59 days | — |
| | — |
|
60 to 89 days | — |
| | — |
|
90 to 119 days | — |
| | — |
|
120 to 364 days | — |
| | — |
|
One year and over | 75,000 |
| | — |
|
Total | $ | 75,000 |
| | $ | — |
|
Although the transactions under revolving credit facilities represent committed borrowings from the time of funding until maturity, the respective lender retains the right to mark the underlying collateral to fair value. A reduction in the value of pledged assets below a designated threshold would require the Company to provide additional collateral or pay down the facility. As of December 31, 2018, loans held-for-investment with a carrying value of $127.9 million were pledged as collateral for the Company’s future payment obligations under its revolving credit facilities. No loans held-for-investment were pledged to revolving credit facilities as of December 31, 2017. The Company does not anticipate any defaults by its revolving credit facility counterparties, although there can be no assurance that any such default or defaults will not occur.
Note 12. Securitized Debt Obligations
In the second quarter of 2018, the Company financed a pool of its commercial real estate loans through a collateralized loan obligation, or CLO, which is consolidated on the Company’s consolidated financial statements. See Note 3 - Variable Interest Entities for additional information regarding consolidation of the CLO. The securitized debt obligations issued by the CLO are recorded at outstanding principal, net of any unamortized deferred debt issuance costs, on the Company’s consolidated balance sheets. As of December 31, 2018, the outstanding amount due on securitized debt obligations was $654.3 million, net of deferred issuance costs, with a weighted average interest rate of 3.58% and weighted average remaining maturities of 1.7 years.
Note 13. Convertible Senior Notes
In December 2017, the Company closed a private placement of $125.0 million aggregate principal amount of convertible senior notes due 2022. In January 2018, an additional $18.8 million in notes were issued by the Company in connection with the exercise of the initial purchaser’s option. The net proceeds from the offering were approximately $139.5 million after deducting underwriting discounts and expenses. The notes are unsecured, pay interest semiannually at a rate of 5.625% per annum and are convertible at the option of the holder into shares of the Company’s common stock. The notes will mature in December 2022, unless earlier converted or repurchased in accordance with their terms. The Company does not have the right to redeem the notes prior to maturity, but may be required to repurchase the notes from holders under certain circumstances. As of December 31, 2018, the notes had a conversion rate of 50.1610 shares of common stock per $1,000 principal amount of the notes.
In October 2018, the Company closed an underwritten public offering of $131.6 million aggregate principal amount of convertible senior notes due 2023. The net proceeds from the offering were approximately $127.7 million after deducting underwriting discounts and expenses. The notes are unsecured, pay interest semiannually at a rate of 6.375% per annum and are convertible at the option of the holder into shares of the Company’s common stock. The notes will mature in October 2023, unless earlier converted or repurchased in accordance with their terms. The Company does not have the right to redeem the notes prior to maturity, but may be required to repurchase the notes from holders under certain circumstances. As of December 31, 2018, the notes had a conversion rate of 48.8496 shares of common stock per $1,000 principal amount of the notes.
The outstanding amount due on convertible senior notes as of December 31, 2018 and December 31, 2017 was $268.1 million and $121.3 million, respectively, net of deferred issuance costs.
GRANITE POINT MORTGAGE TRUST INC.
Notes to the Consolidated Financial Statements
Note 14. Commitments and Contingencies
The following represent the material commitments and contingencies of the Company as of December 31, 2018:
Management agreement. Upon the closing the IPO on June 28, 2017, the Company entered into a management agreement with the Manager. The Company pays the Manager a base management fee equal to 1.5% of the Company’s equity on an annualized basis, as defined in the management agreement. For purposes of calculating the management fee, equity means the sum of the net proceeds received by the Company from all issuances of its equity securities, plus its cumulative “core earnings” at the end of the most recently completed calendar quarter, less any distributions to stockholders, any amount that the Company has paid to repurchase its stock, and any incentive fees earned by the Manager, but excluding the incentive fee earned in the current quarter. As a result, equity for purposes of calculating the management fee may differ from the amount of stockholders’ equity shown in the Company’s financial statements.
Beginning in the fourth quarter of 2018, incentive fees, if earned, will be payable to the Manager, as defined in the management agreement. The incentive fee will be the excess of (1) the product of (a) 20% and (b) the result of (i) the Company’s “core earnings” for the previous 12-month period, minus (ii) the product of (A) the Company’s equity in the previous 12-month period, and (B) 8% per annum, less (2) the sum of any incentive fees paid to the Manager with respect to the first three calendar quarters of such previous 12-month period; provided, however, that no incentive fees are payable with respect to any calendar quarter unless “core earnings” for the 12 most recently completed calendar quarters in the aggregate is greater than zero.
In addition, under the terms of an amendment to the management agreement entered into in the fourth quarter of 2018, the Manager agreed to reimburse the Company an amount related to the compensation payable to the sales agents under the Company’s equity distribution agreement by netting such amount from the base management fee payable to the Manager for the applicable quarterly period.
For purposes of calculating base management and incentive fees, “core earnings” means net income (loss) attributable to common stockholders, excluding non-cash equity compensation expense, incentive fees earned by the Manager, depreciation and amortization, any unrealized gains or losses or other similar non-cash items that are included in net income for the applicable period (regardless of whether such items are included in other comprehensive income or loss or in net income), and one-time events pursuant to changes in U.S. GAAP and certain material non-cash income or expense items, in each case after discussions between the Manager and the Company’s independent directors and approved by a majority of the Company’s independent directors.
The initial term of the management agreement expires on June 28, 2020, and thereafter will automatically renew for successive one-year terms annually until terminated in accordance with the terms of the agreement. Upon termination of the management agreement by the Company without cause or by the Manager due to the Company’s material breach of the management agreement, the Company is required to pay a termination fee equal to three times the sum of the average annual base management fee and average annual incentive compensation, in each case earned by the Manager during the 24-month period immediately preceding the date of termination, calculated as of the end of the most recently completed fiscal quarter prior to the date of termination.
Employment contracts. The Company does not directly employ any personnel. Instead, the Company relies on the resources of the Manager and its affiliates to conduct the Company’s operations.
Operating leases. As of December 31, 2018, the Company was obligated under non-cancelable operating leases for office space. Future minimum rental payments, including escalation clauses, under leases with terms of one year or more at December 31, 2018 were as follows:
|
| | | | |
(in thousands) |
Year | | Minimum Payment |
2019 | | $ | 694 |
|
2020 | | 849 |
|
2021 | | 849 |
|
2022 | | 869 |
|
2023 | | 896 |
|
Thereafter | | 1,858 |
|
Total | | $ | 6,015 |
|
GRANITE POINT MORTGAGE TRUST INC.
Notes to the Consolidated Financial Statements
Expenses under the lease agreements were $0.7 million, $0.6 million and $0.3 million for the years ended December 31, 2018, 2017 and 2016, respectively.
Legal and regulatory. From time to time, the Company may be subject to liability under laws and government regulations and various claims and legal actions arising in the ordinary course of business. Liabilities are established for legal claims when payments associated with the claims become probable and the costs can be reasonably estimated. The actual costs of resolving legal claims may be substantially higher or lower than the amounts established for those claims. Based on information currently available, management is not aware of any legal or regulatory claims that would have a material effect on the Company’s consolidated financial statements and therefore no accrual is required as of December 31, 2018.
Unfunded commitments on loans held-for-investment. Certain of the Company’s commercial real estate loan agreements contain provisions for future fundings to borrowers, generally to finance lease-related or capital expenditures. As of December 31, 2018 and December 31, 2017, the Company had unfunded commitments of $626.2 million and $339.2 million on loans held-for-investment with expirations dates within the next three years.
Note 15. Preferred Stock
In connection with the Formation Transaction, the Company issued 1,000 shares of its 10% cumulative redeemable preferred stock to Two Harbors, which immediately sold such preferred stock to an unaffiliated third-party investor. The preferred stock ranks senior to the rights of holders of the Company’s common stock, but junior to all other classes or series of preferred stock that may be issued. The holders of the preferred stock are entitled to receive, when, as and if authorized and declared by the Company, cumulative cash dividends at the rate of 10% per annum of the $1,000 liquidation preference per share of the preferred stock. Such dividends accrue on a daily basis and are cumulative from and including the initial issue date of the preferred stock.
The Company has the option at any time after five years from the initial issue date to redeem the preferred stock at a redemption price of $1,000 per share, plus any accrued and unpaid dividends. At any time after six years from the initial issue date, the Company will, at the request of any preferred stockholder, repurchase the holder’s preferred stock at a price of $1,000 per share, plus any accrued and unpaid dividends. During the years ended December 31, 2018 and 2017, the Company declared dividends to the preferred stockholder of $100,000 and $50,556, respectively.
Note 16. Stockholders’ Equity
Common Stock
On June 28, 2017, the Company completed the IPO of 10,000,000 shares of its common stock at a price of $19.50 per share, for gross proceeds of $195.0 million. Net proceeds to the Company were approximately $181.9 million, after accounting for issuance costs of approximately $13.1 million. Concurrently with the closing of the IPO, the Company issued 33,071,000 shares of its common stock to Two Harbors in exchange for the equity interests in the Predecessor, which became the Company’s wholly owned indirect subsidiary as a result of the transaction. On November 1, 2017, Two Harbors distributed to its common stockholders the 33,071,000 shares of the Company’s common stock it had acquired in connection with the Formation Transaction, allowing the Company’s market capitalization to be fully floating.
As of December 31, 2018, the Company had 43,621,174 shares of common stock outstanding. The following table presents a reconciliation of the common shares outstanding for the years ended December 31, 2018 and 2017:
|
| | |
| Number of common shares |
Common shares outstanding, December 31, 2016 | — |
|
Issuance of common stock | 43,071,000 |
|
Issuance of restricted stock (1) | 164,103 |
|
Common shares outstanding, December 31, 2017 | 43,235,103 |
|
Issuance of common stock | 164,940 |
|
Issuance of restricted stock (1) | 221,131 |
|
Common shares outstanding, December 31, 2018 | 43,621,174 |
|
____________________
| |
(1) | Represents shares of restricted stock granted under the 2017 Equity Incentive Plan, of which 321,134 restricted shares remained subject to vesting requirements at December 31, 2018. |
GRANITE POINT MORTGAGE TRUST INC.
Notes to the Consolidated Financial Statements
Distributions to Stockholders
The following table presents cash dividends declared by the Company on its common stock since its IPO and Formation Transaction:
|
| | | | | | | | |
Declaration Date | | Record Date | | Payment Date | | Cash Dividend Per Share |
December 19, 2018 | | December 31, 2018 | | January 18, 2019 | | $ | 0.42 |
|
September 20, 2018 | | October 2, 2018 | | October 18, 2018 | | $ | 0.42 |
|
June 20, 2018 | | July 2, 2018 | | July 18, 2018 | | $ | 0.40 |
|
March 15, 2018 | | March 29, 2018 | | April 18, 2018 | | $ | 0.38 |
|
December 18, 2017 | | December 29, 2017 | | January 18, 2018 | | $ | 0.38 |
|
September 18, 2017 | | September 29, 2017 | | October 18, 2017 | | $ | 0.32 |
|
Share Repurchase Program
On November 21, 2018, the Company's Board of Directors authorized a Share Repurchase Program, which allows the Company to repurchase up to 2,000,000 shares of its common stock. The shares are expected to be repurchased from time to time through privately negotiated transactions or open market transactions, including pursuant to a trading plan in accordance with Rules 10b5-1 and 10b-18 under the Securities Exchange Act of 1934, as amended, or by any combination of such methods. The manner, price, number and timing of share repurchases will be subject to a variety of factors, including market conditions and applicable Securities and Exchange Commission rules. The Company did not repurchase any of its common stock during the fiscal year ended December 31, 2018.
At-the-Market Offering
On November 21, 2018, the Company entered into an equity distribution agreement under which the Company may sell up to an aggregate of 8,000,000 shares of its common stock from time to time in any method permitted by law deemed to be an “at the market” offering as defined in Rule 415 under the Securities Act. During the year ended December 31, 2018, the Company sold 164,940 shares of common stock under the equity distribution agreement for total accumulated net proceeds of approximately $3.1 million and received base management fee reimbursements from the Manager of approximately $0.22 per share of common stock sold under the equity distribution agreement.
Accumulated Other Comprehensive Loss
Accumulated other comprehensive loss at December 31, 2018 and December 31, 2017 was as follows:
|
| | | | | | | |
(in thousands) | December 31,
2018 | | December 31,
2017 |
Available-for-sale securities | | | |
Unrealized gains | $ | — |
| | $ | — |
|
Unrealized losses | (192 | ) | | — |
|
Accumulated other comprehensive loss | $ | (192 | ) | | $ | — |
|
Reclassifications out of Accumulated Other Comprehensive Income
The Company did not record any reclassifications out of accumulated other comprehensive income during the years ended December 31, 2018, 2017 and 2016.
GRANITE POINT MORTGAGE TRUST INC.
Notes to the Consolidated Financial Statements
Note 17. Equity Incentive Plan
The Company’s Plan provides incentive compensation to attract and retain qualified directors, officers, advisors, consultants and other personnel, including certain personnel of the Manager and its affiliates. The Plan is administered by the compensation committee of the Company’s board of directors. The compensation committee has the full authority to administer and interpret the Plan, to authorize the granting of awards, to determine the eligibility of directors, officers, advisors, consultants and other personnel, including personnel of the Manager and its affiliates, to receive an award, to determine the number of shares of common stock to be covered by each award (subject to the individual participant limitations provided in the Plan), to determine the terms, provisions and conditions of each award (which may not be inconsistent with the terms of the Plan), to prescribe the form of instruments evidencing awards and to take any other actions and make all other determinations that it deems necessary or appropriate in connection with the Plan or the administration or interpretation thereof. In connection with this authority, the compensation committee may, among other things, establish performance goals that must be met in order for awards to be granted or to vest, or for the restrictions on any such awards to lapse.
The Plan provides for grants of restricted common stock, phantom shares, dividend equivalent rights and other equity-based awards, subject to a ceiling of 3,242,306 shares available for issuance under the Plan. The Plan allows for the Company’s board of directors to expand the types of awards available under the Plan to include long-term incentive plan units in the future. If an award granted under the Plan expires or terminates, the shares subject to any portion of the award that expires or terminates without having been exercised or paid, as the case may be, will again become available for the issuance of additional awards. Unless earlier terminated by the Company’s board of directors, no new award may be granted under the Plan after the tenth anniversary of the date that such Plan was initially approved by the Company’s board of directors. No award may be granted under the Plan to any person who, assuming payment of all awards held by such person, would own or be deemed to own more than 9.8% of the outstanding shares of the Company’s common stock.
During the years ended December 31, 2018 and 2017, the Company granted 19,175 and 14,103 shares of common stock, respectively, to its independent directors as compensation for their service on the Company’s board of directors, pursuant to the terms of the Plan. The estimated fair value of these awards was $17.86 and $19.47 per share on grant date, based on the closing price of the Company’s common stock on the NYSE on such date. The shares issued in 2017 vested immediately, and the shares issued in 2018 have a one year vesting period.
Additionally, during the years ended December 31, 2018 and 2017, the Company granted 201,956 and 150,000 shares of restricted common stock, respectively, to key employees of the Manager and its affiliates pursuant to the terms of the Plan and the associated award agreements. The estimated fair value of these awards was $17.33 and $19.50 per share on grant date, based on the closing market price of the Company’s common stock on the NYSE on such date. However, as the cost of these awards is measured at fair value at each reporting date based on the price of the Company’s stock as of period end in accordance with ASC 505, Equity, or ASC 505, the fair value of these awards as of December 31, 2018 was $18.03 per share based on the closing market price of the Company’s common stock on the NYSE on such date. The shares underlying the grants vest in three equal annual installments commencing on the first anniversary of the grant date, as long as the grantee complies with the terms and conditions of his or her applicable restricted stock award agreement.
The following table summarizes the activity related to restricted common stock for the years ended December 31, 2018 and 2017:
|
| | | | | | | | | | | | | |
| Year Ended December 31, |
| 2018 | | 2017 |
| Shares | | Weighted Average Grant Date Fair Market Value | | Shares | | Weighted Average Grant Date Fair Market Value |
Outstanding at Beginning of Period | 150,000 |
| | $ | 19.50 |
| | — |
| | $ | — |
|
Granted | 221,131 |
| | 17.38 |
| | 164,103 |
| | 19.50 |
|
Vested | (49,997 | ) | | (19.50 | ) | | (14,103 | ) | | (19.47 | ) |
Forfeited | — |
| | — |
| | — |
| | — |
|
Outstanding at End of Period | 321,134 |
| | $ | 18.04 |
| | 150,000 |
| | $ | 19.50 |
|
For the years ended December 31, 2018 and 2017, the Company recognized compensation related to restricted common stock of $3.5 million and $1.1 million, respectively.
GRANITE POINT MORTGAGE TRUST INC.
Notes to the Consolidated Financial Statements
Note 18. Income Taxes
The Company has completed its determination of the accounting implications of the TCJA on its tax accruals, and there is no impact recorded to the 2018 financial statements.
The Company has elected to be taxed as a REIT under the Code for U.S. federal income tax purposes. As long as the Company qualifies as a REIT, the Company generally will not be subject to U.S. federal income taxes on its taxable income to the extent it annually distributes its net taxable income to stockholders, and does not engage in prohibited transactions. The Company intends to distribute 100% of its REIT taxable income and comply with all requirements to continue to qualify as a REIT. The majority of states also recognize the Company’s REIT status. The Company’s TRS files a separate tax return and is fully taxed as a standalone U.S. C-corporation. It is assumed that the Company will retain its REIT status and will incur no REIT level taxation as it intends to comply with the REIT regulations and annual distribution requirements.
The following table summarizes the tax provision recorded at the taxable subsidiary level for the years ended December 31, 2018, 2017 and 2016:
|
| | | | | | | | | | | |
| Year Ended
December 31, |
(in thousands) | 2018 | | 2017 | | 2016 |
Current tax (benefit) provision: | | | | | |
Federal | $ | (1 | ) | | $ | (6 | ) | | $ | (14 | ) |
State | 2 |
| | 2 |
| | 3 |
|
Total current tax (benefit) provision | 1 |
| | (4 | ) |
| (11 | ) |
Deferred tax benefit | (3 | ) | | — |
| | — |
|
Total benefit from income taxes | $ | (2 | ) | | $ | (4 | ) | | $ | (11 | ) |
The Company’s taxable income before dividend distributions differs from its pre-tax net income for U.S. GAAP purposes primarily due differences in timing of income recognition due to the calculations surrounding market discount and original issue discount as well as amendments to loans treated as “significant modifications” for tax under applicable Treasury regulations. These book to tax differences in the REIT are not reflected in the consolidated financial statements as the Company assumes it will retain its REIT status.
The following is a reconciliation of the statutory federal and state rates to the effective rates, for the years ended December 31, 2018, 2017 and 2016:
|
| | | | | | | | | | | | | | | | | | | | |
| Year Ended |
| December 31, |
| 2018 | | 2017 | | 2016 |
(dollars in thousands) | Amount | | Percent | | Amount | | Percent | | Amount | | Percent |
Computed income tax expense at federal rate | $ | 13,245 |
| | 21 | % | | $ | 18,656 |
| | 35 | % | | $ | 12,371 |
| | 35 | % |
State taxes, net of federal benefit, if applicable | 1 |
| | — | % | | 1 |
| | — | % | | 2 |
| | — | % |
Permanent differences in taxable income from GAAP net income | (94 | ) | | — | % | | 12 |
| | — | % | | (9 | ) | | — | % |
Dividends paid deduction | (13,154 | ) | | (21 | )% | | (18,673 | ) | | (35 | )% | | (12,375 | ) | | (35 | )% |
Benefit from income taxes/ Effective Tax Rate(1) | $ | (2 | ) | | — | % | | $ | (4 | ) | | — | % | | $ | (11 | ) | | — | % |
____________________
| |
(1) | The benefit from income taxes is recorded at the taxable subsidiary level. |
The Company’s permanent differences in taxable income from GAAP net income attributable to common stockholders in the years ended December 31, 2018, 2017 and 2016 were primarily due a recurring difference in compensation expense related to restricted stock dividends.
GRANITE POINT MORTGAGE TRUST INC.
Notes to the Consolidated Financial Statements
Based on the Company’s evaluation, it has been concluded that there are no significant uncertain tax positions requiring recognition in the Company’s consolidated financial statements of a contingent tax liability for uncertain tax positions. Additionally, there were no amounts accrued for penalties or interest as of or during the periods presented in these consolidated financial statements.
Note 19. Earnings Per Share
The Company has calculated earnings per share only for the period common stock was outstanding, referred to as the post-formation period. The Company has defined the post-formation period to be the period beginning on June 28, 2017, the date the Company commenced operations as a publicly traded company, and thereafter. Earnings per share is calculated by dividing the net income for the post-formation period by the weighted average number of shares outstanding during the post-formation period.
The following table presents a reconciliation of the earnings and shares used in calculating basic and diluted earnings per share for the years ended December 31, 2018, 2017 and 2016:
|
| | | | | | | | | | | |
| Year Ended |
| December 31, |
(in thousands, except share data) | 2018 | | 2017 | | 2016 |
Numerator: | | | | | |
Net income attributable to common stockholders - basic | $ | 62,975 |
| | $ | 25,773 |
| | $ | — |
|
Interest expense attributable to convertible notes (1) | 10,742 |
| | — |
| | — |
|
Net income attributable to common stockholders - diluted | $ | 73,717 |
| | $ | 25,773 |
| | $ | — |
|
Denominator: | | | | | |
Weighted average common shares outstanding | 43,123,222 |
| | 43,084,671 |
| | — |
|
Weighted average restricted stock shares | 322,162 |
| | 150,000 |
| | — |
|
Basic weighted average shares outstanding | 43,445,384 |
| | 43,234,671 |
| | — |
|
Effect of dilutive shares issued in an assumed conversion of the convertible senior notes | 8,594,613 |
| | — |
| | — |
|
Diluted weighted average shares outstanding | 52,039,997 |
| | 43,234,671 |
| | — |
|
Earnings Per Share | | | | | |
Basic | $ | 1.45 |
| | $ | 0.60 |
| | $ | — |
|
Diluted | $ | 1.42 |
| | $ | 0.60 |
| | $ | — |
|
____________________
| |
(1) | Includes a nondiscretionary adjustment for the assumed change in the management fee calculation. |
For the year ended December 31, 2017, excluded from the calculation of diluted earnings per share is the effect of adding back $0.4 million of interest expense, net of a nondiscretionary adjustment for the assumed change in the management fee calculation, and 668,449 weighted average common share equivalents related to the assumed conversion of the Company’s convertible senior notes, as their inclusion would be antidilutive.
GRANITE POINT MORTGAGE TRUST INC.
Notes to the Consolidated Financial Statements
Note 20. Related Party Transactions
The following summary provides disclosure of the material transactions with affiliates of the Company.
The Company does not have any employees and is externally managed by the Manager under the terms of a management agreement entered into in connection with closing of the IPO and Formation Transaction on June 28, 2017. Under the management agreement, the Manager and its affiliates provide the Company with the personnel and resources necessary to operate the Company’s business. In exchange, the Company pays the Manager a base management fee that is equal to 1.5% of the Company’s equity on an annualized basis as well as an incentive fee, which is payable, if earned, beginning in the fourth quarter of 2018, in accordance with the terms of the management agreement. For purposes of calculating the management fee, equity is adjusted to exclude any common stock repurchases as well as any unrealized gains, losses or other items that do not affect realized net income (loss), among other adjustments, in accordance with the management agreement. In addition, under the terms of an amendment to the management agreement entered into in the fourth quarter of 2018, the Manager agreed to reimburse the Company an amount related to the compensation payable to the sales agents under the Company’s equity distribution agreement by netting such amount from the base management fee payable to the Manager for the applicable quarterly period. The Company incurred $12.5 million and $6.3 million as a management fee to the Manager for the years ended December 31, 2018 and 2017, respectively. See further discussion of the base management fee and incentive fee calculations in Note 14 - Commitments and Contingencies.
Prior to the IPO and Formation Transaction, the Predecessor was allocated its proportionate share of management fees incurred by Two Harbors under the management agreement that Two Harbors has with PRCM Advisers. Under its management agreement with PRCM Advisers as in effect during the relevant period, Two Harbors paid PRCM Advisers a base management fee equal to 1.5% of its adjusted equity on an annualized basis. The Predecessor was allocated management fees incurred by Two Harbors of $3.4 million for the period from January 1, 2017 through June 27, 2017 and $7.2 million for the year ended December 31, 2016.
During the years ended December 31, 2018 and 2017, the Company reimbursed the Manager for certain direct and allocated costs incurred by the Manager on behalf of the Company. These direct and allocated costs totaled approximately $8.6 million and $2.2 million, respectively. In addition, during the years ended December 31, 2017 and 2016, certain direct and allocated operating expenses were paid by Two Harbors to PRCM Advisers and other third-party vendors and included in the Company’s consolidated statements of comprehensive income. These direct and allocated costs totaled approximately $4.5 million and $6.9 million for the years ended December 31, 2017 and 2016, respectively. Expenses during the period may have been different had the Predecessor not been a subsidiary of Two Harbors during those periods.
The Company has contractual relationships with the majority of its third-party vendors and pays those vendors directly. The Company will continue to have certain costs allocated to it by the Manager under the management agreement for compensation, data services, technology and certain office lease payments.
The Company recognized $3.5 million and $1.1 million of compensation during the years ended December 31, 2018 and 2017 related to restricted common stock issued to employees of the Manager and the Company’s independent directors pursuant to the Plan. See Note 17 - Equity Incentive Plan for additional information.
During the years ended December 31, 2017 and 2016, the Company financed certain of its loans held-for-investment through a revolving note payable to TH Insurance Holdings Company LLC, or TH Insurance, a captive insurance company and indirect subsidiary of Two Harbors and a member of the Federal Home Loan Bank of Des Moines, or the FHLB. In exchange for the note with TH Insurance, the Company received an allocated portion of TH Insurance’s advances from the FHLB and pledged to the FHLB a portion of its loans held-for-investment as collateral for TH Insurance’s advances. The affiliate note payable reflected terms consistent with TH Insurance’s FHLB advances. During 2017, the note payable to TH Insurance was in effect to assist with cash management and operational processes as the investments in the Company’s portfolio pledged to the FHLB were released and transitioned to its repurchase facilities. The affiliate note payable matured on October 27, 2017 and was repaid in full.
The terms of these transactions may have been different had they been transacted with an unrelated third-party.
Note 21. Subsequent Events
On February 5, 2019, the Company closed an underwritten public offering of 6,850,000 shares of its common stock. The Company received total proceeds from the offering of approximately $130.0 million. In addition, the Company granted the underwriters a thirty-day option to purchase up to an additional 1,027,500 shares of its common stock.
Events subsequent to December 31, 2018, were evaluated through the date these financial statements were issued and no other additional events were identified requiring further disclosure in these consolidated financial statements.
GRANITE POINT MORTGAGE TRUST INC.
Notes to the Consolidated Financial Statements
Note 22. Quarterly Financial Data - Unaudited
|
| | | | | | | | | | | | | | | |
| 2018 Quarter Ended |
(in thousands, except share data) | March 31 | | June 30 | | September 30 | | December 31 |
| | | | | | | |
Total interest income | $ | 39,977 |
| | $ | 43,509 |
| | $ | 47,560 |
| | $ | 52,834 |
|
Total interest expense | 18,373 |
| | 21,235 |
| | 23,365 |
| | 28,550 |
|
Net interest income | 21,604 |
| | 22,274 |
| | 24,195 |
| | 24,284 |
|
Total other income | 882 |
| | 564 |
| | — |
| | — |
|
Total expenses | 7,899 |
| | 7,613 |
| | 7,631 |
| | 7,587 |
|
Provision for (benefit from) income taxes | 1 |
| | (2 | ) | | (1 | ) | | — |
|
Dividends on preferred stock | 25 |
| | 25 |
| | 25 |
| | 25 |
|
Net income | $ | 14,561 |
| | $ | 15,202 |
| | $ | 16,540 |
| | $ | 16,672 |
|
Basic earnings per weighted average common share (See Note 19) | $ | 0.34 |
| | $ | 0.35 |
| | $ | 0.38 |
| | $ | 0.38 |
|
Diluted earnings per weighted average common share (See Note 19) | $ | 0.33 |
| | $ | 0.34 |
| | $ | 0.37 |
| | $ | 0.37 |
|
Basic weighted average number of shares of common stock | 43,374,228 |
| | 43,446,963 |
| | 43,456,234 |
| | 43,502,583 |
|
Diluted weighted average number of shares of common stock | 50,467,978 |
| | 50,634,463 |
| | 50,651,612 |
| | 56,264,771 |
|
|
| | | | | | | | | | | | | | | |
| 2017 Quarter Ended |
(in thousands, except share data) | March 31 | | June 30 | | September 30 | | December 31 |
| | | | | | | |
Total interest income | $ | 23,818 |
| | $ | 26,100 |
| | $ | 30,864 |
| | $ | 37,055 |
|
Total interest expense | 6,106 |
| | 7,773 |
| | 12,497 |
| | 16,087 |
|
Net interest income | 17,712 |
| | 18,327 |
| | 18,367 |
| | 20,968 |
|
Total other income | — |
| | — |
| | — |
| | — |
|
Total expenses | 4,257 |
| | 4,132 |
| | 6,851 |
| | 6,833 |
|
Provision for (benefit from) income taxes | 1 |
| | (2 | ) | | (2 | ) | | (1 | ) |
Dividends on preferred stock | — |
| | — |
| | 25 |
| | 25 |
|
Net income | $ | 13,454 |
| | $ | 14,197 |
| | $ | 11,493 |
| | $ | 14,111 |
|
Basic earnings per weighted average common share (See Note 18) | $ | — |
| | $ | — |
| | $ | 0.27 |
| | $ | 0.33 |
|
Diluted earnings per weighted average common share (See Note 18) | $ | — |
| | $ | — |
| | $ | 0.27 |
| | $ | 0.33 |
|
Basic weighted average number of shares of common stock | — |
| | 43,234,205 |
| | 43,234,254 |
| | 43,235,103 |
|
Diluted weighted average number of shares of common stock | — |
| | 43,234,205 |
| | 43,234,254 |
| | 43,235,103 |
|
GRANITE POINT MORTGAGE TRUST INC.
SCHEDULE IV - MORTGAGE LOANS ON REAL ESTATE
As of December 31, 2018
(dollars in thousands)
|
| | | | | | | | | | | | | | | | | | | | | | | |
Asset Type/ Location | | Interest Rate | | Final Maturity Date (1) | | Periodic Payment Terms (2) | | Prior Liens (3) | | Face Amount | | Carrying Amount | | Principal Amount Subject to Delinquent Principal or Interest |
Loans held-for-investment | | | | | | | | |
Retail/West | | L +3.34% |
| | 7/2020 | | IO | | $ | — |
| | $ | 112,891 |
| | $ | 111,493 |
| | $ | — |
|
Office/Northeast | | L +4.45% |
| | 10/2020 | | IO | | — |
| | 108,048 |
| | 107,257 |
| | — |
|
Office/Various | | L +4.45% |
| | 8/2020 | | P&I | | — |
| | 108,687 |
| | 108,031 |
| | — |
|
Mixed-Use/Southwest | | L +3.65% |
| | 12/2020 | | IO | | — |
| | 119,902 |
| | 119,802 |
| | — |
|
Mixed-Use/Northeast | | L +3.75% |
| | 1/2022 | | IO | | — |
| | 26,974 |
| | 25,960 |
| | — |
|
Industrial/Northeast | | L +3.70% |
| | 4/2019 | | IO | | — |
| | 89,000 |
| | 89,000 |
| | — |
|
Office/Northeast | | L +3.50% |
| | 5/2021 | | IO | | — |
| | 79,144 |
| | 78,386 |
| | — |
|
Office/West | | L +3.25% |
| | 11/2019 | | IO | | — |
| | 58,968 |
| | 58,646 |
| | — |
|
Office/Northeast | | L +4.07% |
| | 10/2021 | | IO | | — |
| | 44,593 |
| | 44,232 |
| | — |
|
Hotel/Southwest | | L +4.45% |
| | 12/2020 | | IO | | — |
| | 68,778 |
| | 68,165 |
| | — |
|
Retail/West | | L +3.87% |
| | 7/2020 | | IO | | — |
| | 58,199 |
| | 57,950 |
| | — |
|
Office/West | | L +4.10% |
| | 12/2020 | | IO | | — |
| | 60,798 |
| | 60,310 |
| | — |
|
Office/Northeast | | L +3.95% |
| | 9/2020 | | P&I | | — |
| | 63,510 |
| | 63,053 |
| | — |
|
Hotel/Southeast | | L +3.78% |
| | 5/2021 | | IO | | — |
| | 64,000 |
| | 63,461 |
| | — |
|
Office/Southeast | | L +3.30% |
| | 1/2021 | | IO | | — |
| | 62,275 |
| | 61,225 |
| | — |
|
Office/Southwest | | L +2.90% |
| | 12/2021 | | IO | | — |
| | 42,825 |
| | 42,268 |
| | — |
|
Industrial/West | | L +4.50% |
| | 1/2020 | | IO | | — |
| | 44,588 |
| | 44,348 |
| | — |
|
Office/Southeast | | L +4.75% |
| | 2/2021 | | P&I | | — |
| | 56,200 |
| | 55,784 |
| | — |
|
Office/Northeast | | L +4.55% |
| | 12/2019 | | P&I | | — |
| | 46,568 |
| | 46,460 |
| | — |
|
Industrial/Northeast | | L +4.38% |
| | 10/2020 | | IO | | — |
| | 53,132 |
| | 52,795 |
| | — |
|
Industrial/Northeast | | L +2.70% |
| | 10/2021 | | IO | | — |
| | 47,484 |
| | 47,096 |
| | — |
|
Hotel/West | | L +4.70% |
| | 5/2020 | | IO | | — |
| | 36,000 |
| | 35,702 |
| | — |
|
Office/Northeast | | L +4.65% |
| | 1/2020 | | IO | | — |
| | 50,160 |
| | 50,160 |
| | — |
|
Office/Northeast | | L +4.75% |
| | 12/2019 | | IO | | — |
| | 51,435 |
| | 51,230 |
| | — |
|
Multifamily/Midwest | | L +2.99% |
| | 12/2021 | | IO | | — |
| | 51,000 |
| | 50,514 |
| | — |
|
Office/Midwest | | L +3.25% |
| | 10/2021 | | IO | | — |
| | 19,156 |
| | 18,766 |
| | — |
|
Multifamily/Southwest | | L +3.60% |
| | 5/2021 | | IO | | — |
| | 49,698 |
| | 49,299 |
| | — |
|
Multifamily/Midwest | | L +4.15% |
| | 11/2021 | | IO | | — |
| | 15,000 |
| | 14,616 |
| | — |
|
Industrial/Northeast | | L +2.93% |
| | 12/2021 | | IO | | — |
| | 40,800 |
| | 40,373 |
| | — |
|
Office/Southwest | | L +3.78% |
| | 2/2021 | | IO | | — |
| | 46,002 |
| | 45,727 |
| | — |
|
Mixed-Use/Northeast | | L +4.38% |
| | 1/2021 | | IO | | — |
| | 30,953 |
| | 30,558 |
| | — |
|
Multifamily/Southwest | | L +3.65% |
| | 9/2020 | | IO | | — |
| | 40,478 |
| | 40,062 |
| | — |
|
Mixed-Use/Northeast | | L +4.07% |
| | 5/2021 | | IO | | — |
| | 29,883 |
| | 29,564 |
| | — |
|
Hotel/West | | L +3.60% |
| | 7/2021 | | IO | | — |
| | 41,000 |
| | 40,626 |
| | — |
|
Hotel/West | | L +4.50% |
| | 7/2020 | | IO | | — |
| | 45,000 |
| | 44,686 |
| | — |
|
Multifamily/Southwest | | L +2.93% |
| | 9/2021 | | IO | | — |
| | 38,326 |
| | 38,026 |
| | — |
|
Multifamily/Midwest | | L +4.24% |
| | 11/2020 | | IO | | — |
| | 40,000 |
| | 39,771 |
| | — |
|
Mixed-Use/West | | L +4.54% |
| | 12/2021 | | IO | | — |
| | 16,223 |
| | 15,829 |
| | — |
|
Office/Northeast | | L +3.55% |
| | 6/2021 | | IO | | — |
| | 32,012 |
| | 31,750 |
| | — |
|
Office/Northeast | | L +7.76% |
| | 7/2019 | | IO | | — |
| | 33,470 |
| | 33,100 |
| | — |
|
|
| | | | | | | | | | | | | | | | | | | | | | | |
Asset Type/ Location | | Interest Rate | | Final Maturity Date (1) | | Periodic Payment Terms (2) | | Prior Liens (3) | | Face Amount | | Carrying Amount | | Principal Amount Subject to Delinquent Principal or Interest |
Office/West | | L +3.90% |
| | 1/2021 | | IO | | — |
| | 31,781 |
| | 31,493 |
| | — |
|
Multifamily/Northeast | | L +4.27% |
| | 12/2019 | | IO | | — |
| | 34,400 |
| | 34,198 |
| | — |
|
Industrial/Northeast | | L +2.85% |
| | 11/2021 | | IO | | — |
| | 29,404 |
| | 28,972 |
| | — |
|
Office/Southwest | | L +5.00% |
| | 5/2020 | | IO | | — |
| | 28,563 |
| | 28,308 |
| | — |
|
Hotel/Midwest | | L +4.07% |
| | 7/2021 | | IO | | — |
| | 16,754 |
| | 16,510 |
| | — |
|
Multifamily/Midwest | | L +2.92% |
| | 1/2023 | | IO | | — |
| | 26,885 |
| | 26,621 |
| | — |
|
Office/Southwest | | L +4.05% |
| | 10/2020 | | IO | | — |
| | 21,895 |
| | 21,716 |
| | — |
|
Office/Southwest | | L +4.40% |
| | 5/2020 | | IO | | — |
| | 27,582 |
| | 27,385 |
| | — |
|
Office/Northeast | | 5.11 | % | | 3/2026 | | P&I | | — |
| | 33,800 |
| | 33,649 |
| | — |
|
Office/West | | L +4.55% |
| | 10/2019 | | IO | | — |
| | 27,184 |
| | 27,093 |
| | — |
|
Office/Southeast | | L +3.50% |
| | 5/2021 | | P&I | | — |
| | 28,569 |
| | 28,414 |
| | — |
|
Multifamily/Northeast | | L +4.10% |
| | 7/2020 | | IO | | — |
| | 30,000 |
| | 29,854 |
| | — |
|
Office/West | | L +3.40% |
| | 7/2021 | | IO | | — |
| | 18,980 |
| | 18,665 |
| | — |
|
Multifamily/Southwest | | L +3.55% |
| | 7/2021 | | IO | | — |
| | 28,966 |
| | 28,735 |
| | — |
|
Office/Southeast | | L +3.50% |
| | 11/2021 | | IO | | — |
| | 23,780 |
| | 23,425 |
| | — |
|
Hotel/Midwest | | L +3.90% |
| | 12/2021 | | IO | | — |
| | 20,500 |
| | 20,264 |
| | — |
|
Hotel/Northeast | | L +4.90% |
| | 9/2020 | | IO | | — |
| | 23,500 |
| | 23,380 |
| | — |
|
Office/West | | L +4.20% |
| | 8/2020 | | IO | | — |
| | 23,476 |
| | 23,340 |
| | — |
|
Hotel/Southwest | | L +5.13% |
| | 1/2021 | | IO | | — |
| | 26,000 |
| | 25,860 |
| | — |
|
Office/Southeast | | L +2.95% |
| | 1/2022 | | IO | | — |
| | 20,672 |
| | 20,439 |
| | — |
|
Industrial/Northeast | | L +3.50% |
| | 8/2021 | | IO | | — |
| | 25,893 |
| | 25,592 |
| | — |
|
Mixed-Use/Northeast | | L +3.87% |
| | 10/2021 | | IO | | — |
| | 21,061 |
| | 20,802 |
| | — |
|
Hotel/Midwest | | L +4.07% |
| | 5/2021 | | IO | | — |
| | 25,000 |
| | 24,768 |
| | — |
|
Hotel/Northeast | | L +4.21% |
| | 10/2021 | | IO | | — |
| | 8,368 |
| | 8,182 |
| | — |
|
Office/Northeast | | L +4.20% |
| | 9/2020 | | IO | | — |
| | 23,610 |
| | 23,471 |
| | — |
|
Industrial/Northeast | | L +5.15% |
| | 9/2020 | | P&I | | — |
| | 23,375 |
| | 23,292 |
| | — |
|
Mixed-Use/Northeast | | L +4.77% |
| | 2/2021 | | IO | | — |
| | 19,772 |
| | 19,548 |
| | — |
|
Office/Southeast | | L +4.05% |
| | 3/2020 | | IO | | — |
| | 23,000 |
| | 22,887 |
| | — |
|
Retail/Southeast | | L +4.21% |
| | 7/2021 | | IO | | — |
| | 16,353 |
| | 16,182 |
| | — |
|
Multifamily/Midwest | | L +4.05% |
| | 5/2021 | | IO | | — |
| | 19,893 |
| | 19,739 |
| | — |
|
Office/Northeast | | L +4.77% |
| | 8/2020 | | IO | | — |
| | 16,769 |
| | 16,646 |
| | — |
|
Multifamily/Northeast | | L +4.44% |
| | 1/2022 | | IO | | — |
| | 7,500 |
| | 7,283 |
| | — |
|
Multifamily/Southeast | | L +4.15% |
| | 7/2020 | | IO | | — |
| | 19,985 |
| | 19,881 |
| | — |
|
Office/Southwest | | L +3.24% |
| | 10/2021 | | IO | | — |
| | 18,188 |
| | 18,019 |
| | — |
|
Multifamily/Midwest | | L +3.42% |
| | 12/2020 | | IO | | — |
| | 19,500 |
| | 19,361 |
| | — |
|
Office/West | | L +4.05% |
| | 3/2021 | | IO | | — |
| | 17,278 |
| | 17,131 |
| | — |
|
Multifamily/Southeast | | L +5.25% |
| | 8/2020 | | IO | | — |
| | 14,979 |
| | 14,870 |
| | — |
|
Multifamily/Northeast | | L +4.85% |
| | 11/2019 | | IO | | — |
| | 17,669 |
| | 17,579 |
| | — |
|
Hotel/West | | L +5.15% |
| | 4/2021 | | IO | | — |
| | 19,750 |
| | 19,576 |
| | — |
|
Retail/Southwest | | L +4.80% |
| | 1/2021 | | P&I | | — |
| | 18,974 |
| | 18,810 |
| | — |
|
Office/West | | L +3.20% |
| | 12/2021 | | IO | | — |
| | 13,160 |
| | 12,956 |
| | — |
|
Multifamily/Southwest | | L +4.29% |
| | 4/2021 | | IO | | — |
| | 18,700 |
| | 18,580 |
| | — |
|
Multifamily/West | | L +3.25% |
| | 4/2021 | | IO | | — |
| | 18,500 |
| | 18,412 |
| | — |
|
Multifamily/West | | L +3.25% |
| | 4/2021 | | IO | | — |
| | 18,500 |
| | 18,412 |
| | — |
|
Office/West | | L +5.90% |
| | 1/2020 | | IO | | — |
| | 12,642 |
| | 12,561 |
| | — |
|
Hotel/Southeast | | L +8.75% |
| | 8/2019 | | IO | | 98,500 |
| | 17,000 |
| | 17,000 |
| | — |
|
|
| | | | | | | | | | | | | | | | | | | | | | | |
Asset Type/ Location | | Interest Rate | | Final Maturity Date (1) | | Periodic Payment Terms (2) | | Prior Liens (3) | | Face Amount | | Carrying Amount | | Principal Amount Subject to Delinquent Principal or Interest |
Office/West | | L +3.75% |
| | 8/2021 | | IO | | — |
| | 10,480 |
| | 10,342 |
| | — |
|
Multifamily/Southeast | | L +2.85% |
| | 9/2021 | | IO | | — |
| | 16,560 |
| | 16,494 |
| | — |
|
Multifamily/Southwest | | L +3.15% |
| | 12/2021 | | IO | | — |
| | 16,000 |
| | 15,804 |
| | — |
|
Hotel/West | | 8.00 | % | | 2/2027 | | P&I | | — |
| | 14,652 |
| | 14,652 |
| | — |
|
Office/Southeast | | L +9.50% |
| | 8/2020 | | IO | | 45,303 |
| | 9,900 |
| | 9,900 |
| | — |
|
Hotel/Northeast | | 13.00 | % | | 11/2025 | | P&I | | 59,000 |
| | 4,779 |
| | 4,779 |
| | — |
|
Total loans held-for-investment | | $ | 202,803 |
| | $ | 3,193,641 |
| | $ | 3,167,913 |
| | $ | — |
|
____________________
| |
(1) | Based on contractual maturity date. Certain commercial mortgage loans are subject to contractual extension options which may be subject to conditions as stipulated in the loan agreement. Actual maturities may differ from contractual maturities stated herein as certain borrowers may have the right to prepay with or without paying a prepayment penalty. The Company may also extend contractual maturities in connection with loan modifications. |
| |
(2) | Principal and interest (“P&I”); Interest-only (“IO”). Certain commercial mortgage loans labeled as P&I are non-amortizing until a specific date when they begin amortizing P&I, as stated in the loan agreements. |
| |
(3) | Represents third-party priority liens. Third party portions of pari-passu participations are not considered prior liens. |
Item 9. Changes in and Disagreements with Accountants on Accounting and Financial Disclosures
None.
Item 9A. Controls and Procedures
A review and evaluation was performed by our management, including our Chief Executive Officer, or CEO, and Chief Financial Officer, or CFO, of the effectiveness of our disclosure controls and procedures (as such term is defined in Rule 13a-15(e) and 15d-15(e) under the Exchange Act) as of the end of the period covered by this Annual Report on Form 10-K. Based on that review and evaluation, the CEO and CFO have concluded that our current disclosure controls and procedures, as designed and implemented, were effective as of the end of the period covered by this Annual Report on From 10-K. Although our CEO and CFO have determined our disclosure controls and procedures were effective at the end of the period covered by this Annual Report on Form 10-K, a control system, no matter how well designed and operated, can provide only reasonable, not absolute, assurance that it will detect or uncover failures within the Company to disclose material information otherwise required to be set forth in the reports we submit under the Exchange Act.
There was no change in our internal control over financial reporting that occurred during the quarter ended December 31, 2018 that has materially affected, or is reasonably likely to materially affect, our internal control over financial reporting.
Management’s Report On Internal Control Over Financial Reporting
Management of the Company is responsible for establishing and maintaining adequate internal control over financial reporting for the Company. Internal control over financial reporting is defined in Rules 13a-15(f) and 15d-15(f) promulgated under the Exchange Act as a process designed by, or under the supervision of, the Company’s principal executive and principal financial officers and effected by the Company’s Board, management and other personnel to provide reasonable assurance regarding the reliability of financial reporting and the preparation of financial statements for external purposes in accordance with U.S. GAAP and includes those policies and procedures that:
| |
• | pertain to the maintenance of records that in reasonable detail accurately and fairly reflect the transactions and dispositions of the assets of the Company; |
| |
• | provide reasonable assurance that transactions are recorded as necessary to permit preparation of financial statements in accordance with U.S. GAAP, and that receipts and expenditures of the Company are being made only in accordance with authorizations of management and directors of the Company; and |
| |
• | provide reasonable assurance regarding prevention or timely detection of unauthorized acquisition, use or disposition of the Company’s assets that could have a material effect on the financial statements. |
Because of its inherent limitations, internal control over financial reporting may not prevent or detect misstatements. Projections of any evaluation of effectiveness to future periods are subject to the risks that controls may become inadequate because of changes in conditions or that the degree of compliance with the policies or procedures may deteriorate.
The Company’s management assessed the effectiveness of the Company’s internal control over financial reporting as of December 31, 2018. In making this assessment the Company’s management used criteria set forth by the Committee of Sponsoring Organizations of the Treadway Commission in Internal Control-Integrated Framework (2013 framework).
Based on its assessment, the Company’s management believes that, as of December 31, 2018, the Company’s internal control over financial reporting was effective based on those criteria.
The Company’s independent auditors, Ernst & Young LLP, have issued an attestation report on the effectiveness of the Company’s internal control over financial reporting. This report appears on page 108 of this annual report on Form 10-K.
Report of Independent Registered Public Accounting Firm
To the Stockholders and the Board of Directors
of Granite Point Mortgage Trust Inc.
Opinion on Internal Control over Financial Reporting
We have audited Granite Point Mortgage Trust Inc.’s internal control over financial reporting as of December 31, 2018, based on criteria established in Internal Control - Integrated Framework issued by the Committee of Sponsoring Organizations of the Treadway Commission (2013 framework) (the COSO criteria). In our opinion, Granite Point Mortgage Trust Inc. (the Company) maintained, in all material respects, effective internal control over financial reporting as of December 31, 2018, based on the COSO criteria.
We also have audited, in accordance with the standards of the Public Company Accounting Oversight Board (United States) (PCAOB), the consolidated balance sheets of the Company as of December 31, 2018 and 2017, the related consolidated statements of comprehensive income, stockholders’ equity and cash flows for each of the three years in the period ended December 31, 2018, and the related notes and financial statement schedule listed in the Index at Item 15(a) and our report dated February 27, 2019 expressed an unqualified opinion thereon.
Basis for Opinion
The Company’s management is responsible for maintaining effective internal control over financial reporting and for its assessment of the effectiveness of internal control over financial reporting included in the accompanying Management’s Report On Internal Control Over Financial Reporting. Our responsibility is to express an opinion on the Company’s internal control over financial reporting based on our audit. We are a public accounting firm registered with the PCAOB and are required to be independent with respect to the Company in accordance with the U.S. federal securities laws and the applicable rules and regulations of the Securities and Exchange Commission and the PCAOB.
We conducted our audit in accordance with the standards of the PCAOB. Those standards require that we plan and perform the audit to obtain reasonable assurance about whether effective internal control over financial reporting was maintained in all material respects.
Our audit included obtaining an understanding of internal control over financial reporting, assessing the risk that a material weakness exists, testing and evaluating the design and operating effectiveness of internal control based on the assessed risk, and performing such other procedures as we considered necessary in the circumstances. We believe that our audit provides a reasonable basis for our opinion.
Definition and Limitations of Internal Control Over Financial Reporting
A company’s internal control over financial reporting is a process designed to provide reasonable assurance regarding the reliability of financial reporting and the preparation of financial statements for external purposes in accordance with generally accepted accounting principles. A company’s internal control over financial reporting includes those policies and procedures that (1) pertain to the maintenance of records that, in reasonable detail, accurately and fairly reflect the transactions and dispositions of the assets of the company; (2) provide reasonable assurance that transactions are recorded as necessary to permit preparation of financial statements in accordance with generally accepted accounting principles, and that receipts and expenditures of the company are being made only in accordance with authorizations of management and directors of the company; and (3) provide reasonable assurance regarding prevention or timely detection of unauthorized acquisition, use, or disposition of the company’s assets that could have a material effect on the financial statements.
Because of its inherent limitations, internal control over financial reporting may not prevent or detect misstatements. Also, projections of any evaluation of effectiveness to future periods are subject to the risk that controls may become inadequate because of changes in conditions, or that the degree of compliance with the policies or procedures may deteriorate.
/s/ Ernst & Young LLP
Minneapolis, Minnesota
February 27, 2019
Item 9B. Other Information
None.
PART III
Items 10, 11, 12 and 13.
The information required by Items 10, 11, 12 and 13 of Part III of this Annual Report is incorporated by reference to information to be set forth in the Company’s definitive Proxy Statement for its 2019 Annual Meeting of Stockholders, which will be filed with the SEC, pursuant to Regulation 14A, not later than 120 days after December 31, 2018.
Item 14. Principal Accounting Fees and Services
We retained Ernst & Young LLP, or EY, to audit our consolidated financial statements for the years ended December 31, 2018 and 2017. We also retained EY, as well as other accounting and consulting firms, to provide various other services during the years ended December 31, 2018 and 2017. Audit and audit-related fees of the Predecessor were incurred and paid by Two Harbors Investment Corp. as part of the formation transaction.
The table below presents the aggregate fees billed to us for professional services performed by EY for the years ended December 31, 2018 and 2017:
|
| | | | | | | |
| Year Ended |
| December 31, |
| 2018 | | 2017 |
Audit fees (1) | $ | 859,552 |
| | $ | 798,920 |
|
Audit-related fees (2) | — |
| | — |
|
Tax fees (3) | 197,476 |
| | 107,150 |
|
Total principal accountant fees | $ | 1,057,028 |
| | $ | 906,070 |
|
____________________
| |
(1) | Audit fees pertain to the audit of our annual Consolidated Financial Statements, including review of the interim financial statements contained in our Quarterly Reports on Form 10-Q, comfort letters to underwriters in connection with our registration statements and common stock offerings, attest services, consents to the incorporation of the EY audit report in publicly filed documents and assistance with and review of documents filed with the SEC. |
| |
(2) | Audit-related fees pertain to assurance and related services that are traditionally performed by the principal accountant, including accounting consultations and audits in connection with proposed or consummated acquisitions, internal control reviews and consultation concerning financial accounting and reporting standard. |
| |
(3) | Tax fees pertain to services performed for tax compliance, including REIT compliance, tax planning and tax advice, including preparation of tax returns and claims for refund and tax-payment planning services. Tax planning and advice also includes assistance with tax audits and appeals, and tax advice related to specific transactions. |
The services performed by EY in 2018 were pre-approved by our Audit Committee in accordance with the pre-approval policy set forth in our Audit Committee Charter. This policy requires that all engagement fees and the terms and scope of all auditing and non-auditing services be reviewed and approved by the Audit Committee in advance of their formal initiation.
PART IV
Item 15. Exhibits, Financial Statement Schedules
(a) The following documents are filed as part of this Annual Report on Form 10-K:
(1)Consolidated Financial Statements:
The consolidated financial statements of the Company, together with the independent registered public accounting firm’s report thereon, are set forth in Part II, Item 8 on pages 71 through 77 of this Annual Report on Form 10-K and are incorporated herein by reference. (2)Schedules to Consolidated Financial Statements:
Schedule IV - Mortgage Loans on Real Estate is set forth in Part II, Item 8 on pages 103 through 105 of this Annual Report on Form 10-K. All other consolidated financial statement schedules not included have been omitted because they are either inapplicable or the information required is provided in the Company’s Consolidated Financial Statements and Notes thereto, included in Part II, Item 8, of this Annual Report on Form 10-K.
(3)Exhibits:
The exhibits listed on the accompanying Exhibits Index are filed or incorporated by reference as part of this Annual Report on Form 10-K.
Item 16. Form 10-K Summary
None.
|
| | |
Exhibit Number | | Exhibit Index |
1.1 | |
|
2.1 | | |
3.1 | | |
3.2 | | |
3.3 | | |
4.1 | | |
4.2 | | |
4.3 | | |
4.4 | | |
4.5 | | |
10.1 | | |
10.2 | | |
10.3 | | |
10.4* | | |
10.5 | | |
10.6 | | |
10.7 | | Master Repurchase and Securities Contract Agreement, dated as of February 18, 2016, First Amendment to Master Repurchase and Securities Contract Agreement, dated as of June 30, 2016, and Second Amendment to Master Repurchase and Securities Contract Agreement, dated as of February 21, 2017, each between Morgan Stanley Bank and TH Commercial MS II, LLC (incorporated by reference to Exhibit 10.8 of Amendment No. 1 to the registrant’s Registration Statement on Form S-11 (File No. 333-218197) filed with the SEC on June 15, 2017). |
|
| | |
10.8 | | |
10.9 | | |
10.10 | | |
10.11 | | |
10.12 | | |
|
| | |
Exhibit Number | | Exhibit Index |
10.13 | | |
10.14 | | |
10.15 | | |
10.16 | | |
10.17 | | |
10.18 | | |
10.19 | | |
10.20 | | |
10.21 | | |
10.22 | | Credit Agreement, dated as of April 13, 2018, among GP Commercial CB SL LLC, GP Commercial CB SL Holdings LLC, Granite Point Mortgage Trust Inc., Granite Point Operating Company LLC, TH Commercial Holdings LLC, Citibank, N.A., as administrative agent and initial lender, and Citigroup Global Markets Inc., as sole lead arranger and sole lead book running manager (incorporated by reference to Exhibit 10.1 of the registrant’s Current Report on Form 8-K filed with the SEC on April 17, 2018). |
10.23 | | |
10.24 | | |
10.25 | | |
10.26 | | |
10.27 | | |
10.28 | | Indenture, dated as of May 9, 2018, by and among GPMT 2018-FL1, Ltd., GPMT 2018-FL1 LLC, GPMT Seller LLC, Wilmington Trust, National Association and Wells Fargo Bank, National Association (incorporated by reference to Exhibit 10.1 of the registrant’s Current Report on Form 8-K filed with the SEC on May 15, 2018). |
10.29 | | |
10.30 | | |
|
| | |
10.31 | | Servicing Agreement, dated as of May 9, 2018, by and among, GPMT 2018-FL1, Ltd., Wilmington Trust, National Association, Wells Fargo Bank, National Association, GPMT Seller LLC, Trimont Real Estate Advisors, LLC and Park Bridge Lender Services LLC (incorporated by reference to Exhibit 10.4 of the registrant’s Current Report on Form 8-K filed with the SEC on May 15, 2018). |
21.1 | | |
23.1 | | |
24.1 | | |
31.1 | | |
31.2 | | |
32.1 | | |
32.2 | | |
101 | | Financial statements from the Annual Report on Form 10-K of Granite Point Mortgage Trust Inc. for the year ended December 31, 2018, formatted in Inline XBRL: (i) the Consolidated Balance Sheets, (ii) the Consolidated Statements of Comprehensive Income, (iii) the Consolidated Statements of Stockholders’ Equity, (iv) the Consolidated Statements of Cash Flows, and (v) the Notes to the Consolidated Financial Statements. (filed herewith) |
____________________
| |
* | Management or compensatory agreement |
SIGNATURES
Pursuant to the requirements of Section 13 or 15(d) of the Securities Exchange Act of 1934, the registrant has duly caused this report to be signed on its behalf by the undersigned, thereunto duly authorized.
|
| | | |
| | | GRANITE POINT MORTGAGE TRUST INC. |
Dated: | February 27, 2019 | By: | /s/ John A. Taylor |
| | | John A. Taylor President, Chief Executive Officer and Director (Principal Executive Officer) |
Pursuant to the requirements of the Securities Exchange Act of 1934, this report has been signed below by the following persons on behalf of the registrant and in the capacities and on the dates indicated.
Each of the undersigned hereby appoints John A. Taylor and Marcin Urbaszek, and each of them (with full power to act alone), as attorneys and agents for the undersigned, with full power of substitution, for and in the name, place and stead of the undersigned, to sign and file with the Securities and Exchange Commission under the Securities Act of 1934, any and all amendments and exhibits to this annual report on Form 10-K and any and all applications, instruments, and other documents to be filed with the Securities and Exchange Commission pertaining to this annual report on Form 10-K or any amendments thereto, with full power and authority to do and perform any and all acts and things whatsoever requisite and necessary or desirable.
|
| | | | |
Signature | | Title | | Date |
/s/ John A. Taylor | | President, Chief Executive Officer and Director (principal executive officer) | | February 27, 2019 |
John A. Taylor | | | |
| | | | |
/s/ Marcin Urbaszek | | Chief Financial Officer (principal accounting and financial officer) | | February 27, 2019 |
Marcin Urbaszek | | | |
| | | | |
/s/ Stephen G. Kasnet | | Chairman of the Board of Directors | | February 27, 2019 |
Stephen G. Kasnet | | | |
| | | | |
/s/ Tanuja M. Dehne | | Director | | February 27, 2019 |
Tanuja M. Dehne | | | |
| | | | |
/s/ Martin A. Kamarck | | Director | | February 27, 2019 |
Martin A. Kamarck | | | |
| | | | |
/s/ William Roth | | Director | | February 27, 2019 |
William Roth | | | |
| | | | |
/s/ W. Reid Sanders | | Director | | February 27, 2019 |
W. Reid Sanders | | | |
| | | | |
/s/ Thomas E. Siering | | Director | | February 27, 2019 |
Thomas E. Siering | | | |
| | | | |
/s/ Hope B. Woodhouse | | Director | | February 27, 2019 |
Hope B. Woodhouse | | | | |