Investor Presentation Second Quarter 2019
Safe Harbor Statement This presentation contains, in addition to historical information, certain forward-looking statements that are based on our current assumptions, expectations and projections about future performance and events. In particular, statements regarding future economic performance, finances, and expectations and objectives of management constitute forward-looking statements. Forward-looking statements are not historical in nature and can be identified by words such as "believes," "expects," "may," "will," "should," "seeks," "approximately," "intends," "plans," "estimates," "anticipates," “targets,” “goals,” “future,” “likely” and other expressions that are predictions of or indicate future events and trends and that do not relate to historical matters. Although the forward-looking statements contained in this presentation are based upon information available at the time the statements are made and reflect the best judgment of our senior management, forward-looking statements inherently involve known and unknown risks, uncertainties and other factors, which may cause the actual results, performance or achievements to differ materially from anticipated future results. Important factors that could cause actual results to differ materially from expected results, including, among other things, those described in our filings with the Securities and Exchange Commission (“SEC”), including our annual report on form 10-K for the year ended December 31, 2018, and any subsequent Quarterly Reports on Form 10-Q under the caption “Risk Factors.” Factors that could cause actual results to differ include, but are not limited to: the state of the U.S. economy generally or in specific geographic regions; the general political, economic, and competitive conditions in the markets in which we invest; defaults by borrowers in paying debt service on outstanding indebtedness and borrowers' abilities to manage and stabilize properties; our ability to obtain financing arrangements on terms favorable to us or at all; the level and volatility of prevailing interest rates and credit spreads; reductions in the yield on our investments and an increase in the cost of our financing; general volatility of the securities markets in which we participate; the return or impact of current or future investments; allocation of investment opportunities to us by our Manager; increased competition from entities investing in our target assets; effects of hedging instruments on our target investments; changes in governmental regulations, tax law and rates, and similar matters; our ability to maintain our qualification as a REIT for U.S. federal income tax purposes and our exclusion from registration under the Investment Company Act; availability of desirable investment opportunities; availability of qualified personnel and our relationship with our Manager; estimates relating to our ability to make distributions to our stockholders in the future; hurricanes, earthquakes, and other natural disasters, acts of war and/or terrorism and other events that may cause unanticipated and uninsured performance declines and/or losses to us or the owners and operators of the real estate securing our investments; deterioration in the performance of the properties securing our investments that may cause deterioration in the performance of our investments and, potentially, principal losses to us; and difficulty or delays in redeploying the proceeds from repayments of our existing investments. These forward-looking statements apply only as of the date of this press release. We are under no duty to update any of these forward-looking statements after the date of this presentation to conform these statements to actual results or revised expectations. You should, therefore, not rely on these forward-looking statements as predictions of future events. This presentation also contains estimates and other statistical data made by independent parties and by us relating to market size and growth and other data about our industry. This data involves a number of assumptions and limitations, and you are cautioned not to give undue weight to such estimates. In addition, projections, assumptions and estimates of our future performance and the future performance of the markets in which we operate are necessarily subject to a high degree of uncertainty and risk. 2
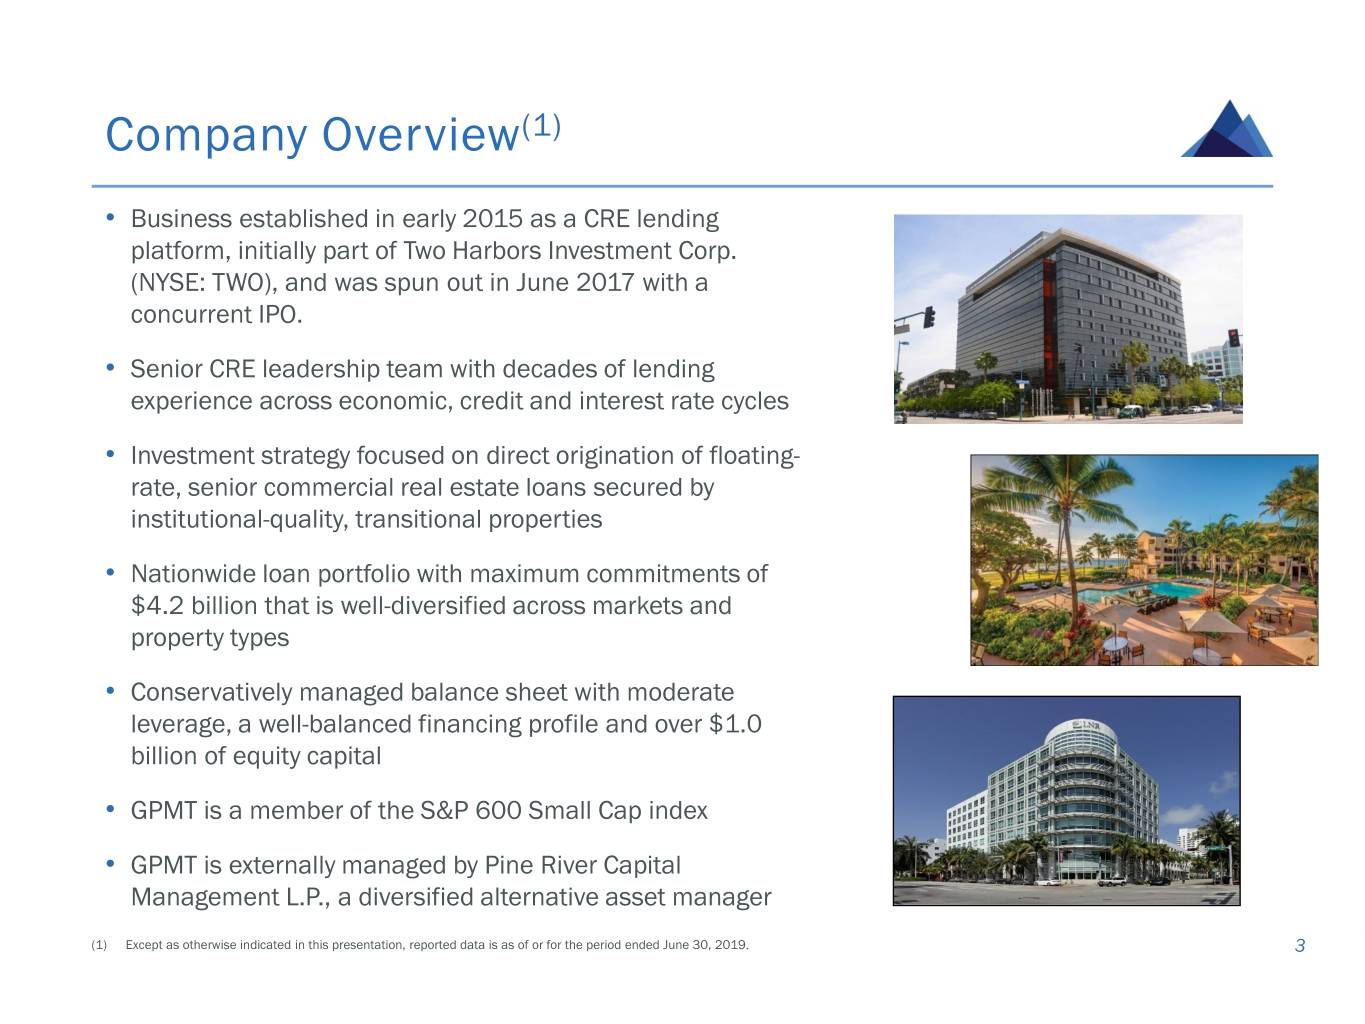
Company Overview(1) • Business established in early 2015 as a CRE lending platform, initially part of Two Harbors Investment Corp. (NYSE: TWO), and was spun out in June 2017 with a concurrent IPO. • Senior CRE leadership team with decades of lending experience across economic, credit and interest rate cycles • Investment strategy focused on direct origination of floating- rate, senior commercial real estate loans secured by institutional-quality, transitional properties • Nationwide loan portfolio with maximum commitments of $4.2 billion that is well-diversified across markets and property types • Conservatively managed balance sheet with moderate leverage, a well-balanced financing profile and over $1.0 billion of equity capital • GPMT is a member of the S&P 600 Small Cap index • GPMT is externally managed by Pine River Capital Management L.P., a diversified alternative asset manager (1) Except as otherwise indicated in this presentation, reported data is as of or for the period ended June 30, 2019. 3
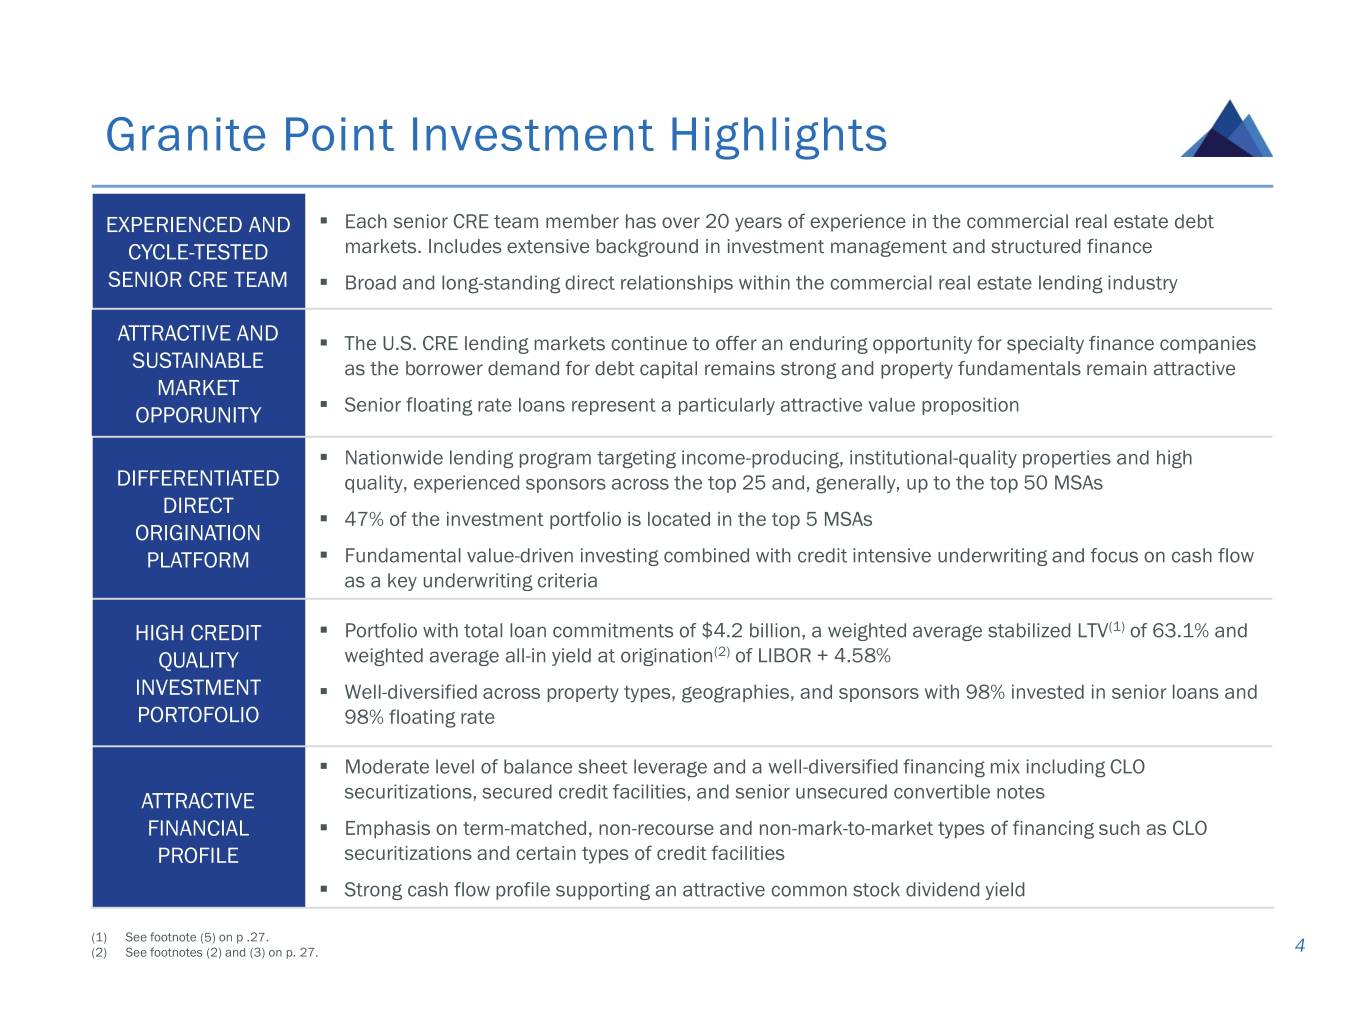
Granite Point Investment Highlights EXPERIENCED AND . Each senior CRE team member has over 20 years of experience in the commercial real estate debt CYCLE-TESTED markets. Includes extensive background in investment management and structured finance SENIOR CRE TEAM . Broad and long-standing direct relationships within the commercial real estate lending industry ATTRACTIVE AND . The U.S. CRE lending markets continue to offer an enduring opportunity for specialty finance companies SUSTAINABLE as the borrower demand for debt capital remains strong and property fundamentals remain attractive MARKET OPPORUNITY . Senior floating rate loans represent a particularly attractive value proposition . Nationwide lending program targeting income-producing, institutional-quality properties and high DIFFERENTIATED quality, experienced sponsors across the top 25 and, generally, up to the top 50 MSAs DIRECT . 47% of the investment portfolio is located in the top 5 MSAs ORIGINATION PLATFORM . Fundamental value-driven investing combined with credit intensive underwriting and focus on cash flow as a key underwriting criteria HIGH CREDIT . Portfolio with total loan commitments of $4.2 billion, a weighted average stabilized LTV(1) of 63.1% and QUALITY weighted average all-in yield at origination(2) of LIBOR + 4.58% INVESTMENT . Well-diversified across property types, geographies, and sponsors with 98% invested in senior loans and PORTOFOLIO 98% floating rate . Moderate level of balance sheet leverage and a well-diversified financing mix including CLO ATTRACTIVE securitizations, secured credit facilities, and senior unsecured convertible notes FINANCIAL . Emphasis on term-matched, non-recourse and non-mark-to-market types of financing such as CLO PROFILE securitizations and certain types of credit facilities . Strong cash flow profile supporting an attractive common stock dividend yield (1) See footnote (5) on p .27. (2) See footnotes (2) and (3) on p. 27. 4

Commercial Real Estate Market Overview
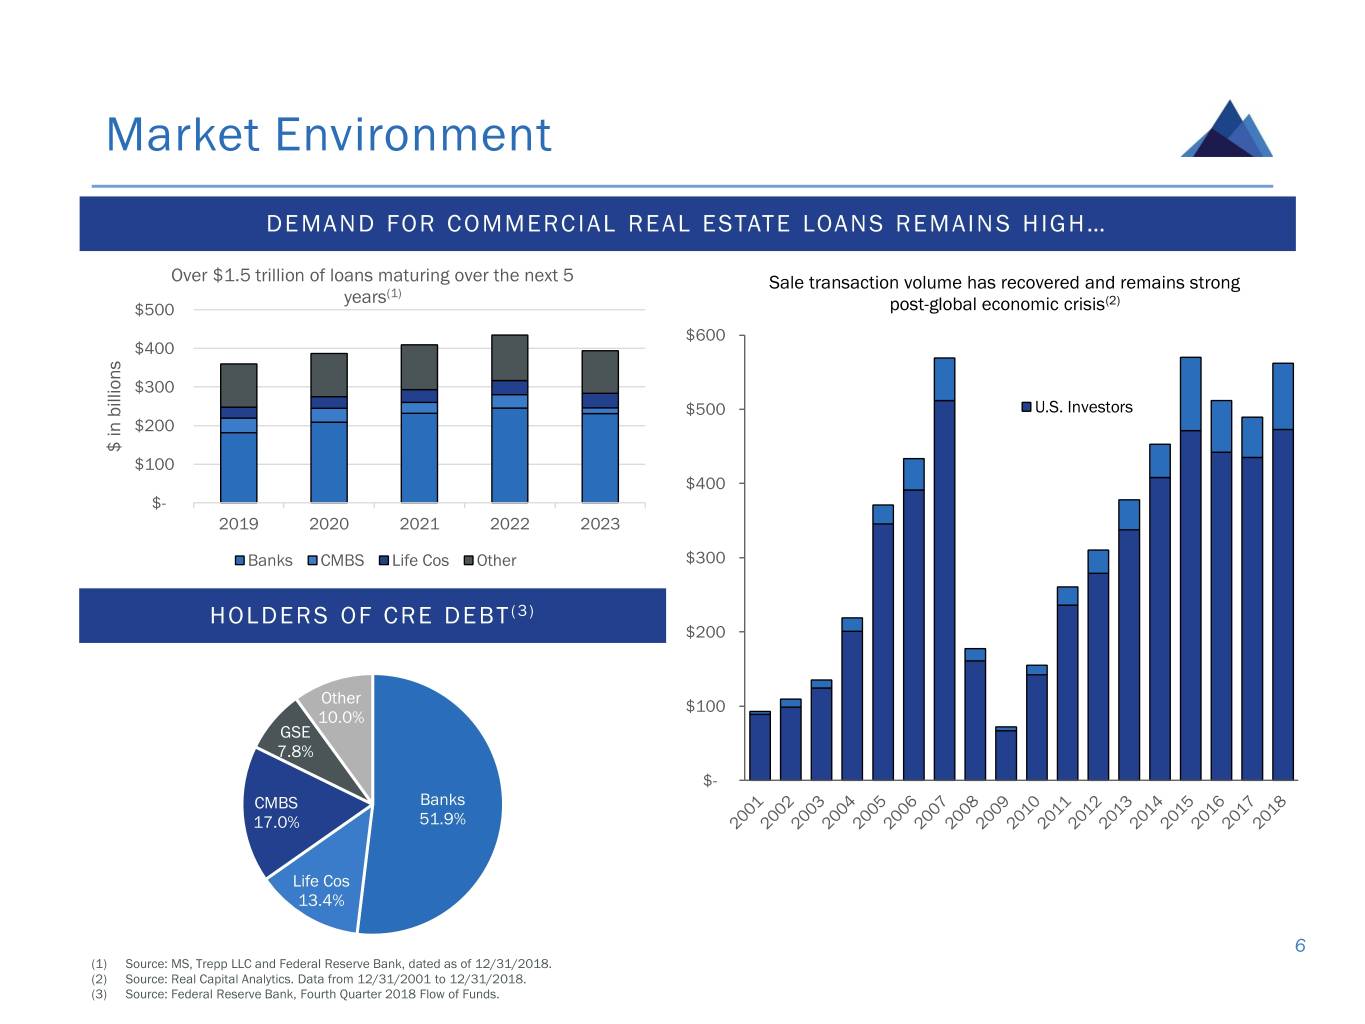
Market Environment DEMAND FOR COMMERCIAL REAL ESTATE LOANS REMAINS HIGH… Over $1.5 trillion of loans maturing over the next 5 Sale transaction volume has recovered and remains strong (1) years (2) $500 post-global economic crisis $600 $400 $300 $500 U.S. Investors $200 $ in billions $100 $400 $- 2019 2020 2021 2022 2023 Banks CMBS Life Cos Other $300 HOLDERS OF CRE DEBT (3) $200 Other $100 10.0% GSE 7.8% $- CMBS Banks 17.0% 51.9% Life Cos 13.4% Total CRE Debt: ~$3 trillion 6 (1) Source: MS, Trepp LLC and Federal Reserve Bank, dated as of 12/31/2018. (2) Source: Real Capital Analytics. Data from 12/31/2001 to 12/31/2018. (3) Source: Federal Reserve Bank, Fourth Quarter 2018 Flow of Funds.
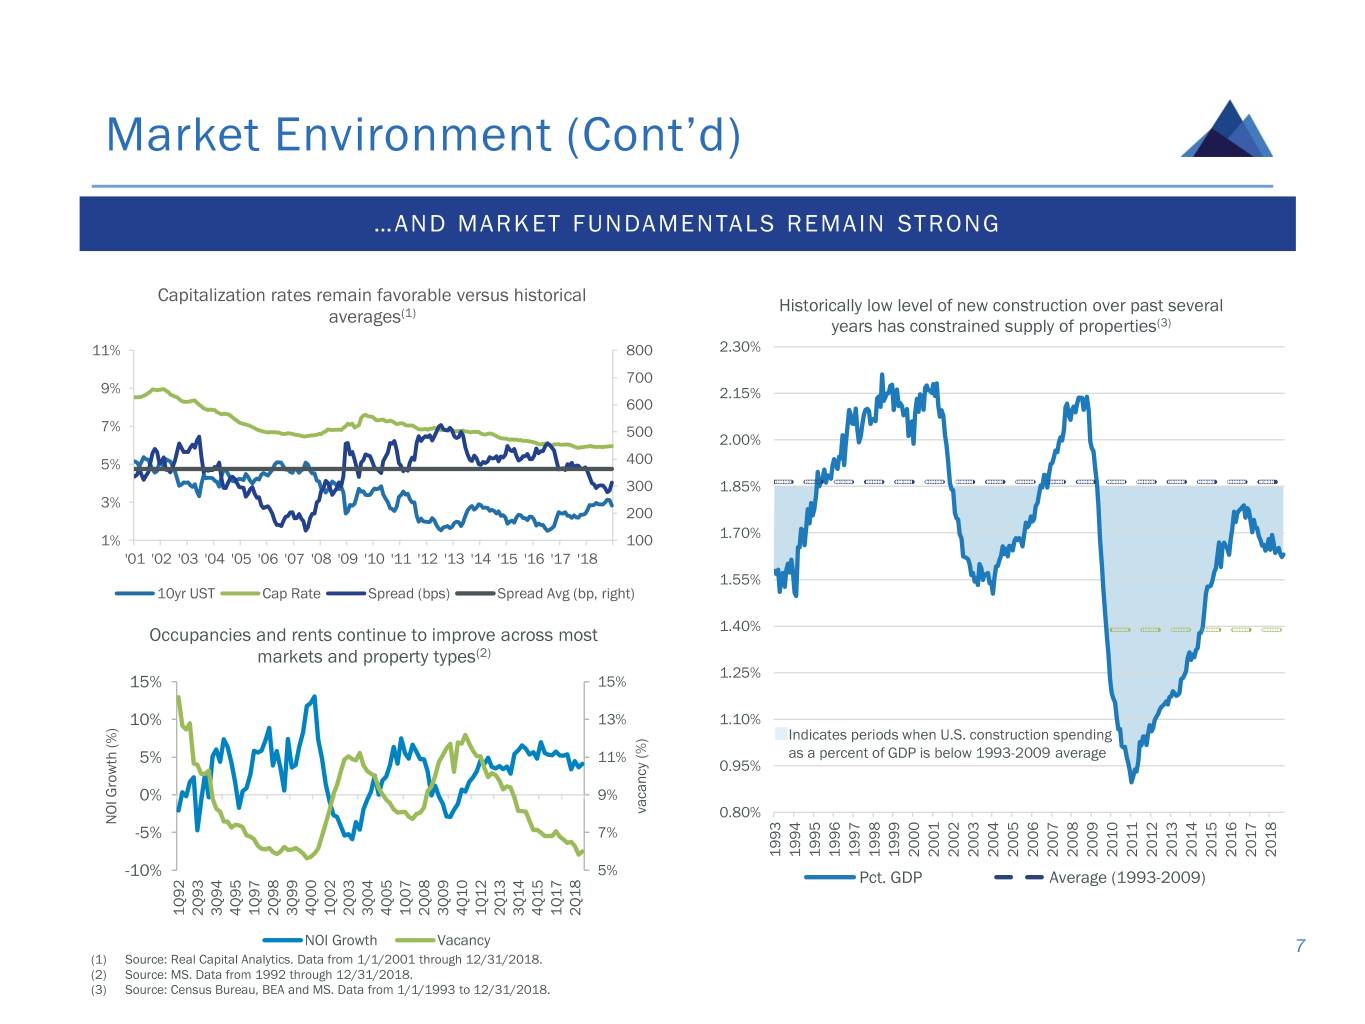
Market Environment (Cont’d) …AND MARKET FUNDAMENTALS REMAIN STRONG Capitalization rates remain favorable versus historical (1) Historically low level of new construction over past several averages years has constrained supply of properties(3) 11% 800 2.30% 700 9% 2.15% 600 7% 500 2.00% 5% 400 300 1.85% 3% 200 1% 100 1.70% '01 '02 '03 '04 '05 '06 '07 '08 '09 '10 '11 '12 '13 '14 '15 '16 '17 '18 1.55% 10yr UST Cap Rate Spread (bps) Spread Avg (bp, right) Occupancies and rents continue to improve across most 1.40% markets and property types(2) 1.25% 15% 15% 10% 13% 1.10% Indicates periods when U.S. construction spending 5% 11% as a percent of GDP is below 1993-2009 average 0.95% 0% 9% vacancy (%) vacancy 0.80% NOI Growth (%) Growth NOI -5% 7% 1993 1994 1995 1996 1997 1998 1999 2000 2001 2002 2003 2004 2005 2006 2007 2008 2009 2010 2011 2012 2013 2014 2015 2016 2017 2018 -10% 5% Pct. GDP Average (1993-2009) 1Q92 2Q93 3Q94 4Q95 1Q97 2Q98 3Q99 4Q00 1Q02 2Q03 3Q04 4Q05 1Q07 2Q08 3Q09 4Q10 1Q12 2Q13 3Q14 4Q15 1Q17 2Q18 NOI Growth Vacancy 7 (1) Source: Real Capital Analytics. Data from 1/1/2001 through 12/31/2018. (2) Source: MS. Data from 1992 through 12/31/2018. (3) Source: Census Bureau, BEA and MS. Data from 1/1/1993 to 12/31/2018.

Investment Strategy and Origination Platform
Investment Philosophy OUR TEAM HAS DEVELOPED A SUCCESSFUL INVESTMENT PHILOSOPHY THAT HAS BEEN TESTED THROUGH SEVERAL ECONOMIC, INTEREST RATE AND REAL ESTATE CYCLES • Long-term, fundamental value-oriented investing philosophy; focus on relative value • Emphasize selectivity and diversification • Prioritize income-producing, institutional-quality properties and experienced owners/sponsors • Cash flow is a key underwriting metric • Intensive diligence with a focus on bottom-up underwriting of property fundamentals • Avoid “sector bets” and “momentum investments” • The property is our collateral; the loan is our investment 9
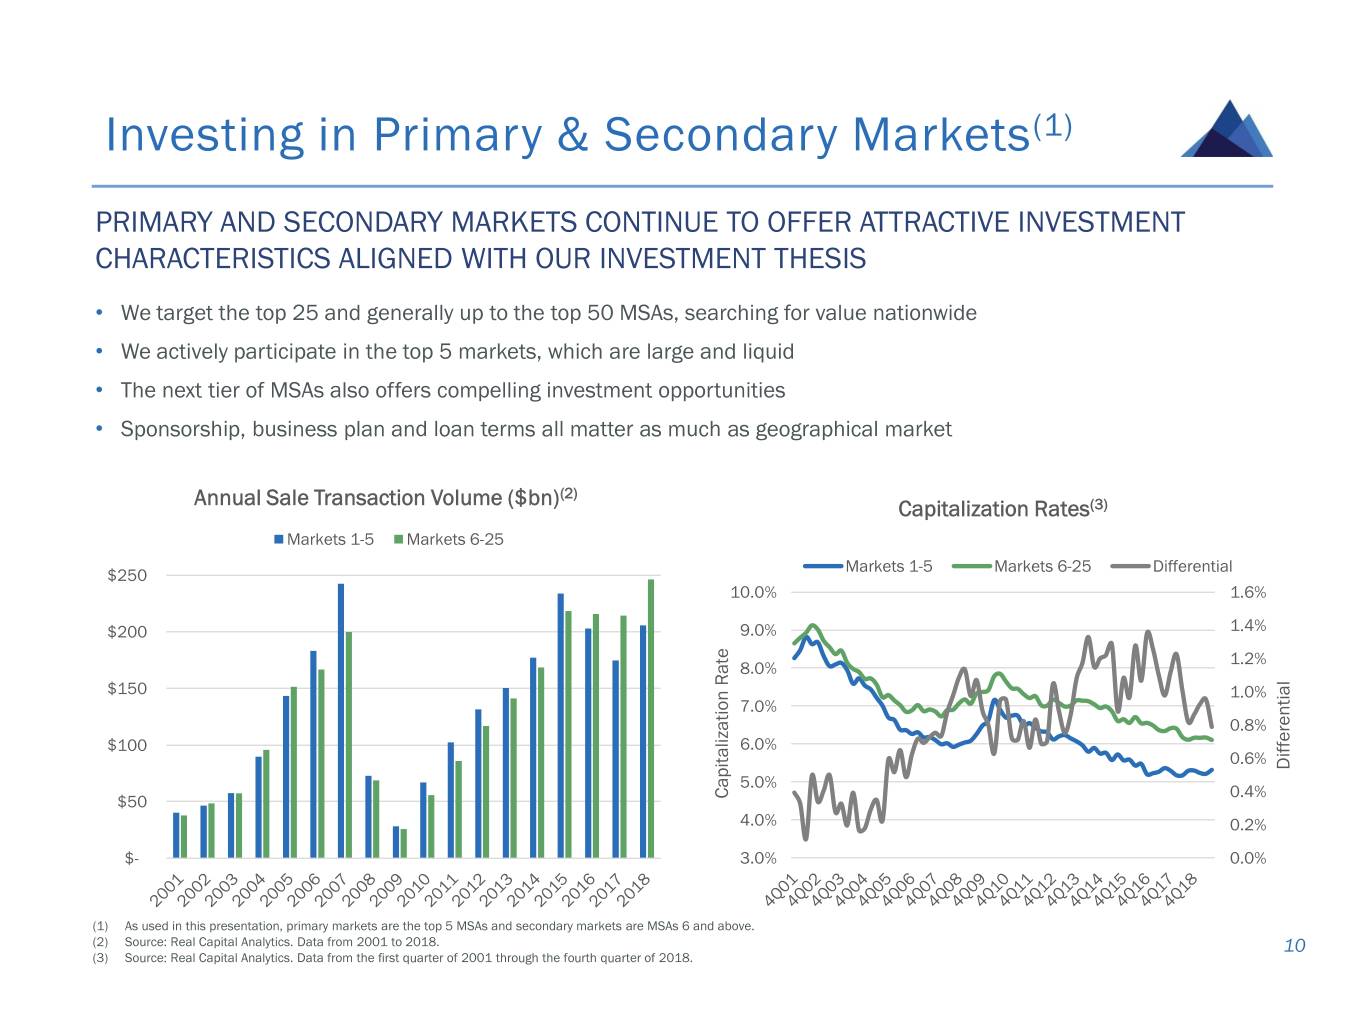
Investing in Primary & Secondary Markets(1) PRIMARY AND SECONDARY MARKETS CONTINUE TO OFFER ATTRACTIVE INVESTMENT CHARACTERISTICS ALIGNED WITH OUR INVESTMENT THESIS • We target the top 25 and generally up to the top 50 MSAs, searching for value nationwide • We actively participate in the top 5 markets, which are large and liquid • The next tier of MSAs also offers compelling investment opportunities • Sponsorship, business plan and loan terms all matter as much as geographical market (2) Annual Sale Transaction Volume ($bn) Capitalization Rates(3) Markets 1-5 Markets 6-25 Markets 1-5 Markets 6-25 Differential $250 10.0% 1.6% $200 9.0% 1.4% 1.2% 8.0% $150 1.0% 7.0% 0.8% $100 6.0% 0.6% Differential 5.0% Capitalization Rate 0.4% $50 4.0% 0.2% $- 3.0% 0.0% (1) As used in this presentation, primary markets are the top 5 MSAs and secondary markets are MSAs 6 and above. (2) Source: Real Capital Analytics. Data from 2001 to 2018. 10 (3) Source: Real Capital Analytics. Data from the first quarter of 2001 through the fourth quarter of 2018.
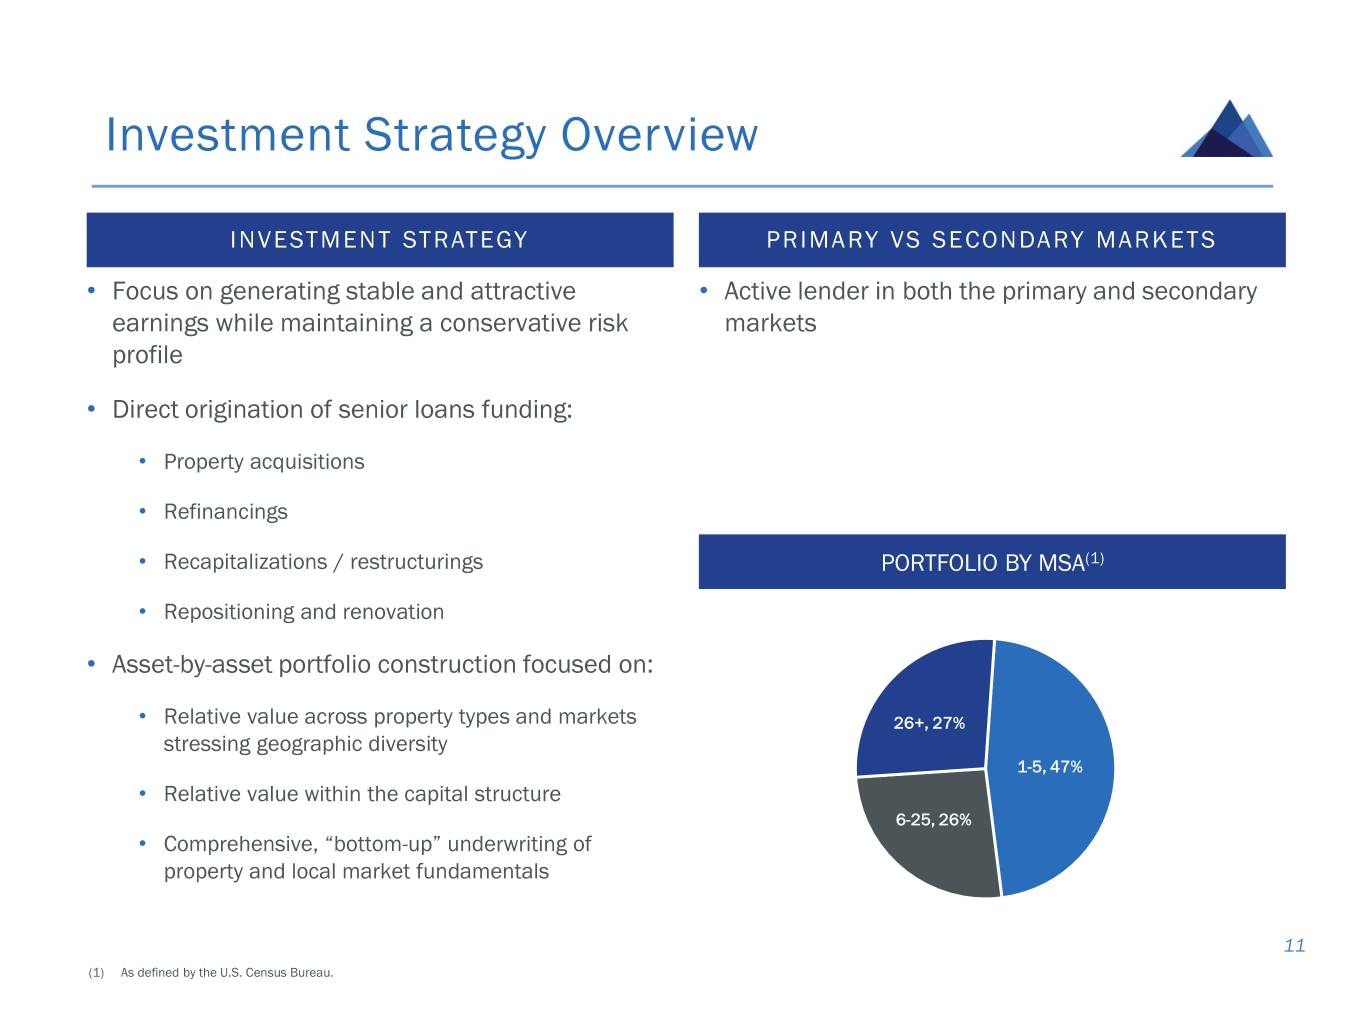
Investment Strategy Overview INVESTMENT STRATEGY PRIMARY VS SECONDARY MARKETS • Focus on generating stable and attractive • Active lender in both the primary and secondary earnings while maintaining a conservative risk markets profile • Direct origination of senior loans funding: • Property acquisitions • Refinancings • Recapitalizations / restructurings PORTFOLIO BY MSA(1) • Repositioning and renovation • Asset-by-asset portfolio construction focused on: • Relative value across property types and markets 26+, 27% stressing geographic diversity 1-5, 47% • Relative value within the capital structure 6-25, 26% • Comprehensive, “bottom-up” underwriting of property and local market fundamentals 11 (1) As defined by the U.S. Census Bureau.
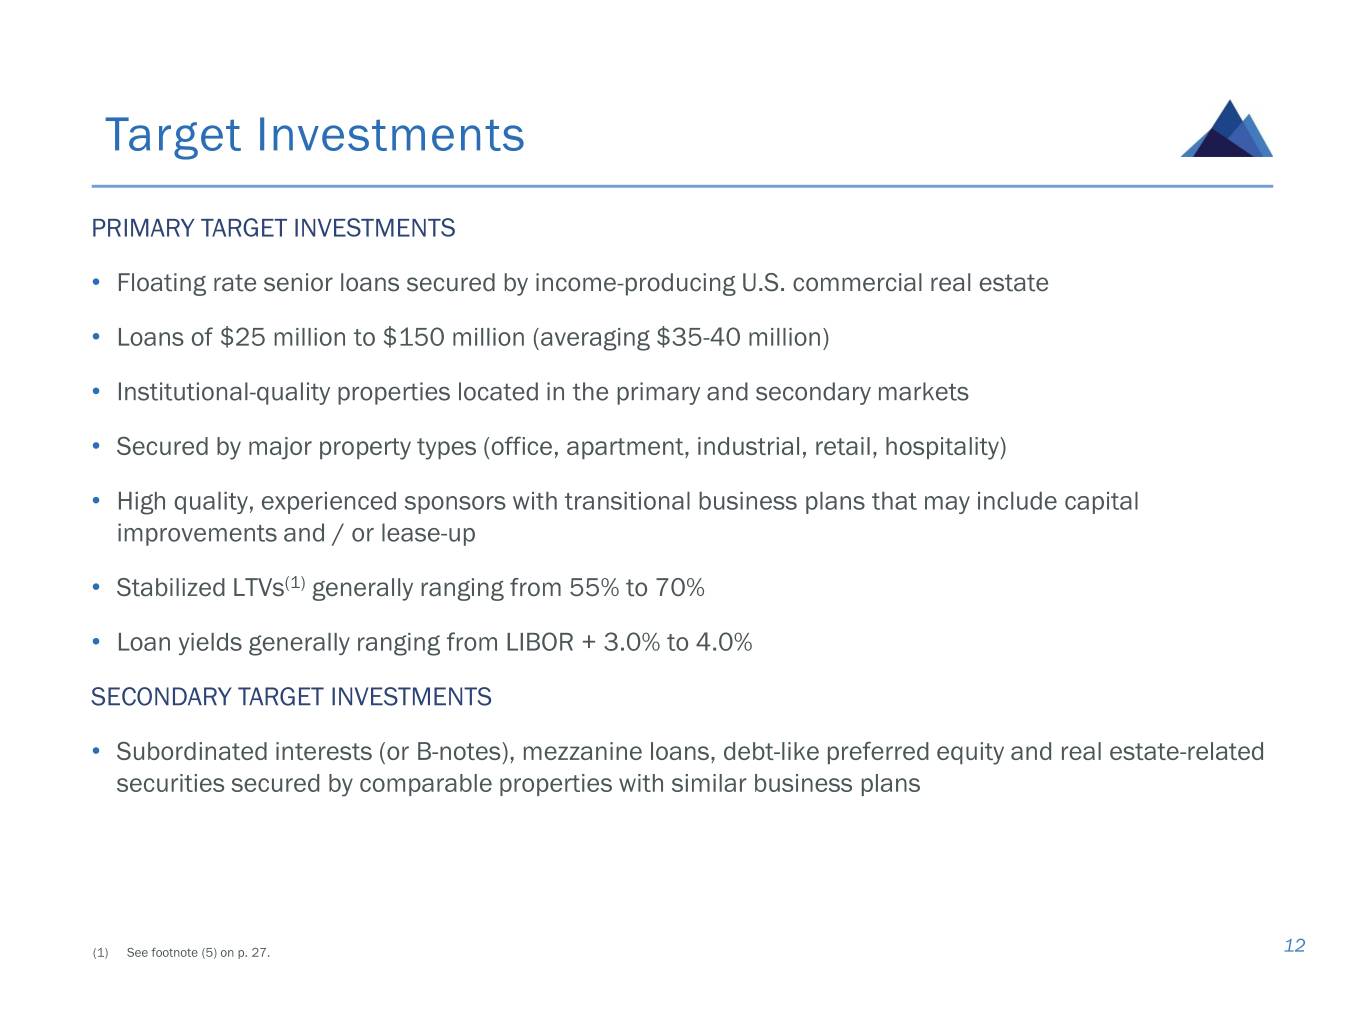
Target Investments PRIMARY TARGET INVESTMENTS • Floating rate senior loans secured by income-producing U.S. commercial real estate • Loans of $25 million to $150 million (averaging $35-40 million) • Institutional-quality properties located in the primary and secondary markets • Secured by major property types (office, apartment, industrial, retail, hospitality) • High quality, experienced sponsors with transitional business plans that may include capital improvements and / or lease-up • Stabilized LTVs(1) generally ranging from 55% to 70% • Loan yields generally ranging from LIBOR + 3.0% to 4.0% SECONDARY TARGET INVESTMENTS • Subordinated interests (or B-notes), mezzanine loans, debt-like preferred equity and real estate-related securities secured by comparable properties with similar business plans (1) See footnote (5) on p. 27. 12
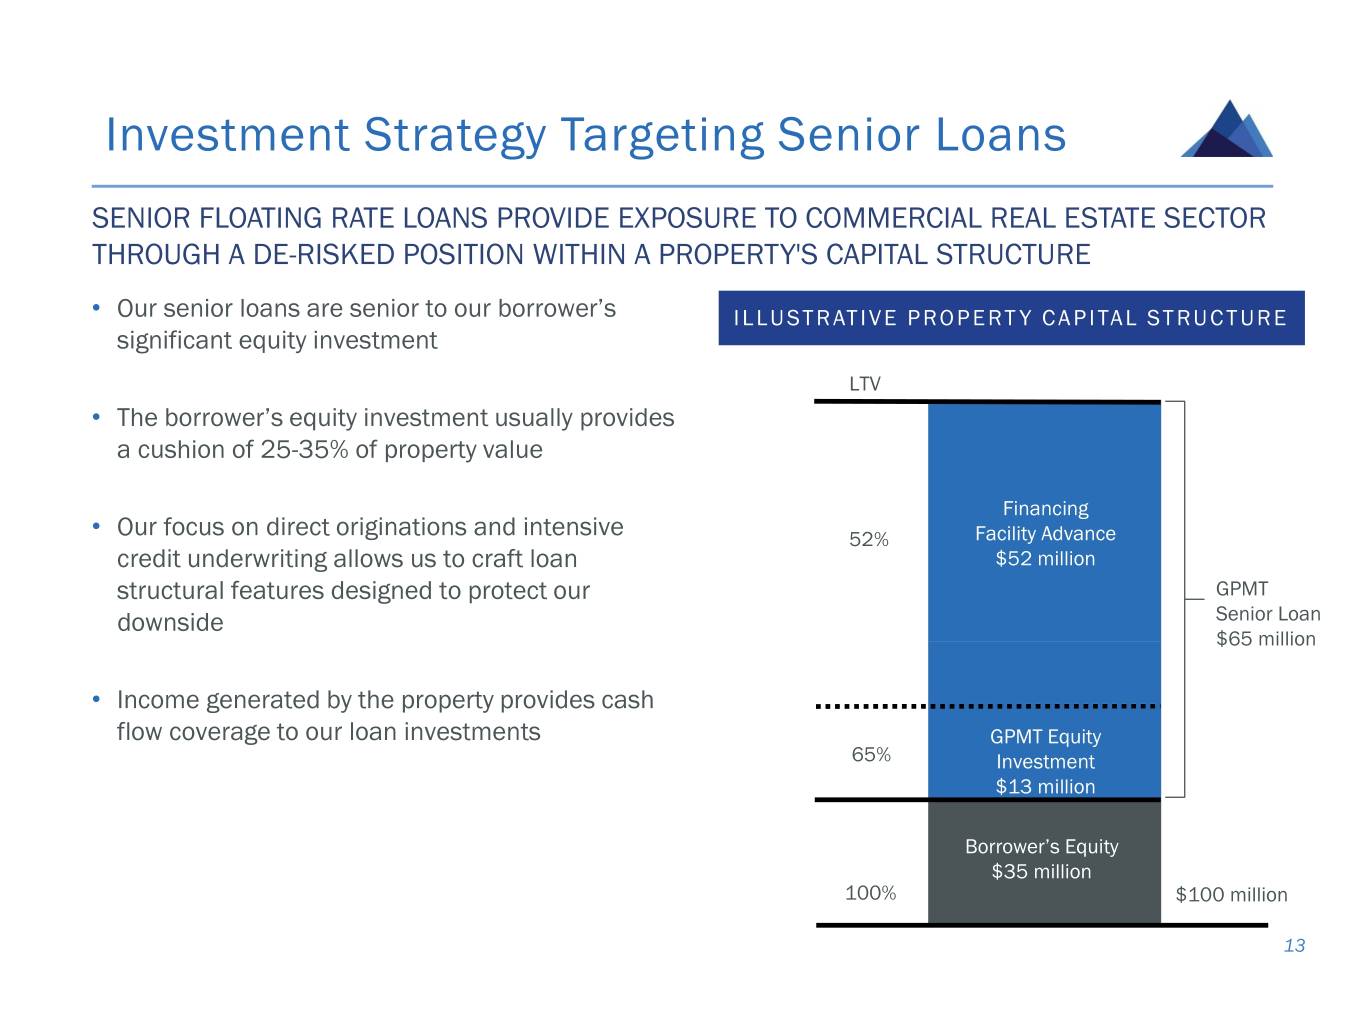
Investment Strategy Targeting Senior Loans SENIOR FLOATING RATE LOANS PROVIDE EXPOSURE TO COMMERCIAL REAL ESTATE SECTOR THROUGH A DE-RISKED POSITION WITHIN A PROPERTY'S CAPITAL STRUCTURE • Our senior loans are senior to our borrower’s ILLUSTRATIVE PROPERTY CAPITAL STRUCTURE significant equity investment LTV • The borrower’s equity investment usually provides a cushion of 25-35% of property value Financing • Our focus on direct originations and intensive 52% Facility Advance credit underwriting allows us to craft loan $52 million structural features designed to protect our GPMT downside Senior Loan $65 million • Income generated by the property provides cash flow coverage to our loan investments GPMT Equity 65% Investment $13 million Borrower’s Equity $35 million 100% $100 million 13
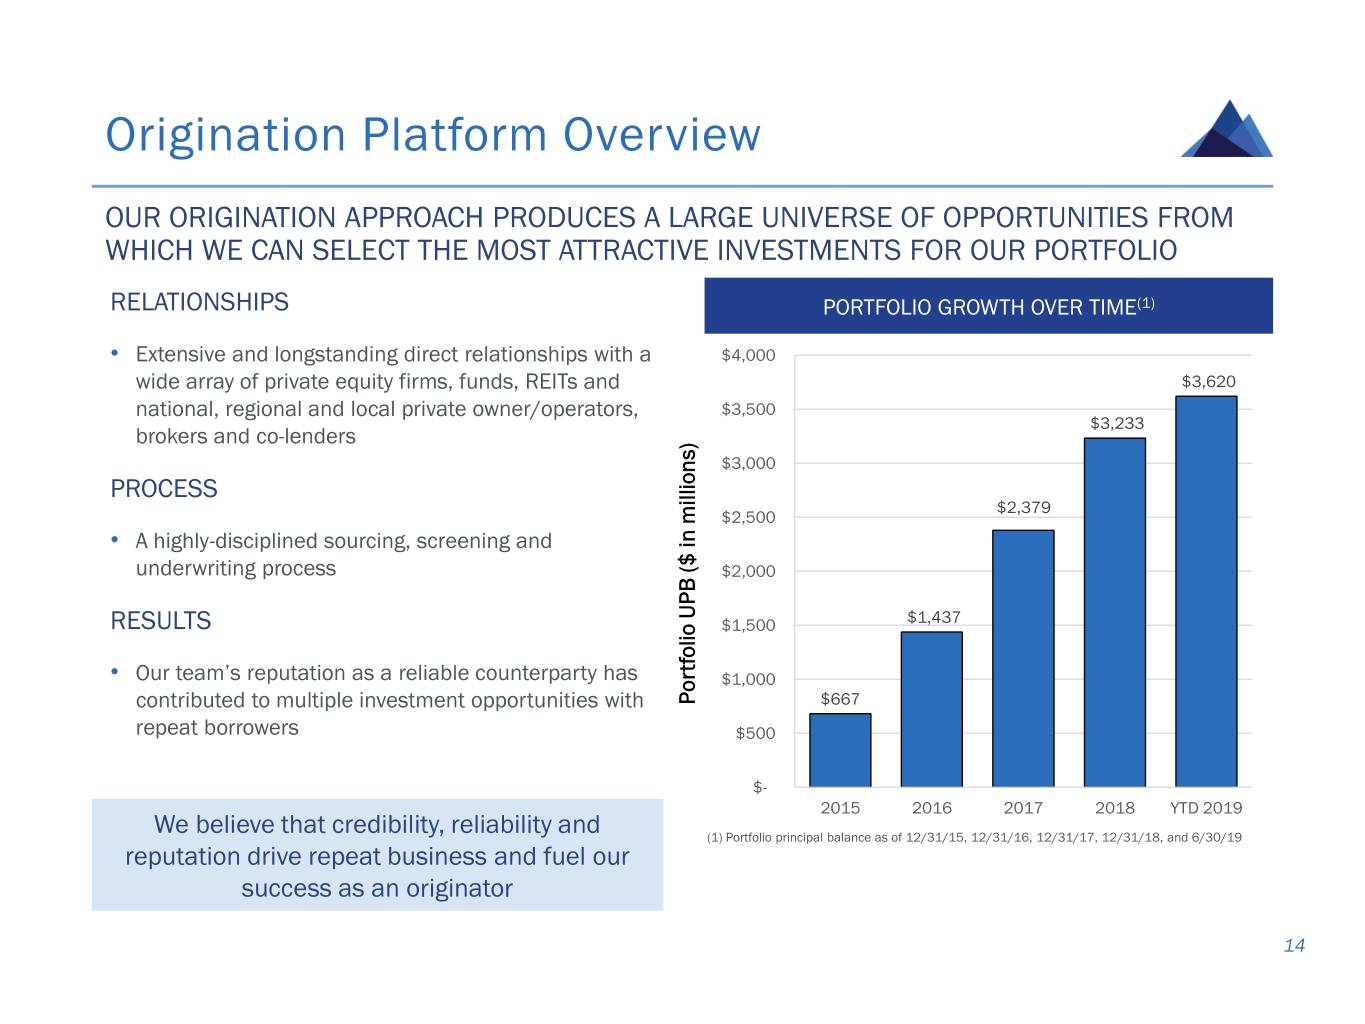
Origination Platform Overview OUR ORIGINATION APPROACH PRODUCES A LARGE UNIVERSE OF OPPORTUNITIES FROM WHICH WE CAN SELECT THE MOST ATTRACTIVE INVESTMENTS FOR OUR PORTFOLIO RELATIONSHIPS PORTFOLIO GROWTH OVER TIME(1) • Extensive and longstanding direct relationships with a $4,000 wide array of private equity firms, funds, REITs and $3,620 national, regional and local private owner/operators, $3,500 $3,233 brokers and co-lenders $3,000 PROCESS $2,379 $2,500 • A highly-disciplined sourcing, screening and underwriting process $2,000 RESULTS $1,500 $1,437 • Our team’s reputation as a reliable counterparty has $1,000 contributed to multiple investment opportunities with millions)inPortfolio($UPB $667 repeat borrowers $500 $- 2015 2016 2017 2018 YTD 2019 We believe that credibility, reliability and (1) Portfolio principal balance as of 12/31/15, 12/31/16, 12/31/17, 12/31/18, and 6/30/19 reputation drive repeat business and fuel our success as an originator 14
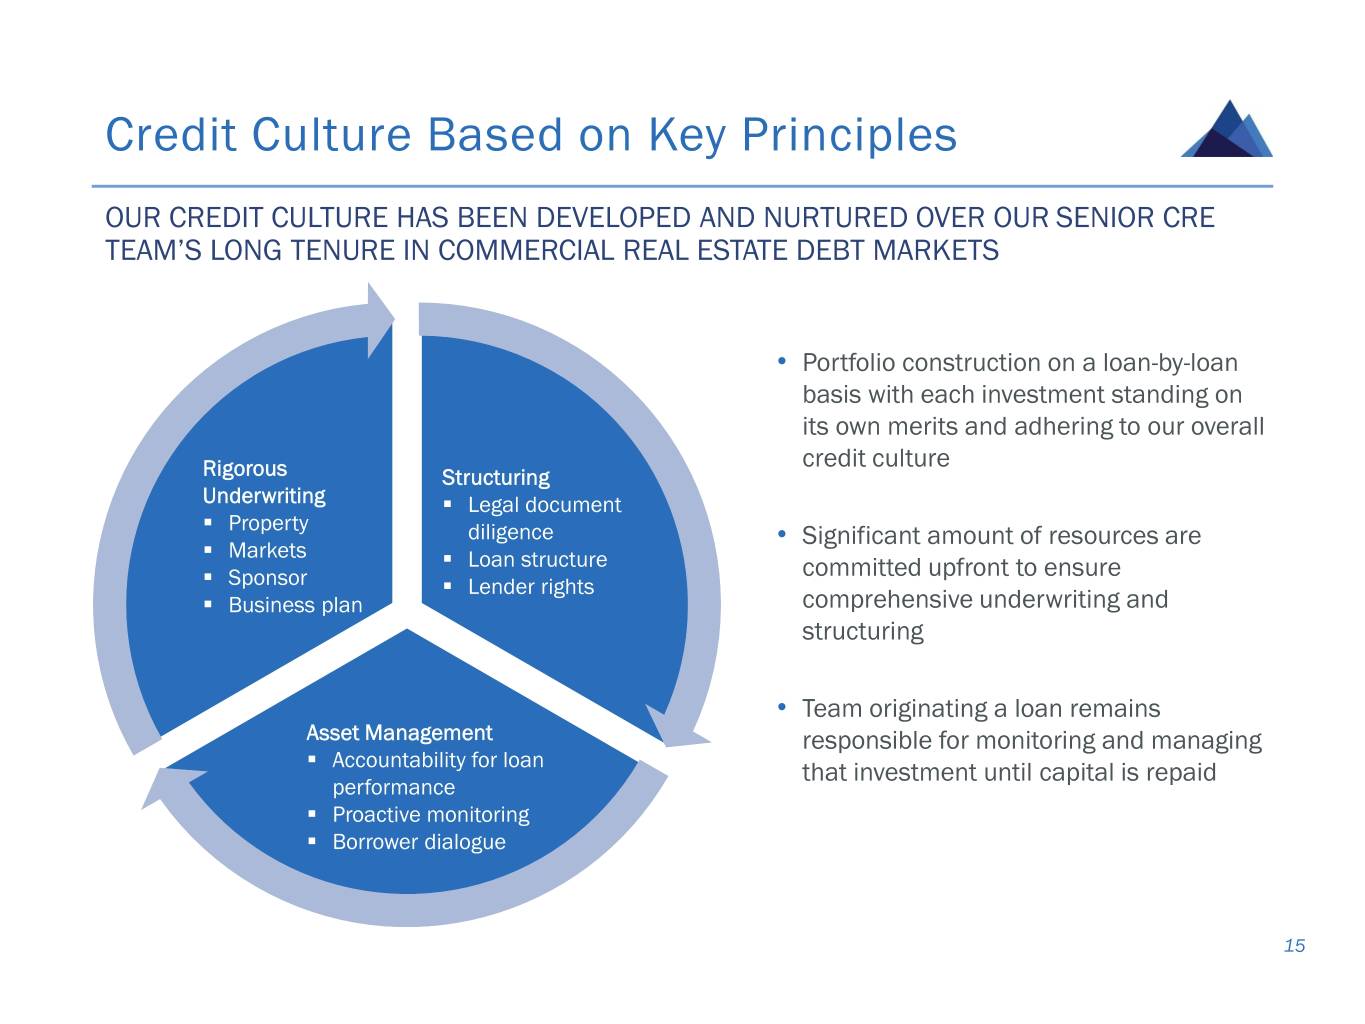
Credit Culture Based on Key Principles OUR CREDIT CULTURE HAS BEEN DEVELOPED AND NURTURED OVER OUR SENIOR CRE TEAM’S LONG TENURE IN COMMERCIAL REAL ESTATE DEBT MARKETS • Portfolio construction on a loan-by-loan basis with each investment standing on its own merits and adhering to our overall credit culture Rigorous Structuring Underwriting . Legal document . Property diligence • Significant amount of resources are . Markets . Loan structure committed upfront to ensure . Sponsor . Lender rights . Business plan comprehensive underwriting and structuring • Team originating a loan remains Asset Management responsible for monitoring and managing . Accountability for loan that investment until capital is repaid performance . Proactive monitoring . Borrower dialogue 15

Portfolio Overview
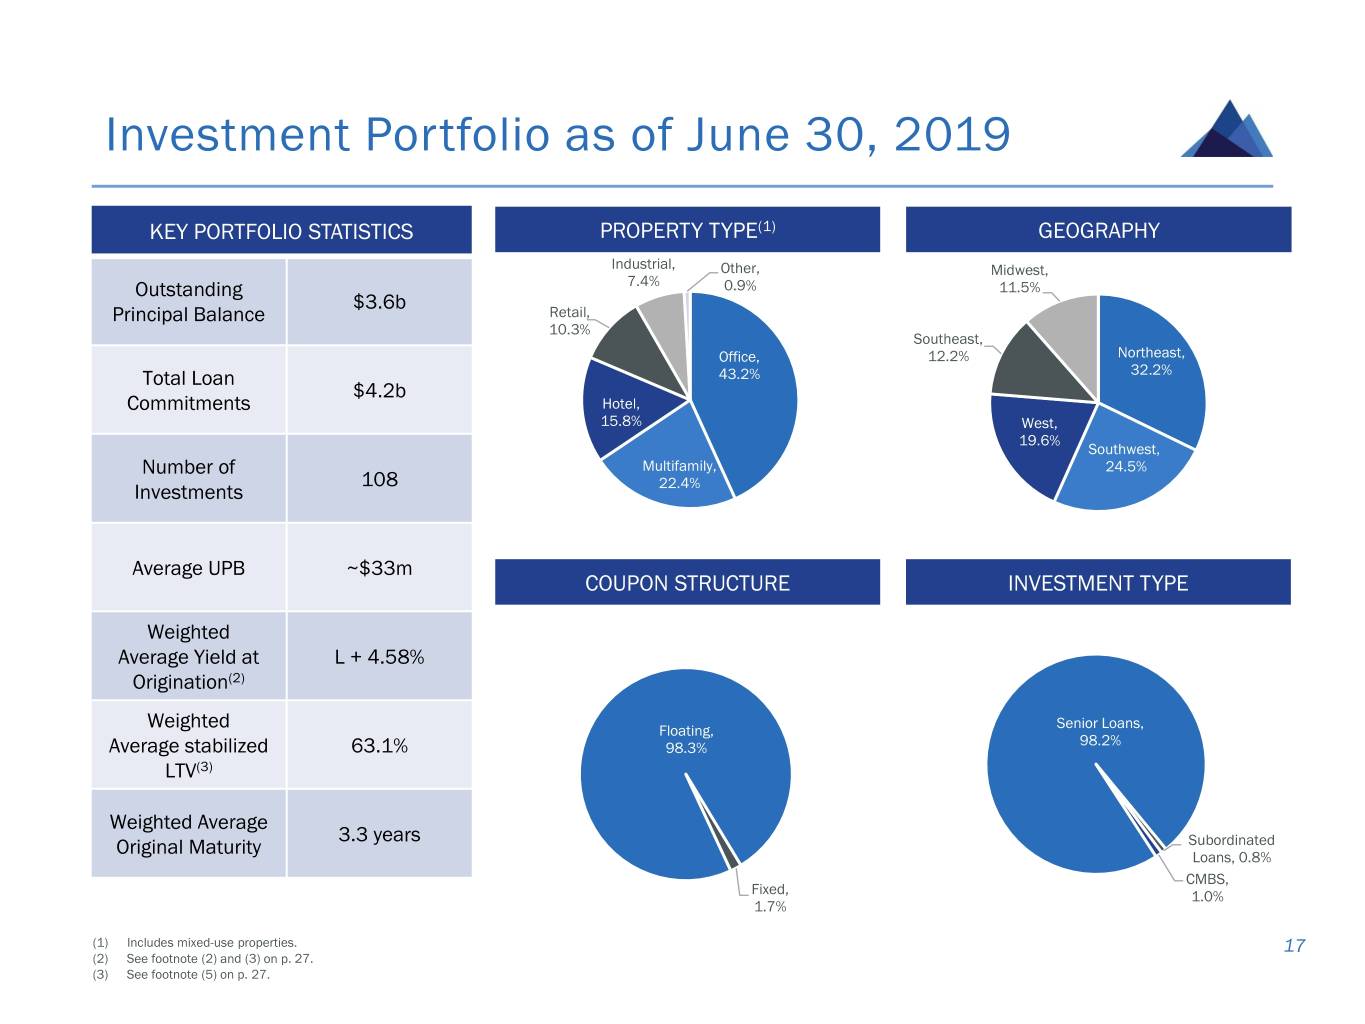
Investment Portfolio as of June 30, 2019 KEY PORTFOLIO STATISTICS PROPERTY TYPE(1) GEOGRAPHY Industrial, Other, Midwest, Outstanding 7.4% 0.9% 11.5% $3.6b Principal Balance Retail, 10.3% Southeast, Office, 12.2% Northeast, Total Loan 43.2% 32.2% $4.2b Commitments Hotel, 15.8% West, 19.6% Southwest, Number of Multifamily, 24.5% 108 Investments 22.4% Average UPB ~$33m COUPON STRUCTURE INVESTMENT TYPE Weighted Average Yield at L + 4.58% Origination(2) Senior Loans, Weighted Floating, 98.2% Average stabilized 63.1% 98.3% LTV(3) Weighted Average 3.3 years Subordinated Original Maturity Loans, 0.8% CMBS, Fixed, 1.0% 1.7% (1) Includes mixed-use properties. 17 (2) See footnote (2) and (3) on p. 27. (3) See footnote (5) on p. 27.
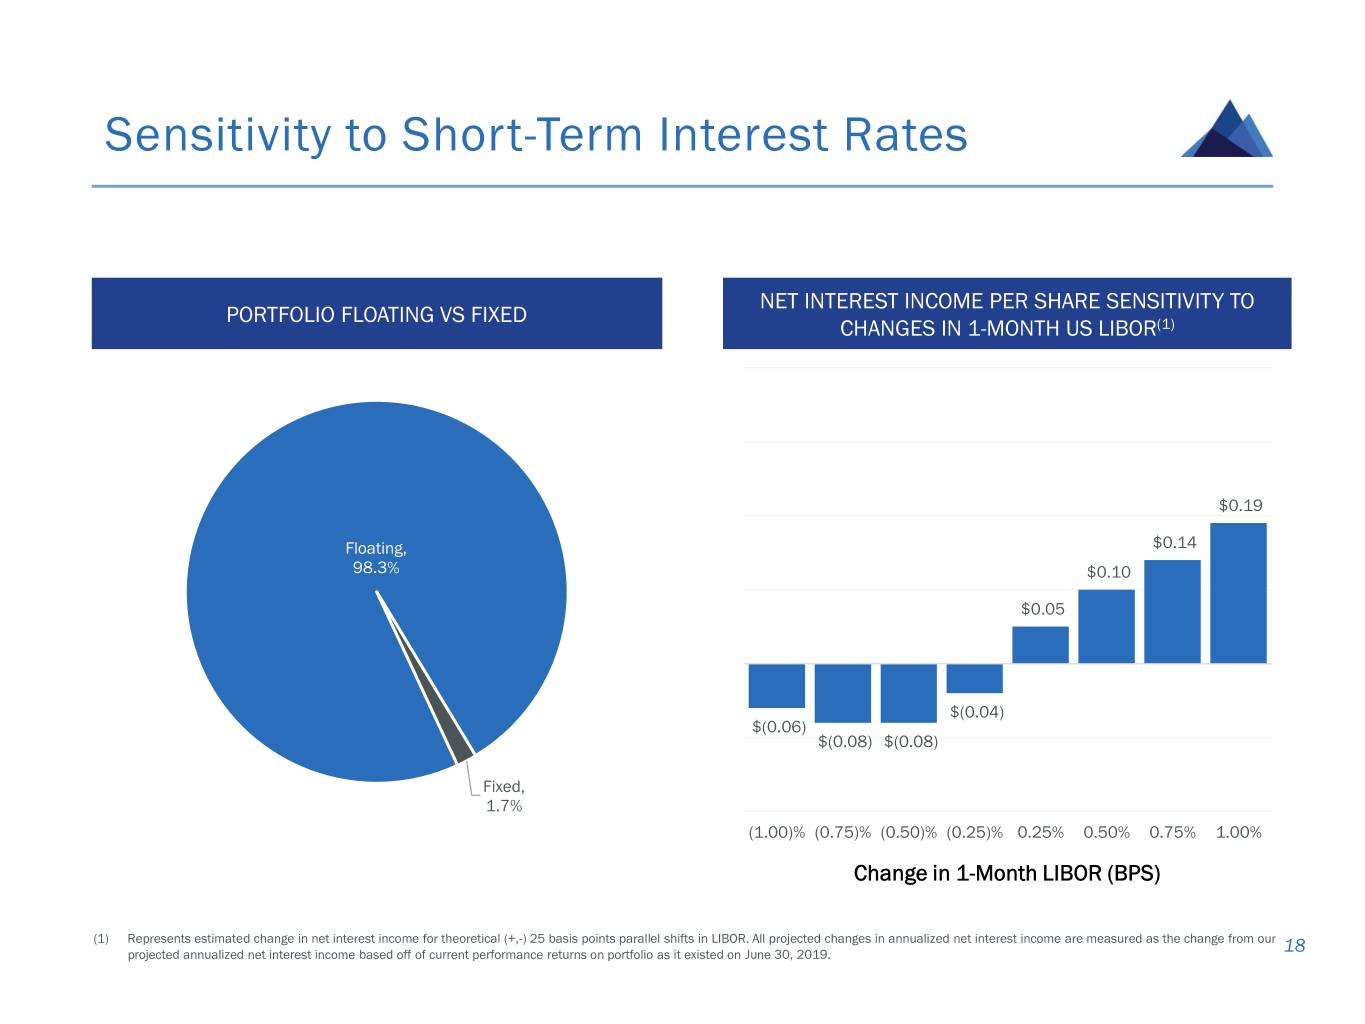
Sensitivity to Short-Term Interest Rates NET INTEREST INCOME PER SHARE SENSITIVITY TO PORTFOLIO FLOATING VS FIXED CHANGES IN 1-MONTH US LIBOR(1) $0.19 Floating, $0.14 98.3% $0.10 $0.05 $(0.04) $(0.06) $(0.08) $(0.08) Fixed, 1.7% (1.00)% (0.75)% (0.50)% (0.25)% 0.25% 0.50% 0.75% 1.00% Change in 1-Month LIBOR (BPS) (1) Represents estimated change in net interest income for theoretical (+,-) 25 basis points parallel shifts in LIBOR. All projected changes in annualized net interest income are measured as the change from our projected annualized net interest income based off of current performance returns on portfolio as it existed on June 30, 2019. 18
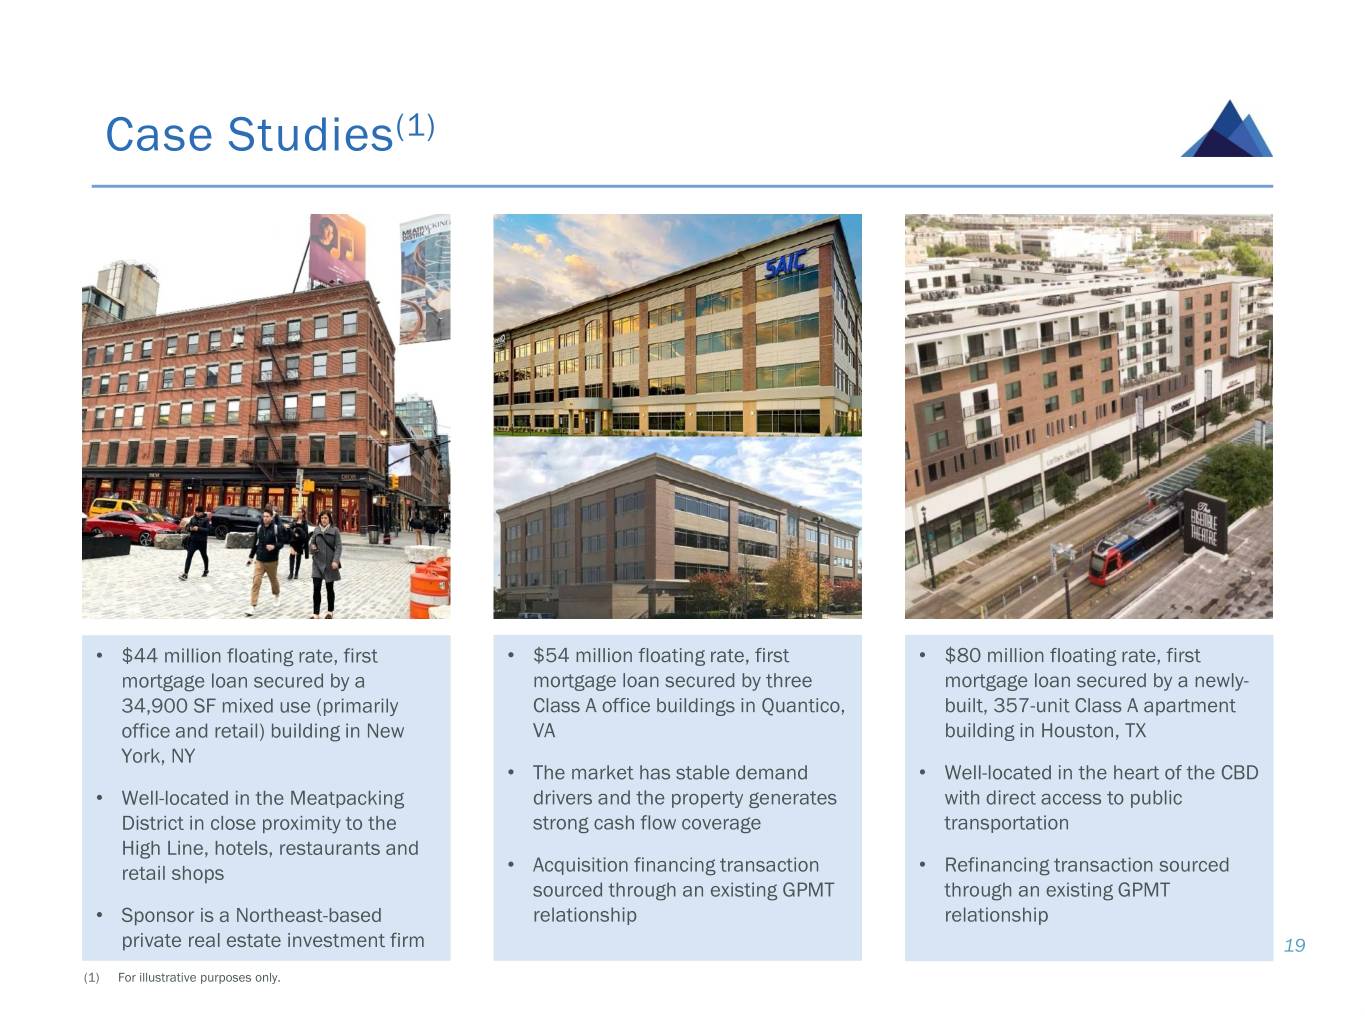
Case Studies(1) • $44 million floating rate, first • $54 million floating rate, first • $80 million floating rate, first mortgage loan secured by a mortgage loan secured by three mortgage loan secured by a newly- 34,900 SF mixed use (primarily Class A office buildings in Quantico, built, 357-unit Class A apartment office and retail) building in New VA building in Houston, TX York, NY • The market has stable demand • Well-located in the heart of the CBD • Well-located in the Meatpacking drivers and the property generates with direct access to public District in close proximity to the strong cash flow coverage transportation High Line, hotels, restaurants and retail shops • Acquisition financing transaction • Refinancing transaction sourced sourced through an existing GPMT through an existing GPMT • Sponsor is a Northeast-based relationship relationship private real estate investment firm 19 (1) For illustrative purposes only.

Financial Highlights
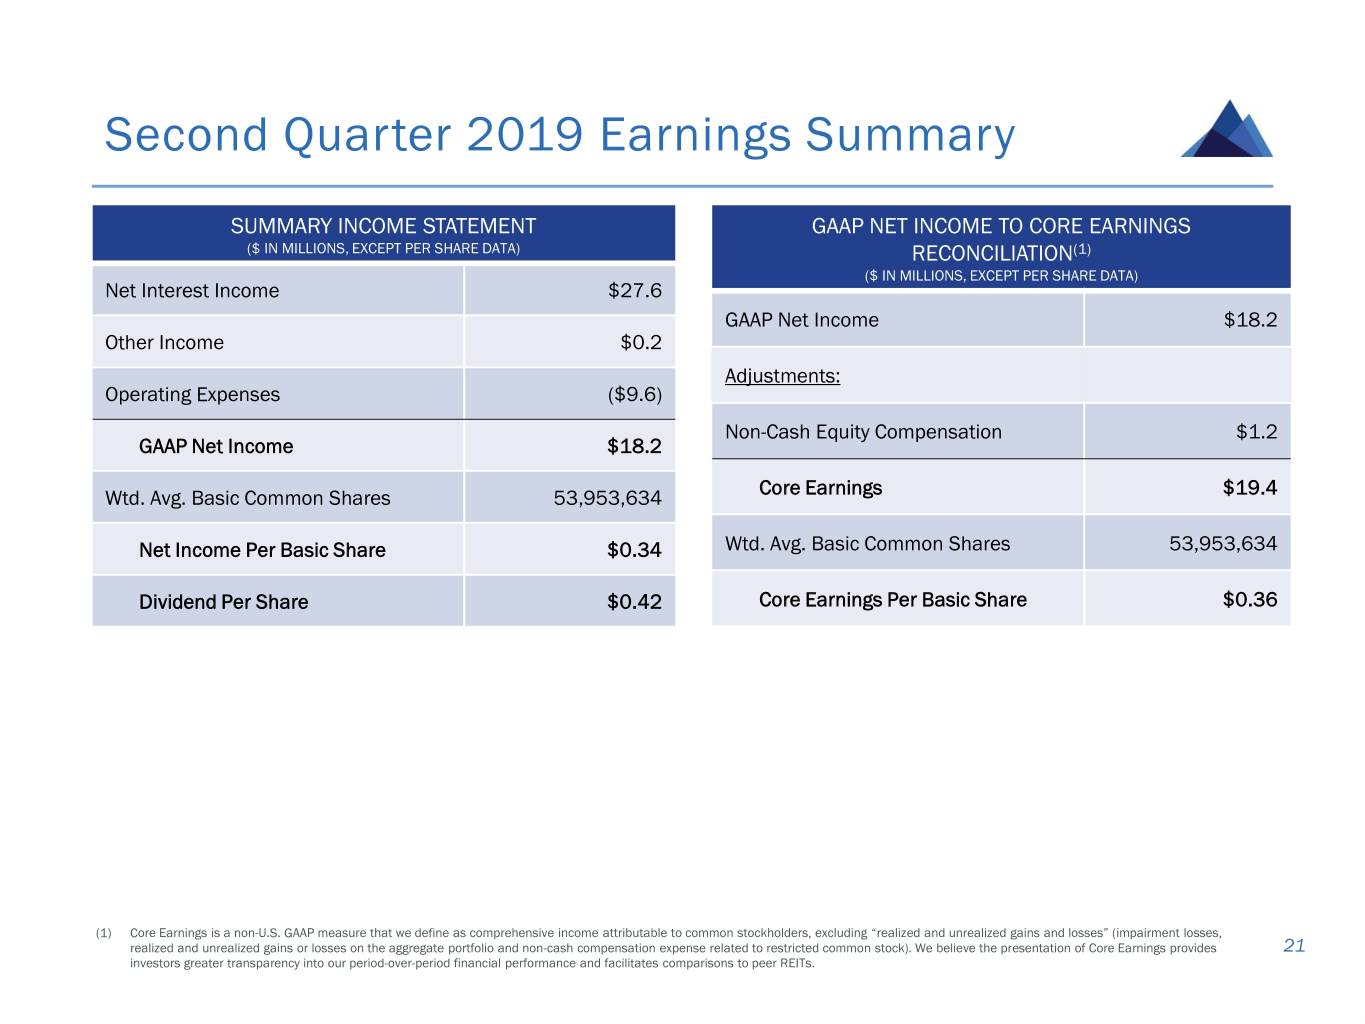
Second Quarter 2019 Earnings Summary SUMMARY INCOME STATEMENT GAAP NET INCOME TO CORE EARNINGS ($ IN MILLIONS, EXCEPT PER SHARE DATA) RECONCILIATION(1) ($ IN MILLIONS, EXCEPT PER SHARE DATA) Net Interest Income $27.6 GAAP Net Income $18.2 Other Income $0.2 Adjustments: Operating Expenses ($9.6) Non-Cash Equity Compensation $1.2 GAAP Net Income $18.2 Wtd. Avg. Basic Common Shares 53,953,634 Core Earnings $19.4 Net Income Per Basic Share $0.34 Wtd. Avg. Basic Common Shares 53,953,634 Dividend Per Share $0.42 Core Earnings Per Basic Share $0.36 (1) Core Earnings is a non-U.S. GAAP measure that we define as comprehensive income attributable to common stockholders, excluding “realized and unrealized gains and losses” (impairment losses, realized and unrealized gains or losses on the aggregate portfolio and non-cash compensation expense related to restricted common stock). We believe the presentation of Core Earnings provides 21 investors greater transparency into our period-over-period financial performance and facilitates comparisons to peer REITs.
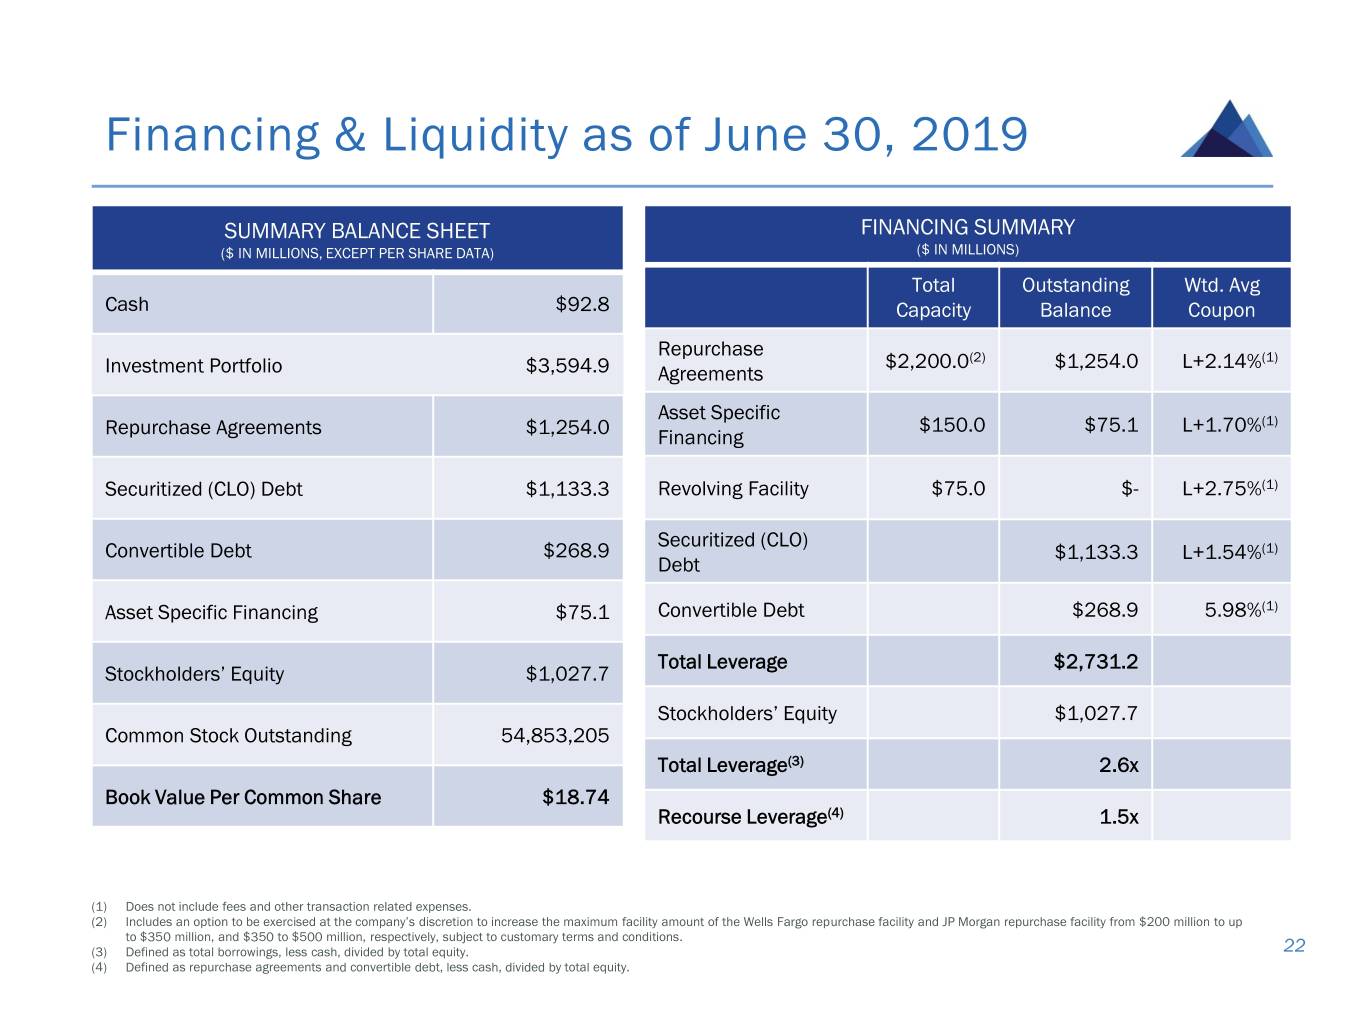
Financing & Liquidity as of June 30, 2019 SUMMARY BALANCE SHEET FINANCING SUMMARY ($ IN MILLIONS, EXCEPT PER SHARE DATA) ($ IN MILLIONS) Total Outstanding Wtd. Avg Cash $92.8 Capacity Balance Coupon Repurchase $2,200.0(2) $1,254.0 L+2.14%(1) Investment Portfolio $3,594.9 Agreements Asset Specific $150.0 $75.1 L+1.70%(1) Repurchase Agreements $1,254.0 Financing Securitized (CLO) Debt $1,133.3 Revolving Facility $75.0 $- L+2.75%(1) Securitized (CLO) Convertible Debt $268.9 $1,133.3 L+1.54%(1) Debt Asset Specific Financing $75.1 Convertible Debt $268.9 5.98%(1) Total Leverage $2,731.2 Stockholders’ Equity $1,027.7 Stockholders’ Equity $1,027.7 Common Stock Outstanding 54,853,205 Total Leverage(3) 2.6x Book Value Per Common Share $18.74 Recourse Leverage(4) 1.5x (1) Does not include fees and other transaction related expenses. (2) Includes an option to be exercised at the company’s discretion to increase the maximum facility amount of the Wells Fargo repurchase facility and JP Morgan repurchase facility from $200 million to up to $350 million, and $350 to $500 million, respectively, subject to customary terms and conditions. (3) Defined as total borrowings, less cash, divided by total equity. 22 (4) Defined as repurchase agreements and convertible debt, less cash, divided by total equity.
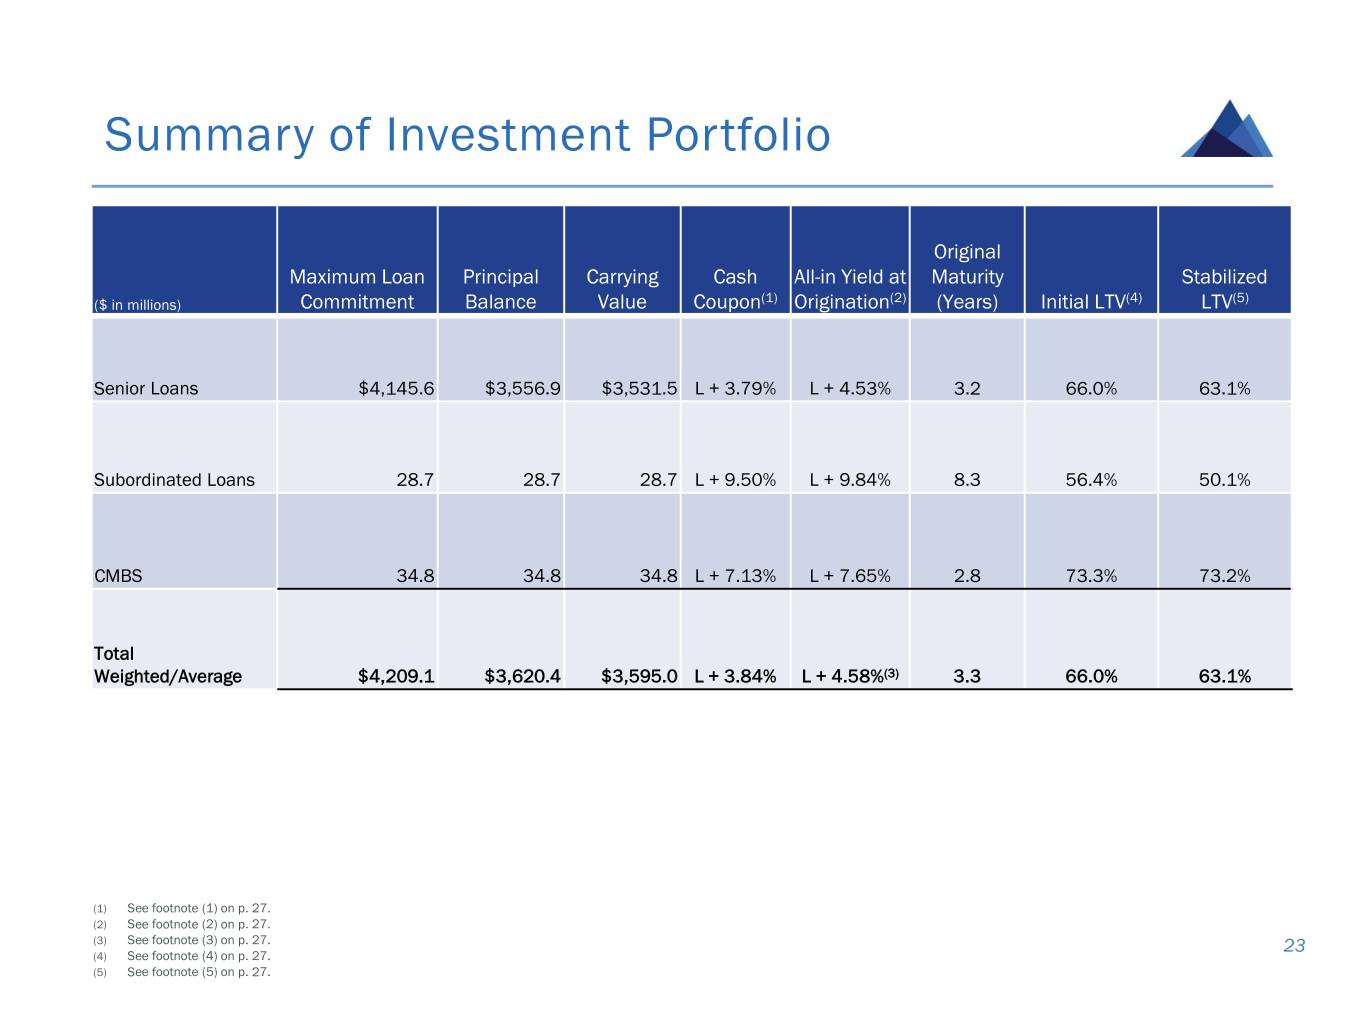
Summary of Investment Portfolio Original Maximum Loan Principal Carrying Cash All-in Yield at Maturity Stabilized ($ in millions) Commitment Balance Value Coupon(1) Origination(2) (Years) Initial LTV(4) LTV(5) Senior Loans $4,145.6 $3,556.9 $3,531.5 L + 3.79% L + 4.53% 3.2 66.0% 63.1% Subordinated Loans 28.7 28.7 28.7 L + 9.50% L + 9.84% 8.3 56.4% 50.1% CMBS 34.8 34.8 34.8 L + 7.13% L + 7.65% 2.8 73.3% 73.2% Total Weighted/Average $4,209.1 $3,620.4 $3,595.0 L + 3.84% L + 4.58%(3) 3.3 66.0% 63.1% (1) See footnote (1) on p. 27. (2) See footnote (2) on p. 27. (3) See footnote (3) on p. 27. 23 (4) See footnote (4) on p. 27. (5) See footnote (5) on p. 27.
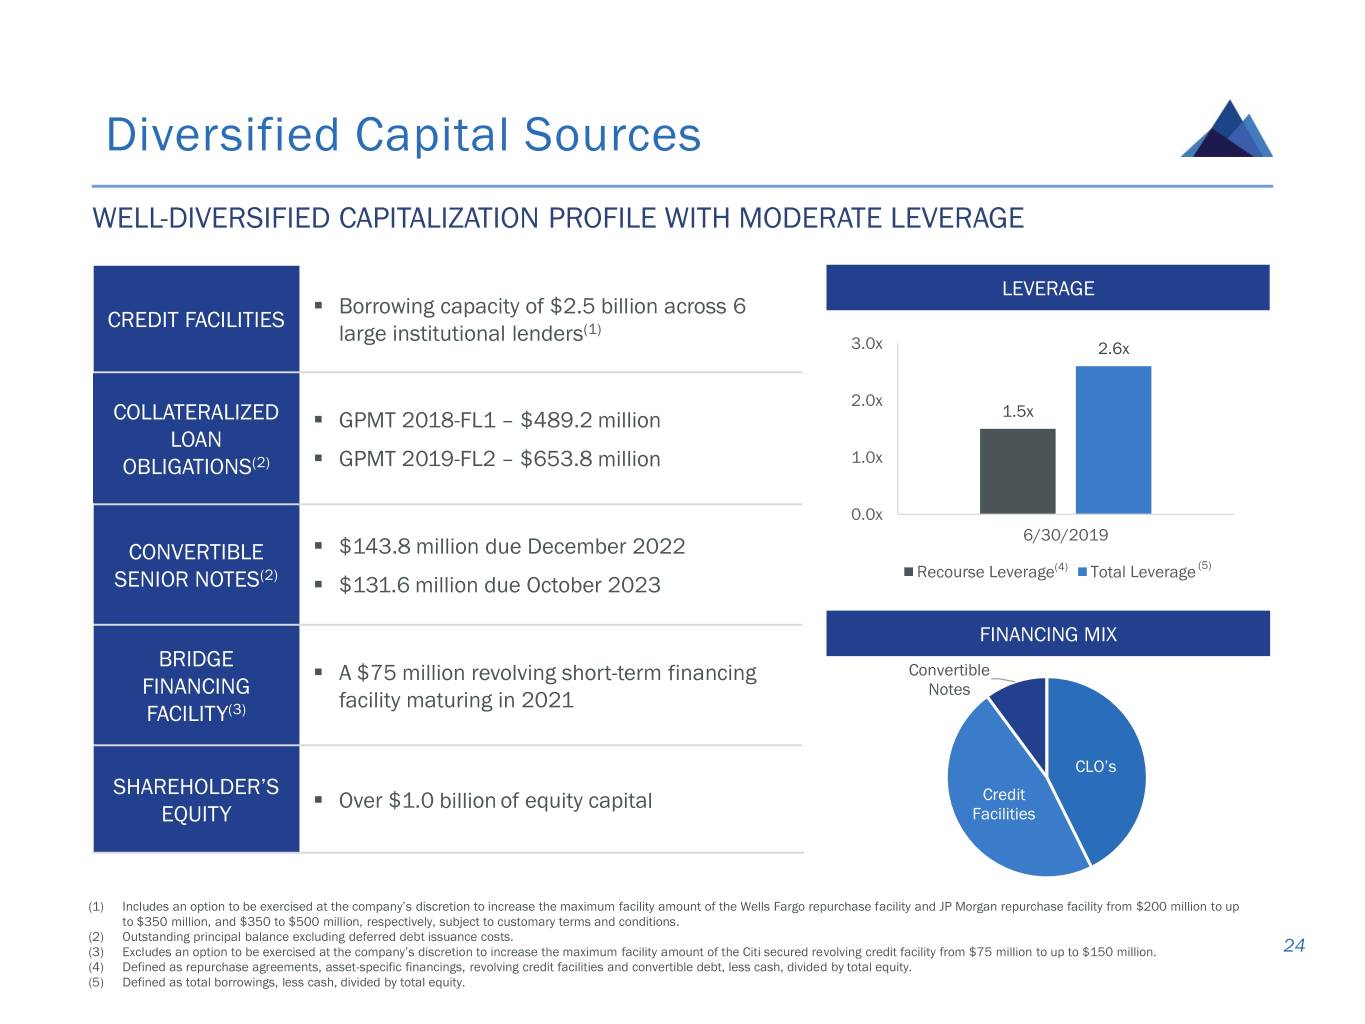
Diversified Capital Sources WELL-DIVERSIFIED CAPITALIZATION PROFILE WITH MODERATE LEVERAGE LEVERAGE . Borrowing capacity of $2.5 billion across 6 CREDIT FACILITIES large institutional lenders(1) 3.0x 2.6x 2.0x COLLATERALIZED . GPMT 2018-FL1 – $489.2 million 1.5x LOAN OBLIGATIONS(2) . GPMT 2019-FL2 – $653.8 million 1.0x 0.0x 6/30/2019 CONVERTIBLE . $143.8 million due December 2022 Recourse Leverage(4) Total Leverage (5) SENIOR NOTES(2) . $131.6 million due October 2023 FINANCING MIX BRIDGE . A $75 million revolving short-term financing Convertible FINANCING facility maturing in 2021 Notes FACILITY(3) CLO’s SHAREHOLDER’S . Over $1.0 billion of equity capital Credit EQUITY Facilities (1) Includes an option to be exercised at the company’s discretion to increase the maximum facility amount of the Wells Fargo repurchase facility and JP Morgan repurchase facility from $200 million to up to $350 million, and $350 to $500 million, respectively, subject to customary terms and conditions. (2) Outstanding principal balance excluding deferred debt issuance costs. (3) Excludes an option to be exercised at the company’s discretion to increase the maximum facility amount of the Citi secured revolving credit facility from $75 million to up to $150 million. 24 (4) Defined as repurchase agreements, asset-specific financings, revolving credit facilities and convertible debt, less cash, divided by total equity. (5) Defined as total borrowings, less cash, divided by total equity.
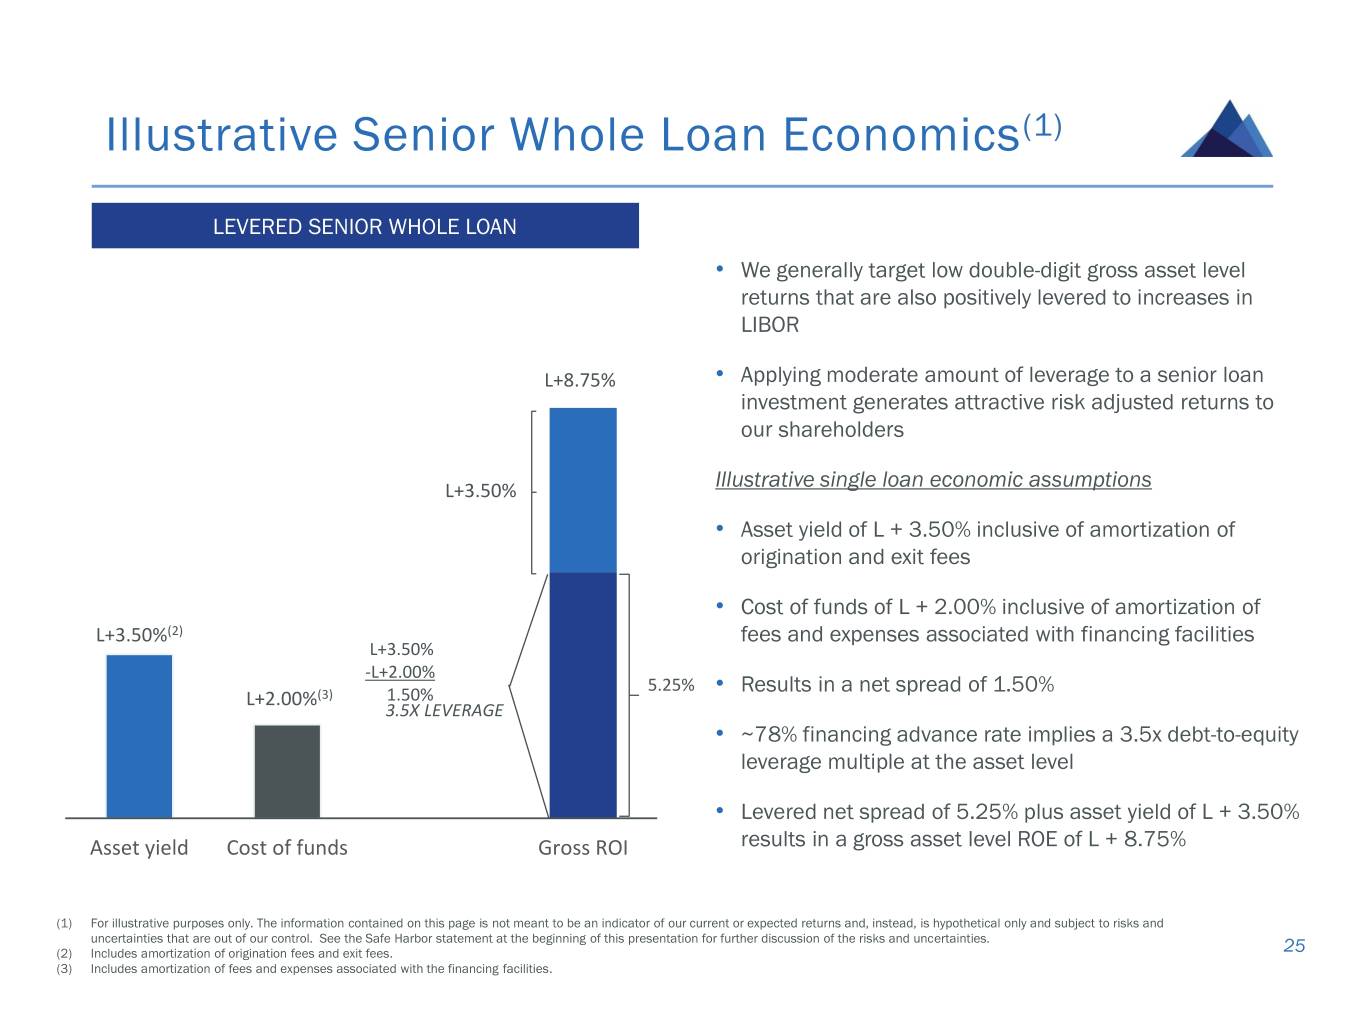
Illustrative Senior Whole Loan Economics(1) LEVERED SENIOR WHOLE LOAN • We generally target low double-digit gross asset level returns that are also positively levered to increases in LIBOR L+8.75% • Applying moderate amount of leverage to a senior loan investment generates attractive risk adjusted returns to our shareholders Illustrative single loan economic assumptions L+3.50% • Asset yield of L + 3.50% inclusive of amortization of origination and exit fees • Cost of funds of L + 2.00% inclusive of amortization of L+3.50%(2) fees and expenses associated with financing facilities L+3.50% -L+2.00% 5.25% • Results in a net spread of 1.50% L+2.00%(3) 1.50% 3.5X LEVERAGE • ~78% financing advance rate implies a 3.5x debt-to-equity leverage multiple at the asset level • Levered net spread of 5.25% plus asset yield of L + 3.50% Asset yield Cost of funds Gross ROI results in a gross asset level ROE of L + 8.75% (1) For illustrative purposes only. The information contained on this page is not meant to be an indicator of our current or expected returns and, instead, is hypothetical only and subject to risks and uncertainties that are out of our control. See the Safe Harbor statement at the beginning of this presentation for further discussion of the risks and uncertainties. (2) Includes amortization of origination fees and exit fees. 25 (3) Includes amortization of fees and expenses associated with the financing facilities.

Appendix
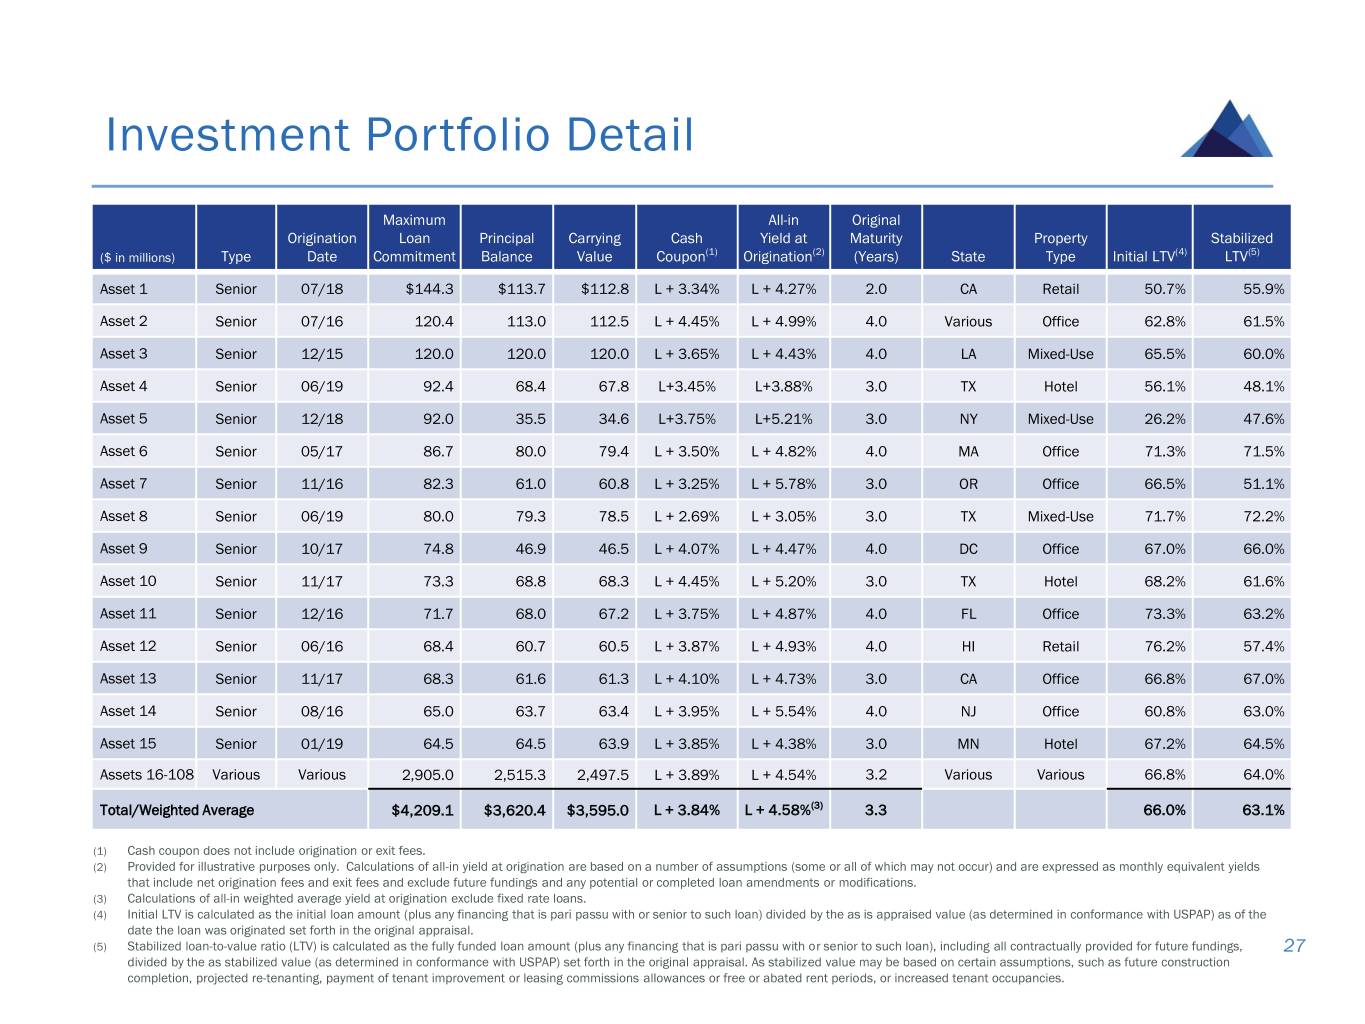
Investment Portfolio Detail Maximum All-in Original Origination Loan Principal Carrying Cash Yield at Maturity Property Stabilized ($ in millions) Type Date Commitment Balance Value Coupon(1) Origination(2) (Years) State Type Initial LTV(4) LTV(5) Asset 1 Senior 07/18 $144.3 $113.7 $112.8 L + 3.34% L + 4.27% 2.0 CA Retail 50.7% 55.9% Asset 2 Senior 07/16 120.4 113.0 112.5 L + 4.45% L + 4.99% 4.0 Various Office 62.8% 61.5% Asset 3 Senior 12/15 120.0 120.0 120.0 L + 3.65% L + 4.43% 4.0 LA Mixed-Use 65.5% 60.0% Asset 4 Senior 06/19 92.4 68.4 67.8 L+3.45% L+3.88% 3.0 TX Hotel 56.1% 48.1% Asset 5 Senior 12/18 92.0 35.5 34.6 L+3.75% L+5.21% 3.0 NY Mixed-Use 26.2% 47.6% Asset 6 Senior 05/17 86.7 80.0 79.4 L + 3.50% L + 4.82% 4.0 MA Office 71.3% 71.5% Asset 7 Senior 11/16 82.3 61.0 60.8 L + 3.25% L + 5.78% 3.0 OR Office 66.5% 51.1% Asset 8 Senior 06/19 80.0 79.3 78.5 L + 2.69% L + 3.05% 3.0 TX Mixed-Use 71.7% 72.2% Asset 9 Senior 10/17 74.8 46.9 46.5 L + 4.07% L + 4.47% 4.0 DC Office 67.0% 66.0% Asset 10 Senior 11/17 73.3 68.8 68.3 L + 4.45% L + 5.20% 3.0 TX Hotel 68.2% 61.6% Asset 11 Senior 12/16 71.7 68.0 67.2 L + 3.75% L + 4.87% 4.0 FL Office 73.3% 63.2% Asset 12 Senior 06/16 68.4 60.7 60.5 L + 3.87% L + 4.93% 4.0 HI Retail 76.2% 57.4% Asset 13 Senior 11/17 68.3 61.6 61.3 L + 4.10% L + 4.73% 3.0 CA Office 66.8% 67.0% Asset 14 Senior 08/16 65.0 63.7 63.4 L + 3.95% L + 5.54% 4.0 NJ Office 60.8% 63.0% Asset 15 Senior 01/19 64.5 64.5 63.9 L + 3.85% L + 4.38% 3.0 MN Hotel 67.2% 64.5% Assets 16-108 Various Various 2,905.0 2,515.3 2,497.5 L + 3.89% L + 4.54% 3.2 Various Various 66.8% 64.0% Total/Weighted Average $4,209.1 $3,620.4 $3,595.0 L + 3.84% L + 4.58%(3) 3.3 66.0% 63.1% (1) Cash coupon does not include origination or exit fees. (2) Provided for illustrative purposes only. Calculations of all-in yield at origination are based on a number of assumptions (some or all of which may not occur) and are expressed as monthly equivalent yields that include net origination fees and exit fees and exclude future fundings and any potential or completed loan amendments or modifications. (3) Calculations of all-in weighted average yield at origination exclude fixed rate loans. (4) Initial LTV is calculated as the initial loan amount (plus any financing that is pari passu with or senior to such loan) divided by the as is appraised value (as determined in conformance with USPAP) as of the date the loan was originated set forth in the original appraisal. (5) Stabilized loan-to-value ratio (LTV) is calculated as the fully funded loan amount (plus any financing that is pari passu with or senior to such loan), including all contractually provided for future fundings, 27 divided by the as stabilized value (as determined in conformance with USPAP) set forth in the original appraisal. As stabilized value may be based on certain assumptions, such as future construction completion, projected re-tenanting, payment of tenant improvement or leasing commissions allowances or free or abated rent periods, or increased tenant occupancies.
