August 10, 2021 Second Quarter 2021 Earnings Presentation
Safe Harbor Statement This presentation contains, or incorporates by reference, not only historical information, but also forward-looking statements within the meaning of the Private Securities Litigation Reform Act of 1995. Forward-looking statements involve numerous risks and uncertainties. Our actual results may differ from our beliefs, expectations, estimates and projections and, consequently, you should not rely on these forward-looking statements as predictions of future events. Forward-looking statements are not historical in nature and can be identified by words such as “anticipate,” “estimate,” “will,” “should,” “expect,” “target,” “believe,” “outlook,” “potential,” “continue,” “intend,” “seek,” “plan,” “goals,” “future,” “likely,” “may” and similar expressions or their negative forms, or by references to strategy, plans or intentions. By their nature, forward-looking statements speak only as of the date they are made, are not statements of historical facts or guarantees of future performance and are subject to risks, uncertainties, assumptions or changes in circumstances that are difficult to predict or quantify, in particular those related to the COVID-19 pandemic, including the ultimate impact of COVID-19 on our business, financial performance and operating results. Our expectations, beliefs and estimates are expressed in good faith and we believe there is a reasonable basis for them. However, there can be no assurance that management's expectations, beliefs and estimates will prove to be correct or be achieved, and actual results may vary materially from what is expressed in or indicated by the forward-looking statements. These forward-looking statements are subject to risks and uncertainties, including, among other things, those described in our Annual Report on Form 10-K for the year ended December 31, 2020 and any subsequent Form 10-Q and Form 8-K filings made with the SEC, under the caption “Risk Factors.” These risks may also be further heightened by the continued and evolving impact of the COVID-19 pandemic. Forward-looking statements speak only as of the date they are made, and we undertake no obligation to update or revise any such forward-looking statements, whether as a result of new information, future events or otherwise. This presentation is for informational purposes only and shall not constitute, or form a part of, an offer to sell or buy or the solicitation of an offer to sell or the solicitation of an offer to buy any securities. 2
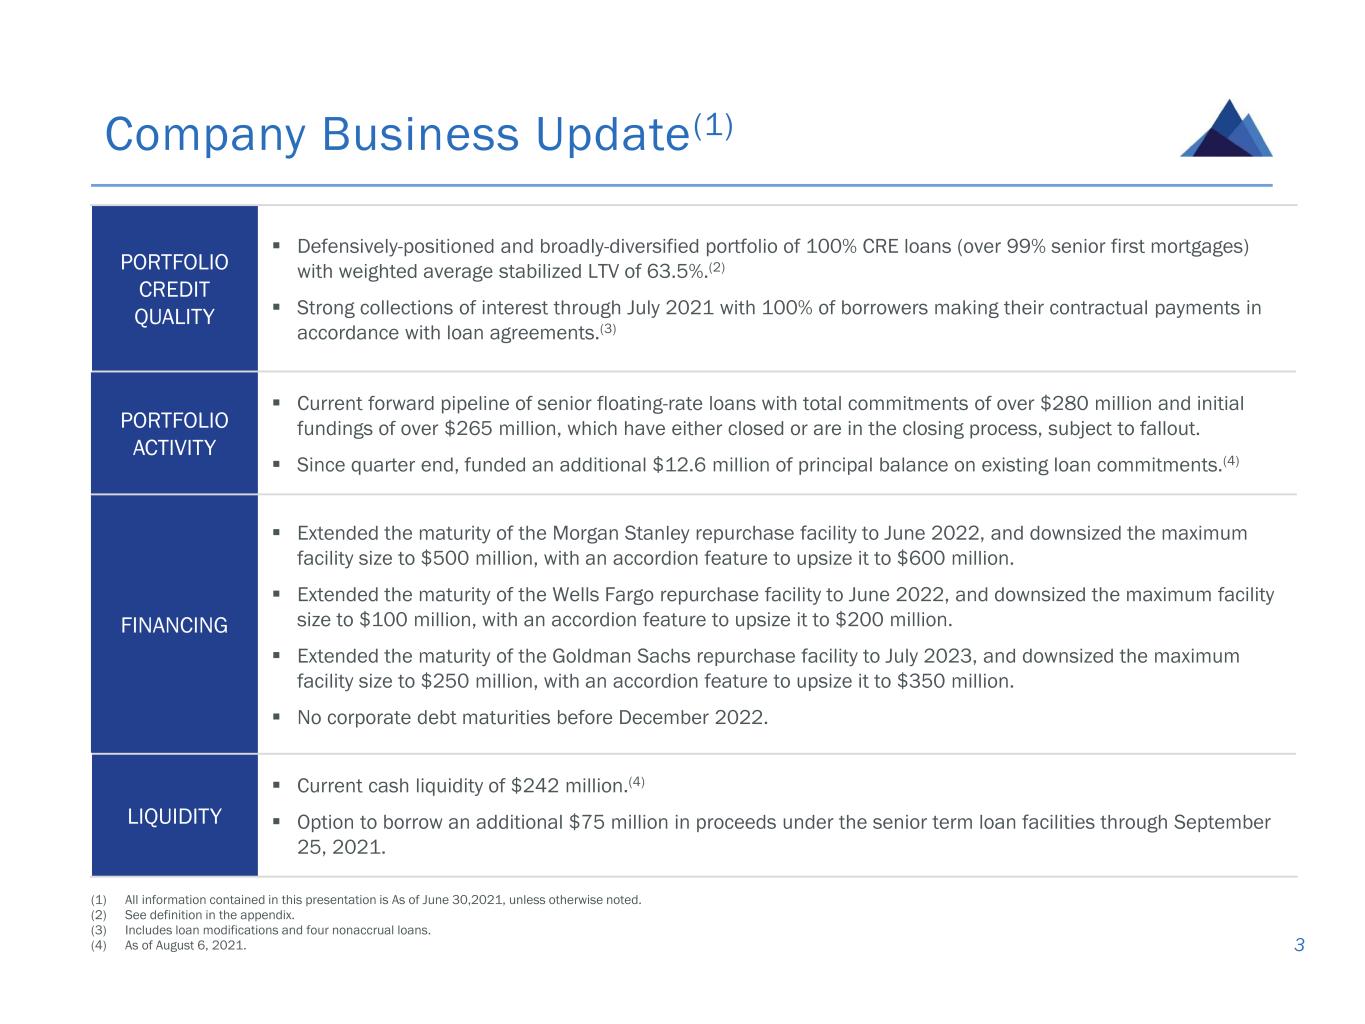
PORTFOLIO CREDIT QUALITY ▪ Defensively-positioned and broadly-diversified portfolio of 100% CRE loans (over 99% senior first mortgages) with weighted average stabilized LTV of 63.5%.(2) ▪ Strong collections of interest through July 2021 with 100% of borrowers making their contractual payments in accordance with loan agreements.(3) PORTFOLIO ACTIVITY ▪ Current forward pipeline of senior floating-rate loans with total commitments of over $280 million and initial fundings of over $265 million, which have either closed or are in the closing process, subject to fallout. ▪ Since quarter end, funded an additional $12.6 million of principal balance on existing loan commitments.(4) FINANCING ▪ Extended the maturity of the Morgan Stanley repurchase facility to June 2022, and downsized the maximum facility size to $500 million, with an accordion feature to upsize it to $600 million. ▪ Extended the maturity of the Wells Fargo repurchase facility to June 2022, and downsized the maximum facility size to $100 million, with an accordion feature to upsize it to $200 million. ▪ Extended the maturity of the Goldman Sachs repurchase facility to July 2023, and downsized the maximum facility size to $250 million, with an accordion feature to upsize it to $350 million. ▪ No corporate debt maturities before December 2022. LIQUIDITY ▪ Current cash liquidity of $242 million.(4) ▪ Option to borrow an additional $75 million in proceeds under the senior term loan facilities through September 25, 2021. Company Business Update(1) 3 (1) All information contained in this presentation is As of June 30,2021, unless otherwise noted. (2) See definition in the appendix. (3) Includes loan modifications and four nonaccrual loans. (4) As of August 6, 2021.
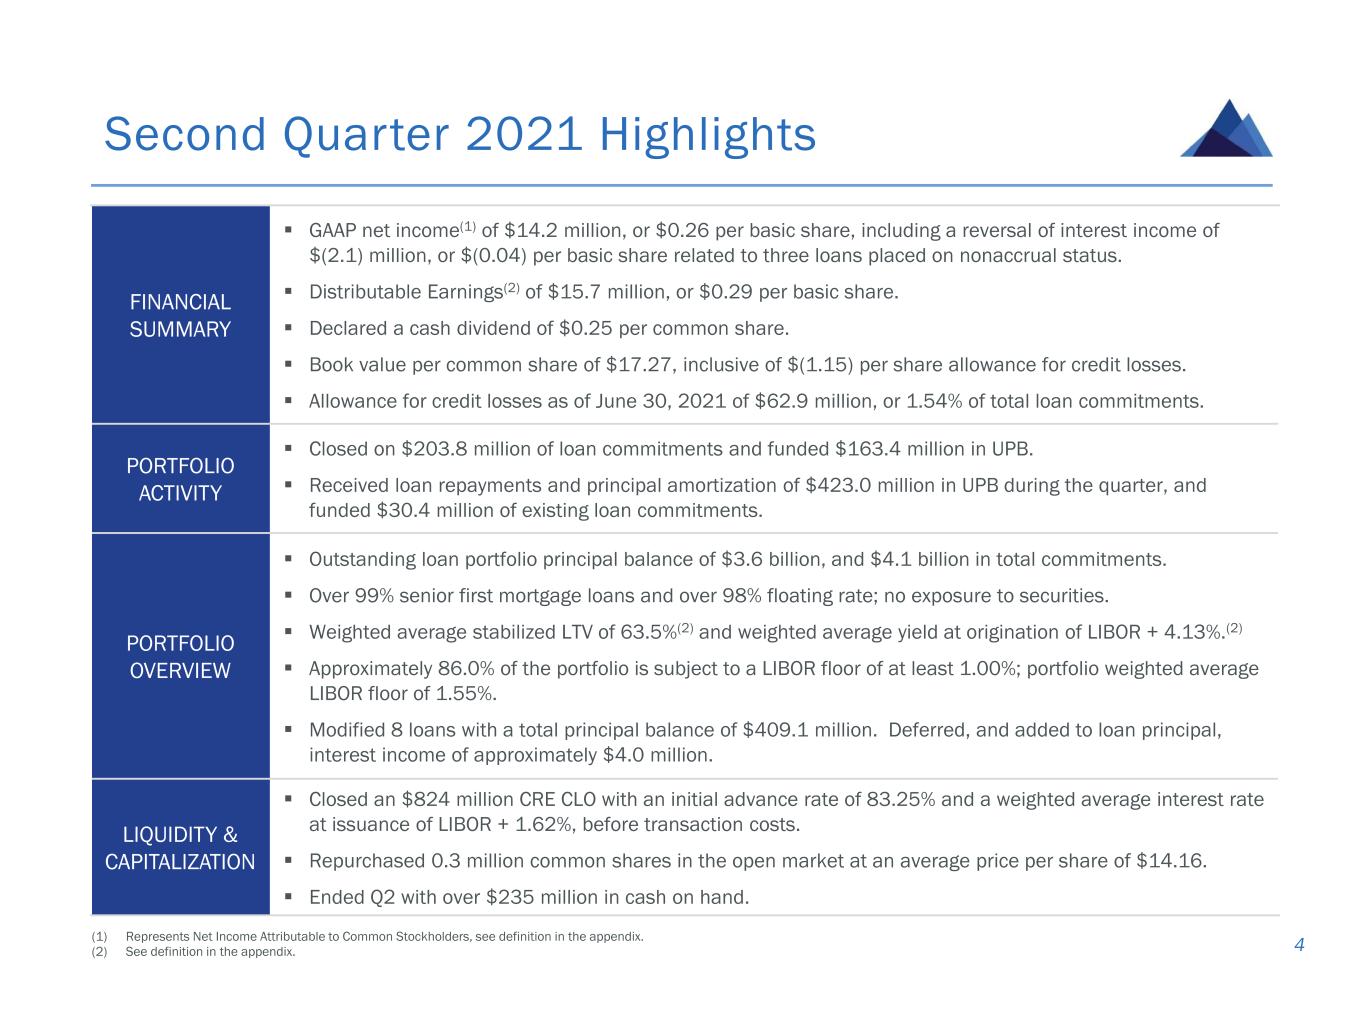
Second Quarter 2021 Highlights 4 (1) Represents Net Income Attributable to Common Stockholders, see definition in the appendix. (2) See definition in the appendix. FINANCIAL SUMMARY ▪ GAAP net income(1) of $14.2 million, or $0.26 per basic share, including a reversal of interest income of $(2.1) million, or $(0.04) per basic share related to three loans placed on nonaccrual status. ▪ Distributable Earnings(2) of $15.7 million, or $0.29 per basic share. ▪ Declared a cash dividend of $0.25 per common share. ▪ Book value per common share of $17.27, inclusive of $(1.15) per share allowance for credit losses. ▪ Allowance for credit losses as of June 30, 2021 of $62.9 million, or 1.54% of total loan commitments. PORTFOLIO ACTIVITY ▪ Closed on $203.8 million of loan commitments and funded $163.4 million in UPB. ▪ Received loan repayments and principal amortization of $423.0 million in UPB during the quarter, and funded $30.4 million of existing loan commitments. PORTFOLIO OVERVIEW ▪ Outstanding loan portfolio principal balance of $3.6 billion, and $4.1 billion in total commitments. ▪ Over 99% senior first mortgage loans and over 98% floating rate; no exposure to securities. ▪ Weighted average stabilized LTV of 63.5%(2) and weighted average yield at origination of LIBOR + 4.13%.(2) ▪ Approximately 86.0% of the portfolio is subject to a LIBOR floor of at least 1.00%; portfolio weighted average LIBOR floor of 1.55%. ▪ Modified 8 loans with a total principal balance of $409.1 million. Deferred, and added to loan principal, interest income of approximately $4.0 million. LIQUIDITY & CAPITALIZATION ▪ Closed an $824 million CRE CLO with an initial advance rate of 83.25% and a weighted average interest rate at issuance of LIBOR + 1.62%, before transaction costs. ▪ Repurchased 0.3 million common shares in the open market at an average price per share of $14.16. ▪ Ended Q2 with over $235 million in cash on hand.
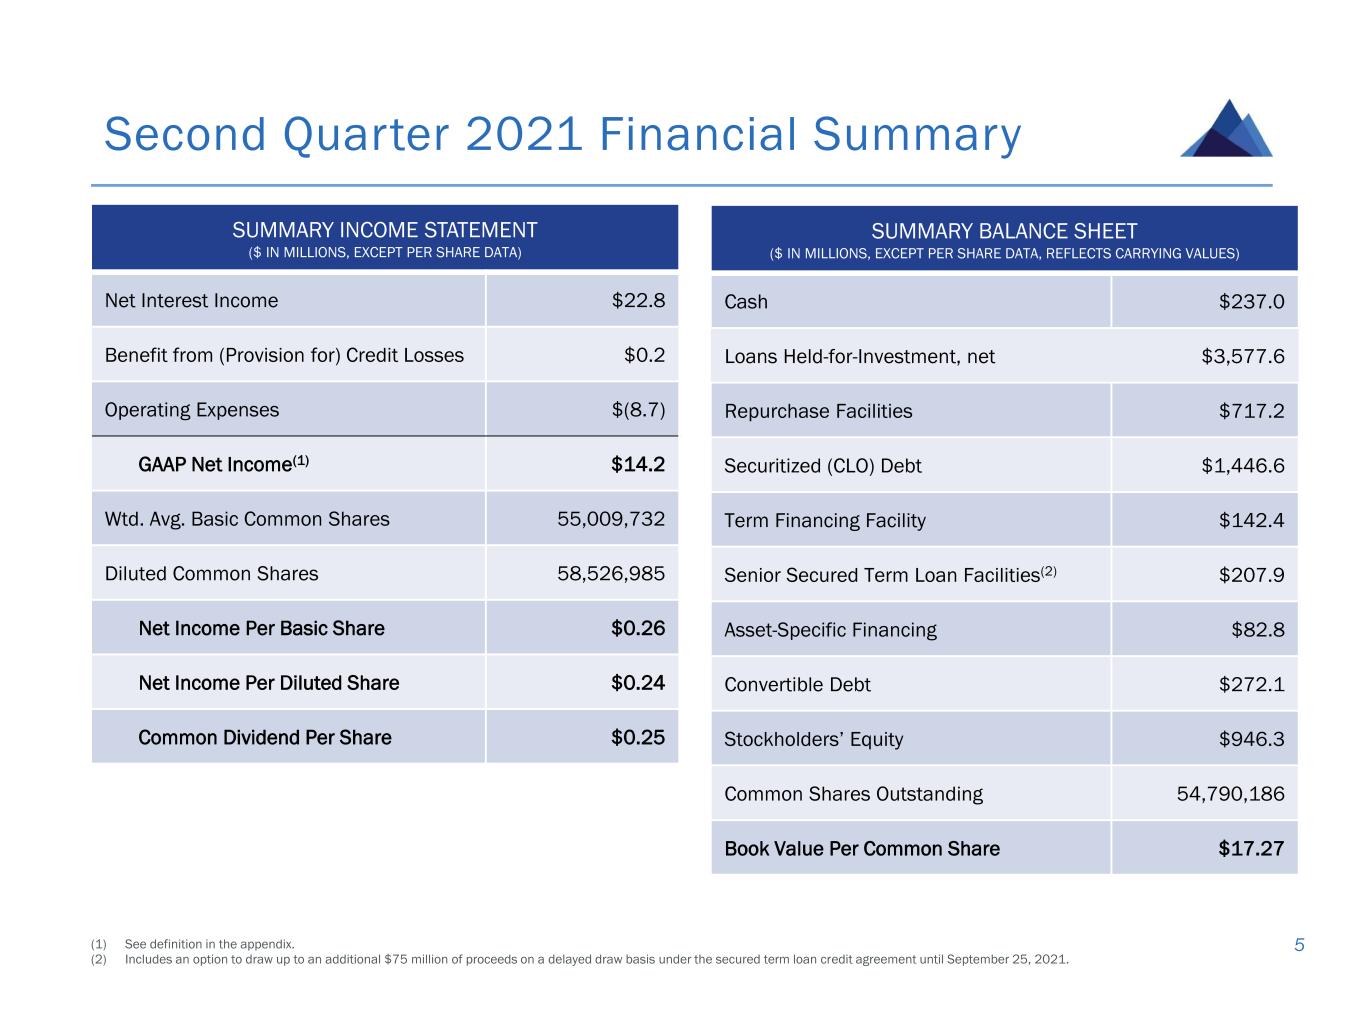
Second Quarter 2021 Financial Summary 5 SUMMARY INCOME STATEMENT ($ IN MILLIONS, EXCEPT PER SHARE DATA) Net Interest Income $22.8 Benefit from (Provision for) Credit Losses $0.2 Operating Expenses $(8.7) GAAP Net Income(1) $14.2 Wtd. Avg. Basic Common Shares 55,009,732 Diluted Common Shares 58,526,985 Net Income Per Basic Share $0.26 Net Income Per Diluted Share $0.24 Common Dividend Per Share $0.25 (1) See definition in the appendix. (2) Includes an option to draw up to an additional $75 million of proceeds on a delayed draw basis under the secured term loan credit agreement until September 25, 2021. SUMMARY BALANCE SHEET ($ IN MILLIONS, EXCEPT PER SHARE DATA, REFLECTS CARRYING VALUES) Cash $237.0 Loans Held-for-Investment, net $3,577.6 Repurchase Facilities $717.2 Securitized (CLO) Debt $1,446.6 Term Financing Facility $142.4 Senior Secured Term Loan Facilities(2) $207.9 Asset-Specific Financing $82.8 Convertible Debt $272.1 Stockholders’ Equity $946.3 Common Shares Outstanding 54,790,186 Book Value Per Common Share $17.27
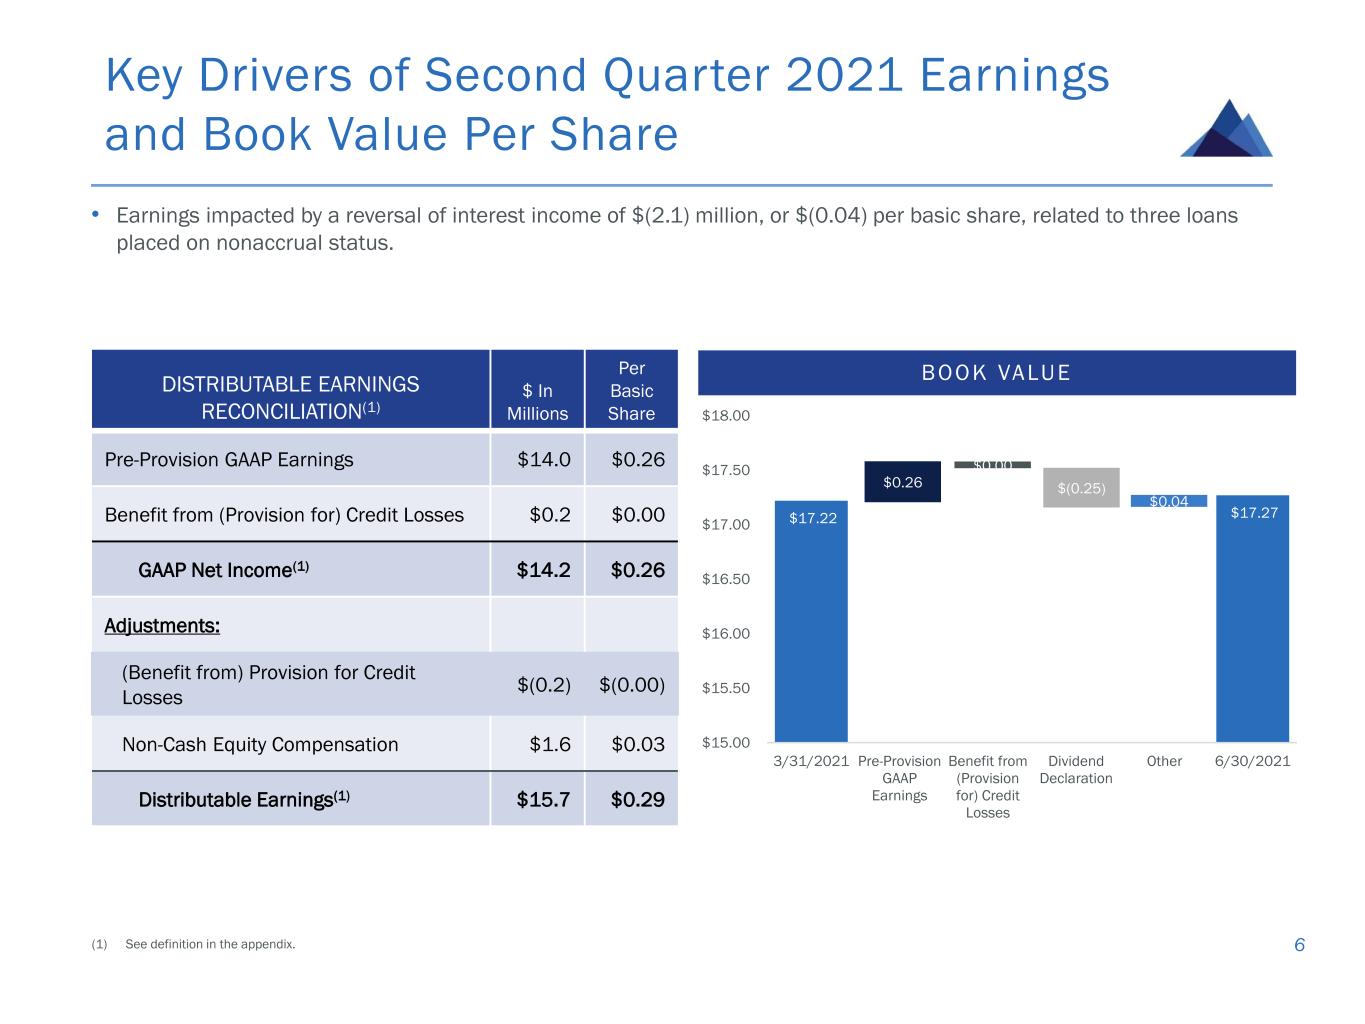
$17.22 $17.27 $15.00 $15.50 $16.00 $16.50 $17.00 $17.50 $18.00 3/31/2021 Pre-Provision GAAP Earnings Benefit from (Provision for) Credit Losses Dividend Declaration Other 6/30/2021 $(0.25)$0.26 Key Drivers of Second Quarter 2021 Earnings and Book Value Per Share • Earnings impacted by a reversal of interest income of $(2.1) million, or $(0.04) per basic share, related to three loans placed on nonaccrual status. 6 BOOK VALUE $0.00 DISTRIBUTABLE EARNINGS RECONCILIATION(1) $ In Millions Per Basic Share Pre-Provision GAAP Earnings $14.0 $0.26 Benefit from (Provision for) Credit Losses $0.2 $0.00 GAAP Net Income(1) $14.2 $0.26 Adjustments: (Benefit from) Provision for Credit Losses $(0.2) $(0.00) Non-Cash Equity Compensation $1.6 $0.03 Distributable Earnings(1) $15.7 $0.29 (1) See definition in the appendix. $0.04
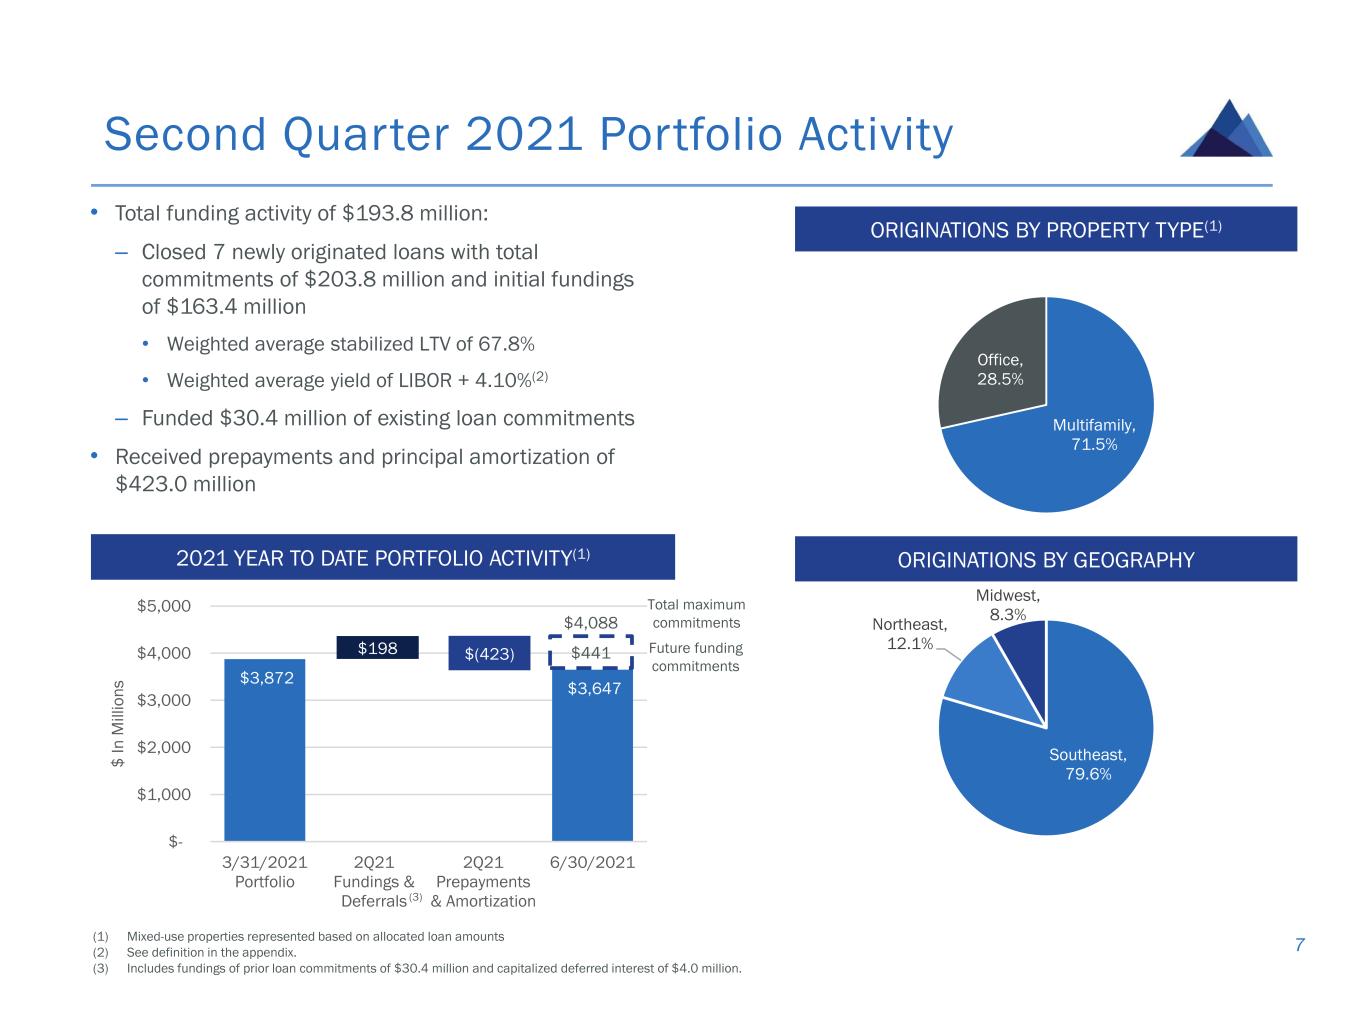
$3,872 $3,647 $- $1,000 $2,000 $3,000 $4,000 $5,000 3/31/2021 Portfolio 2Q21 Fundings & Deferrals 2Q21 Prepayments & Amortization 6/30/2021 $ I n M il li o n s Second Quarter 2021 Portfolio Activity 7 (1) Mixed-use properties represented based on allocated loan amounts (2) See definition in the appendix. (3) Includes fundings of prior loan commitments of $30.4 million and capitalized deferred interest of $4.0 million. 2021 YEAR TO DATE PORTFOLIO ACTIVITY(1) ORIGINATIONS BY PROPERTY TYPE(1) $198 $(423) $4,088 $441 Total maximum commitments Future funding commitments ORIGINATIONS BY GEOGRAPHY • Total funding activity of $193.8 million: – Closed 7 newly originated loans with total commitments of $203.8 million and initial fundings of $163.4 million • Weighted average stabilized LTV of 67.8% • Weighted average yield of LIBOR + 4.10%(2) – Funded $30.4 million of existing loan commitments • Received prepayments and principal amortization of $423.0 million Multifamily, 71.5% Office, 28.5% Southeast, 79.6% Northeast, 12.1% Midwest, 8.3% (3)
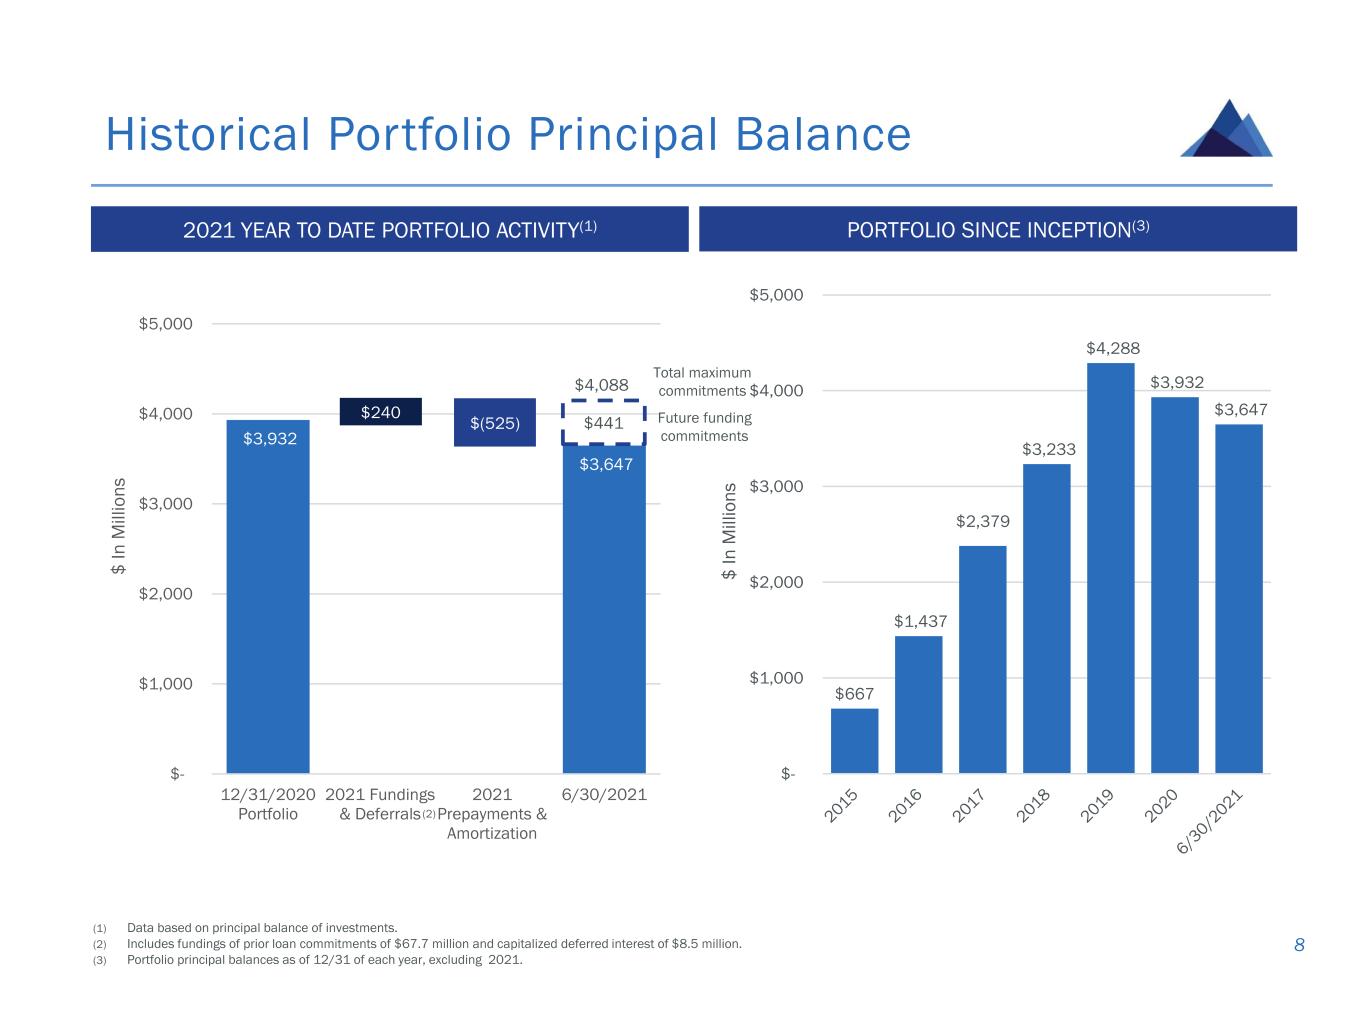
$3,932 $3,647 $- $1,000 $2,000 $3,000 $4,000 $5,000 12/31/2020 Portfolio 2021 Fundings & Deferrals 2021 Prepayments & Amortization 6/30/2021 $ I n M il li o n s Historical Portfolio Principal Balance 8 (1) Data based on principal balance of investments. (2) Includes fundings of prior loan commitments of $67.7 million and capitalized deferred interest of $8.5 million. (3) Portfolio principal balances as of 12/31 of each year, excluding 2021. 2021 YEAR TO DATE PORTFOLIO ACTIVITY(1) PORTFOLIO SINCE INCEPTION(3) $667 $1,437 $2,379 $3,233 $4,288 $3,932 $3,647 $- $1,000 $2,000 $3,000 $4,000 $5,000 $ I n M il li o n s $240 $(525) $4,088 $441 Total maximum commitments Future funding commitments (2)
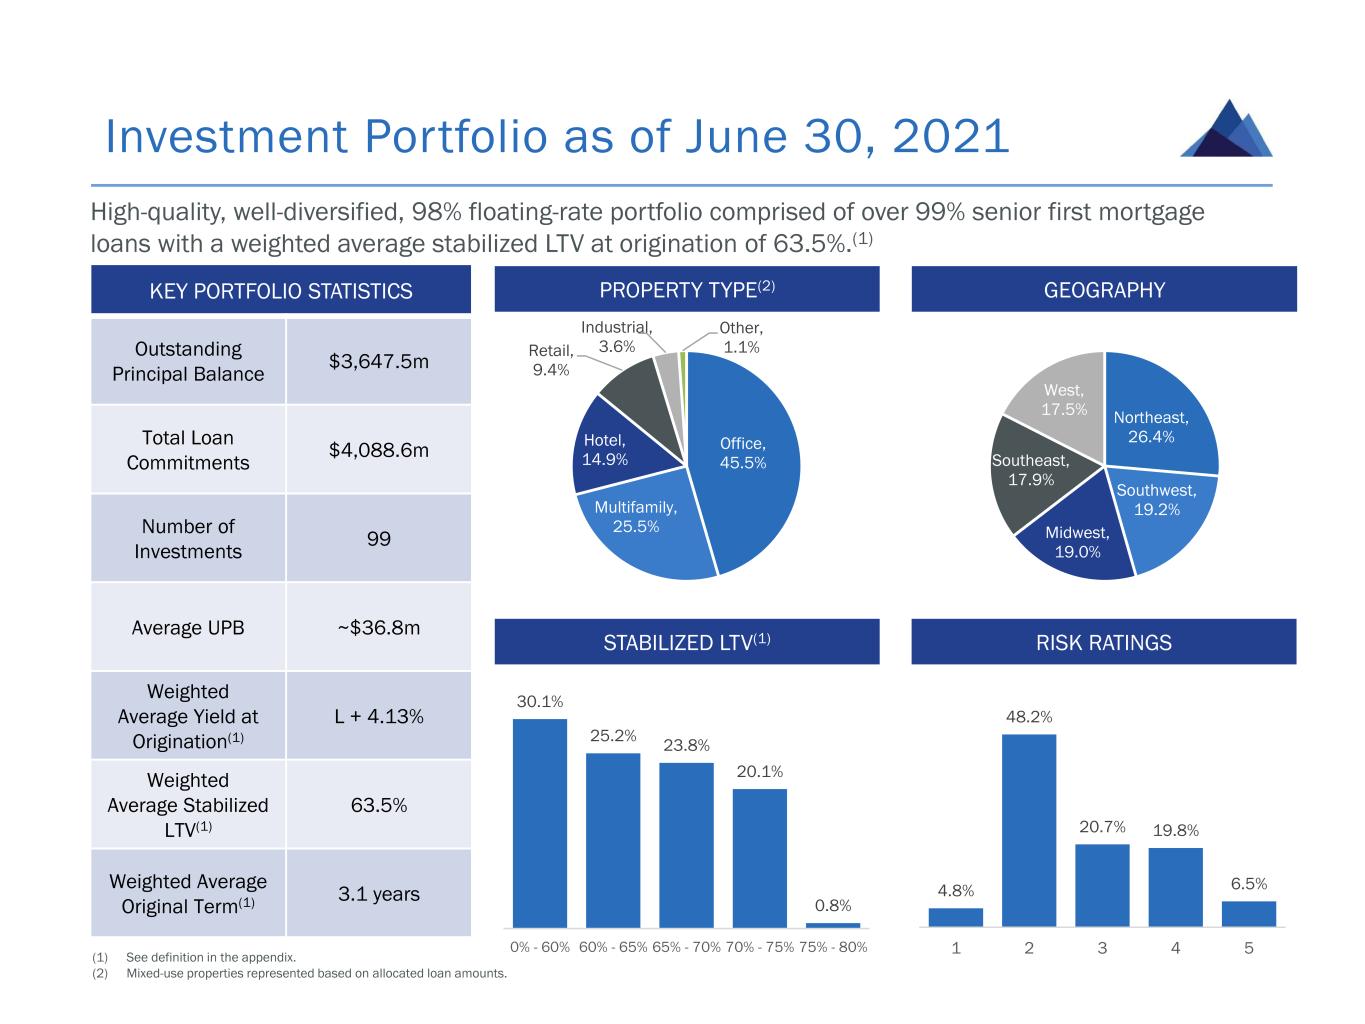
Investment Portfolio as of June 30, 2021 9 PROPERTY TYPE(2) GEOGRAPHY STABILIZED LTV(1) RISK RATINGS (1) See definition in the appendix. (2) Mixed-use properties represented based on allocated loan amounts. KEY PORTFOLIO STATISTICS Outstanding Principal Balance $3,647.5m Total Loan Commitments $4,088.6m Number of Investments 99 Average UPB ~$36.8m Weighted Average Yield at Origination(1) L + 4.13% Weighted Average Stabilized LTV(1) 63.5% Weighted Average Original Term(1) 3.1 years High-quality, well-diversified, 98% floating-rate portfolio comprised of over 99% senior first mortgage loans with a weighted average stabilized LTV at origination of 63.5%.(1) 30.1% 25.2% 23.8% 20.1% 0.8% 0% - 60% 60% - 65% 65% - 70% 70% - 75% 75% - 80% Office, 45.5% Multifamily, 25.5% Hotel, 14.9% Retail, 9.4% Industrial, 3.6% Other, 1.1% Northeast, 26.4% Southwest, 19.2% Midwest, 19.0% Southeast, 17.9% West, 17.5% 4.8% 48.2% 20.7% 19.8% 6.5% 1 2 3 4 5
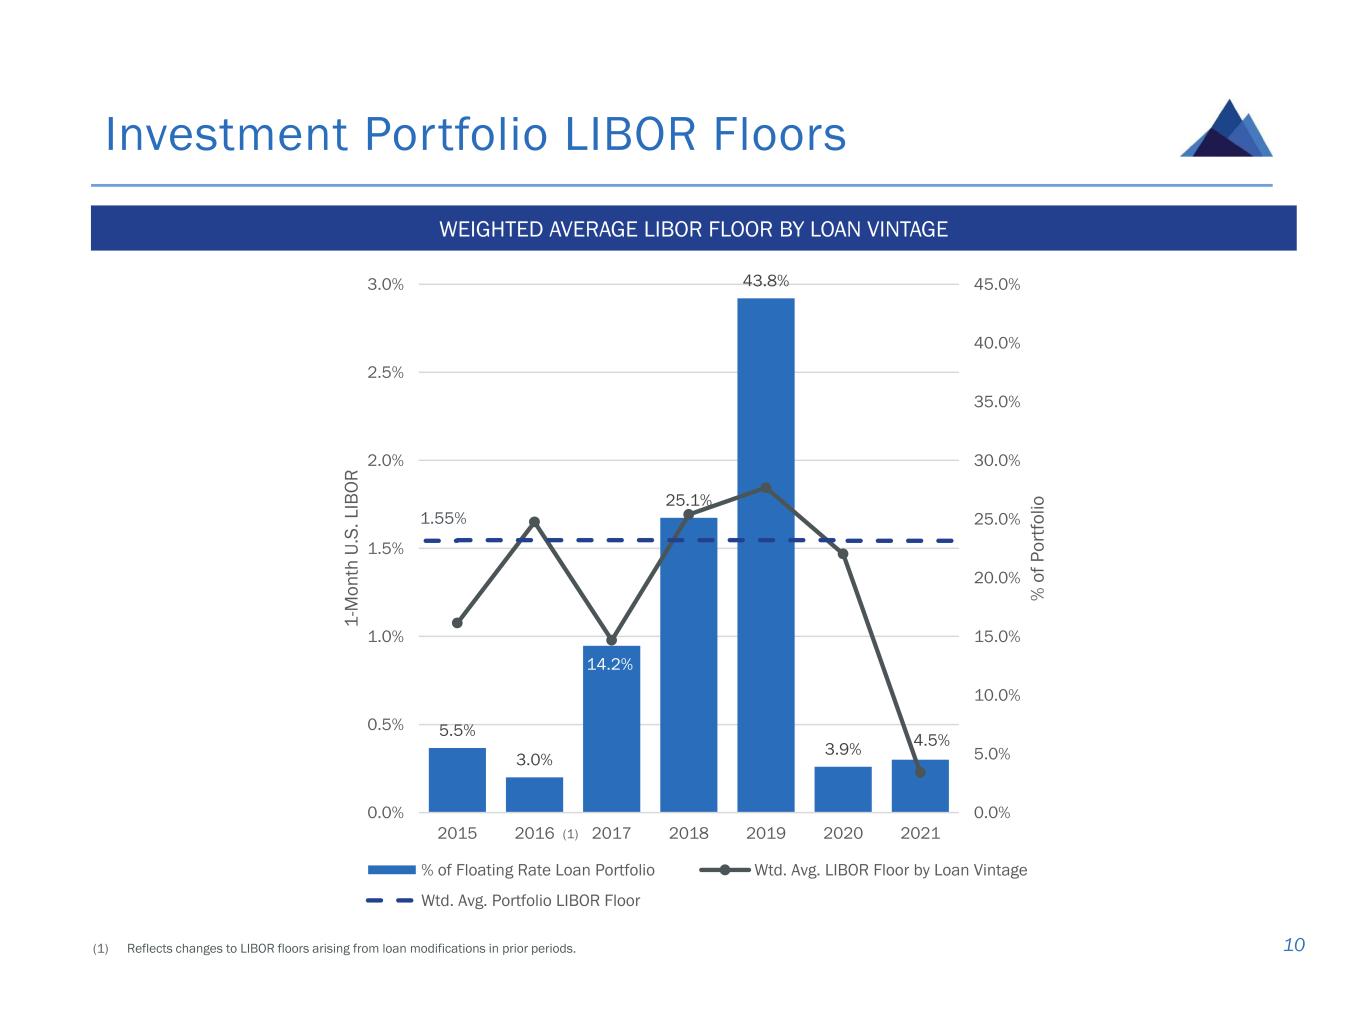
5.5% 3.0% 14.2% 25.1% 43.8% 3.9% 4.5% 0.0% 5.0% 10.0% 15.0% 20.0% 25.0% 30.0% 35.0% 40.0% 45.0% 0.0% 0.5% 1.0% 1.5% 2.0% 2.5% 3.0% 2015 2016 2017 2018 2019 2020 2021 % o f P o rt fo li o 1 -M o n th U .S . L IB O R % of Floating Rate Loan Portfolio Wtd. Avg. LIBOR Floor by Loan Vintage Wtd. Avg. Portfolio LIBOR Floor Investment Portfolio LIBOR Floors 10 WEIGHTED AVERAGE LIBOR FLOOR BY LOAN VINTAGE (1) Reflects changes to LIBOR floors arising from loan modifications in prior periods. (1) 1.55%
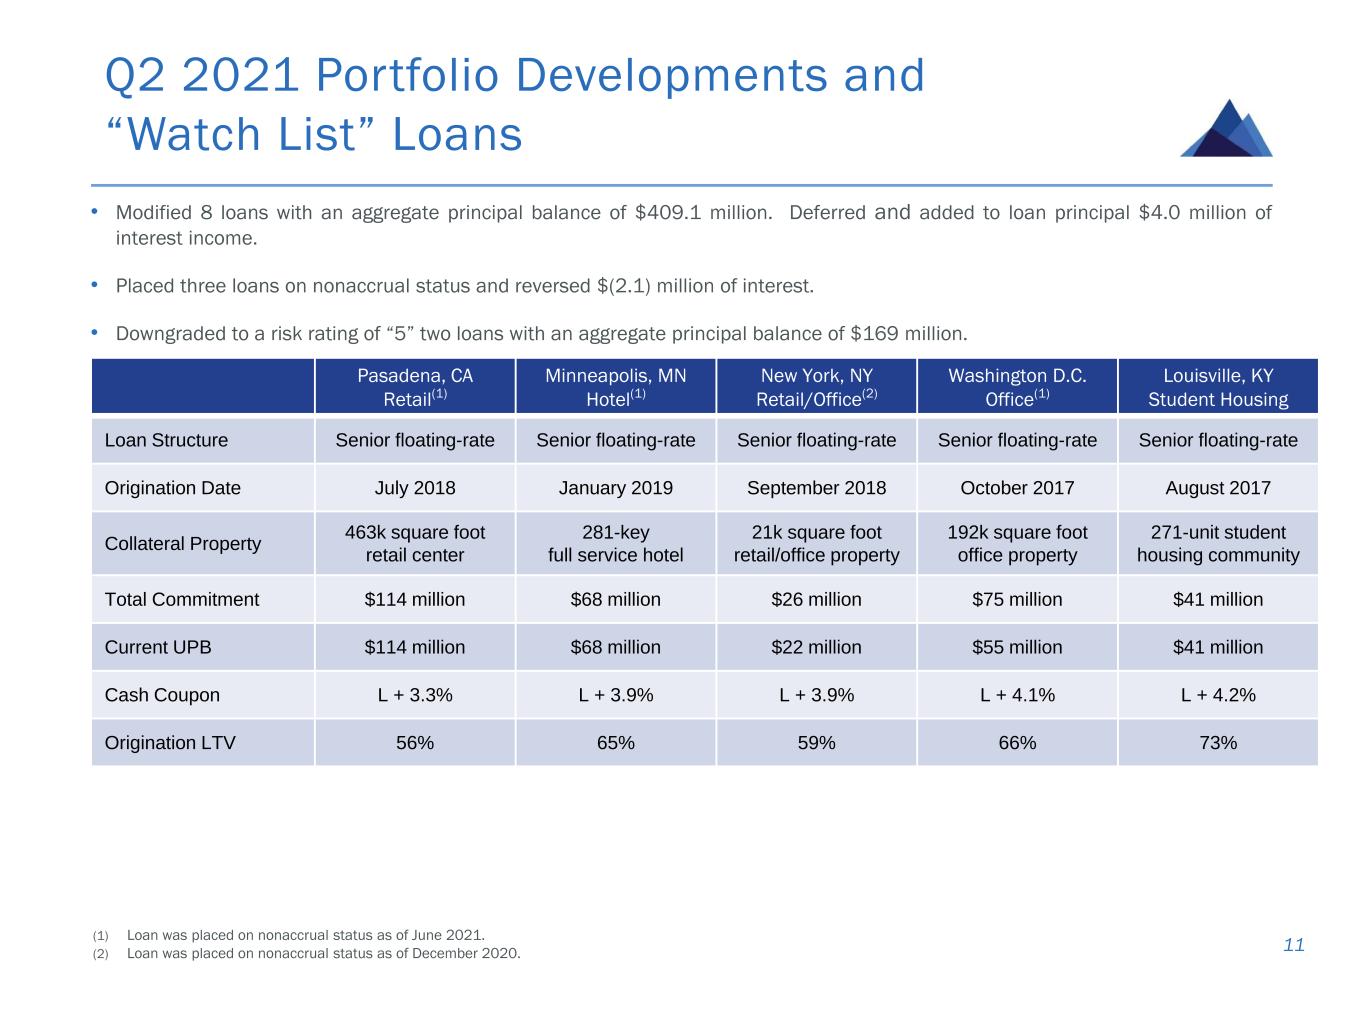
Q2 2021 Portfolio Developments and “Watch List” Loans 11 Pasadena, CA Retail(1) Minneapolis, MN Hotel(1) New York, NY Retail/Office(2) Washington D.C. Office(1) Louisville, KY Student Housing Loan Structure Senior floating-rate Senior floating-rate Senior floating-rate Senior floating-rate Senior floating-rate Origination Date July 2018 January 2019 September 2018 October 2017 August 2017 Collateral Property 463k square foot retail center 281-key full service hotel 21k square foot retail/office property 192k square foot office property 271-unit student housing community Total Commitment $114 million $68 million $26 million $75 million $41 million Current UPB $114 million $68 million $22 million $55 million $41 million Cash Coupon L + 3.3% L + 3.9% L + 3.9% L + 4.1% L + 4.2% Origination LTV 56% 65% 59% 66% 73% (1) Loan was placed on nonaccrual status as of June 2021. (2) Loan was placed on nonaccrual status as of December 2020. • Modified 8 loans with an aggregate principal balance of $409.1 million. Deferred and added to loan principal $4.0 million of interest income. • Placed three loans on nonaccrual status and reversed $(2.1) million of interest. • Downgraded to a risk rating of “5” two loans with an aggregate principal balance of $169 million.
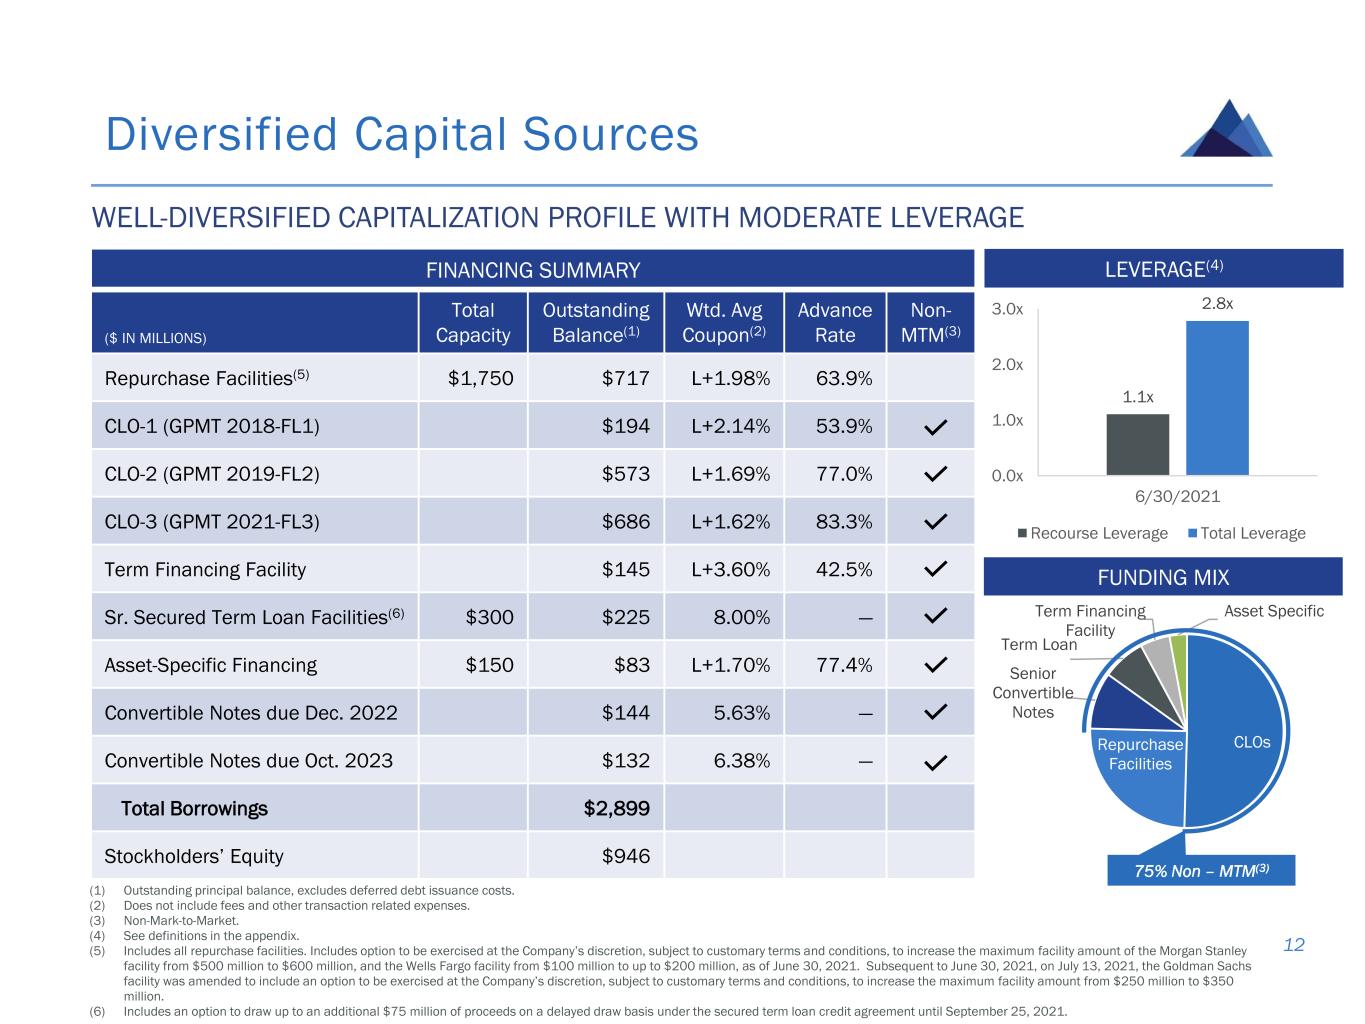
CLOsRepurchase Facilities Senior Convertible Notes Term Loan Term Financing Facility Asset Specific Diversified Capital Sources 12 (1) Outstanding principal balance, excludes deferred debt issuance costs. (2) Does not include fees and other transaction related expenses. (3) Non-Mark-to-Market. (4) See definitions in the appendix. (5) Includes all repurchase facilities. Includes option to be exercised at the Company’s discretion, subject to customary terms and conditions, to increase the maximum facility amount of the Morgan Stanley facility from $500 million to $600 million, and the Wells Fargo facility from $100 million to up to $200 million, as of June 30, 2021. Subsequent to June 30, 2021, on July 13, 2021, the Goldman Sachs facility was amended to include an option to be exercised at the Company’s discretion, subject to customary terms and conditions, to increase the maximum facility amount from $250 million to $350 million. (6) Includes an option to draw up to an additional $75 million of proceeds on a delayed draw basis under the secured term loan credit agreement until September 25, 2021. FINANCING SUMMARY ($ IN MILLIONS) Total Capacity Outstanding Balance(1) Wtd. Avg Coupon(2) Advance Rate Non- MTM(3) Repurchase Facilities(5) $1,750 $717 L+1.98% 63.9% CLO-1 (GPMT 2018-FL1) $194 L+2.14% 53.9% CLO-2 (GPMT 2019-FL2) $573 L+1.69% 77.0% CLO-3 (GPMT 2021-FL3) $686 L+1.62% 83.3% Term Financing Facility $145 L+3.60% 42.5% Sr. Secured Term Loan Facilities(6) $300 $225 8.00% — Asset-Specific Financing $150 $83 L+1.70% 77.4% Convertible Notes due Dec. 2022 $144 5.63% — Convertible Notes due Oct. 2023 $132 6.38% — Total Borrowings $2,899 Stockholders’ Equity $946 FUNDING MIX WELL-DIVERSIFIED CAPITALIZATION PROFILE WITH MODERATE LEVERAGE LEVERAGE(4) 1.1x 2.8x 0.0x 1.0x 2.0x 3.0x 6/30/2021 Recourse Leverage Total Leverage 75% Non – MTM(3)

Appendix
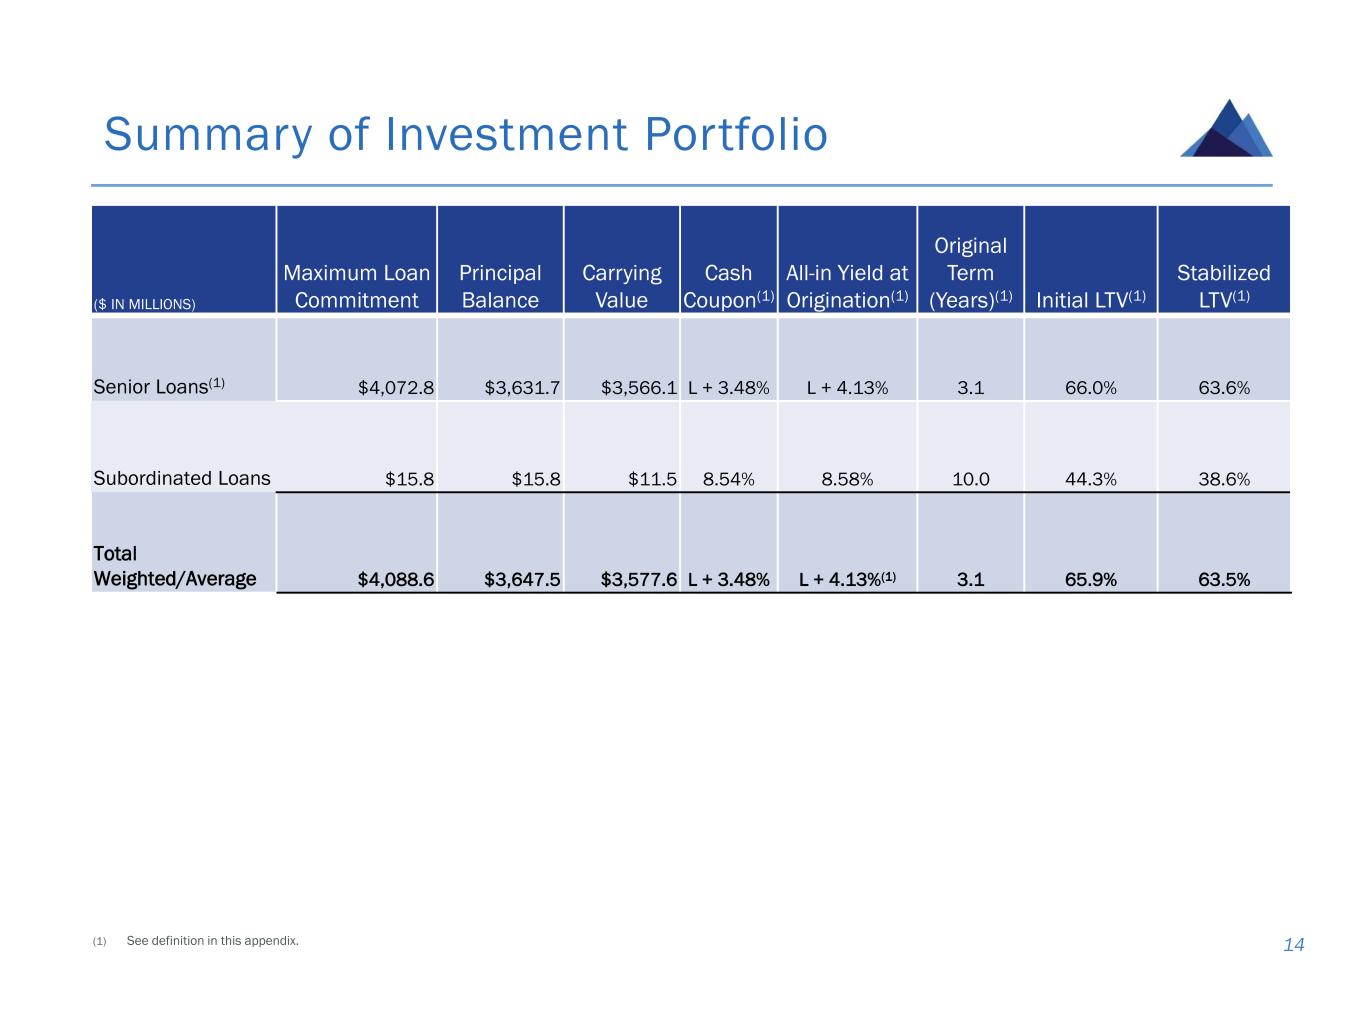
Summary of Investment Portfolio 14 ($ IN MILLIONS) Maximum Loan Commitment Principal Balance Carrying Value Cash Coupon(1) All-in Yield at Origination(1) Original Term (Years)(1) Initial LTV(1) Stabilized LTV(1) Senior Loans(1) $4,072.8 $3,631.7 $3,566.1 L + 3.48% L + 4.13% 3.1 66.0% 63.6% Subordinated Loans $15.8 $15.8 $11.5 8.54% 8.58% 10.0 44.3% 38.6% Total Weighted/Average $4,088.6 $3,647.5 $3,577.6 L + 3.48% L + 4.13%(1) 3.1 65.9% 63.5% (1) See definition in this appendix.
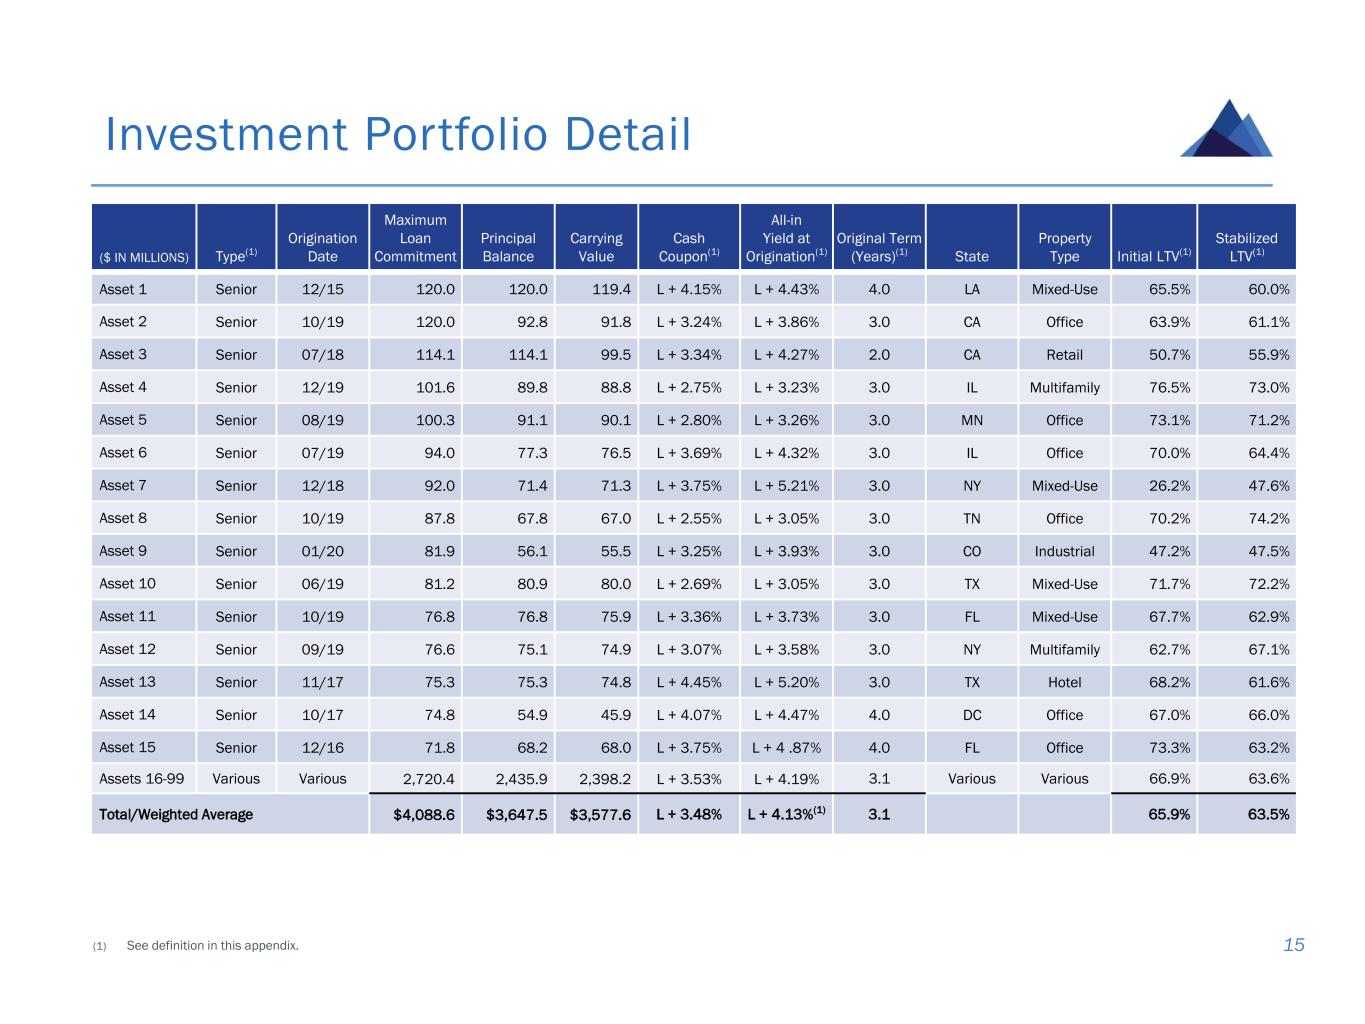
Investment Portfolio Detail 15 ($ IN MILLIONS) Type(1) Origination Date Maximum Loan Commitment Principal Balance Carrying Value Cash Coupon(1) All-in Yield at Origination(1) Original Term (Years)(1) State Property Type Initial LTV(1) Stabilized LTV(1) Asset 1 Senior 12/15 120.0 120.0 119.4 L + 4.15% L + 4.43% 4.0 LA Mixed-Use 65.5% 60.0% Asset 2 Senior 10/19 120.0 92.8 91.8 L + 3.24% L + 3.86% 3.0 CA Office 63.9% 61.1% Asset 3 Senior 07/18 114.1 114.1 99.5 L + 3.34% L + 4.27% 2.0 CA Retail 50.7% 55.9% Asset 4 Senior 12/19 101.6 89.8 88.8 L + 2.75% L + 3.23% 3.0 IL Multifamily 76.5% 73.0% Asset 5 Senior 08/19 100.3 91.1 90.1 L + 2.80% L + 3.26% 3.0 MN Office 73.1% 71.2% Asset 6 Senior 07/19 94.0 77.3 76.5 L + 3.69% L + 4.32% 3.0 IL Office 70.0% 64.4% Asset 7 Senior 12/18 92.0 71.4 71.3 L + 3.75% L + 5.21% 3.0 NY Mixed-Use 26.2% 47.6% Asset 8 Senior 10/19 87.8 67.8 67.0 L + 2.55% L + 3.05% 3.0 TN Office 70.2% 74.2% Asset 9 Senior 01/20 81.9 56.1 55.5 L + 3.25% L + 3.93% 3.0 CO Industrial 47.2% 47.5% Asset 10 Senior 06/19 81.2 80.9 80.0 L + 2.69% L + 3.05% 3.0 TX Mixed-Use 71.7% 72.2% Asset 11 Senior 10/19 76.8 76.8 75.9 L + 3.36% L + 3.73% 3.0 FL Mixed-Use 67.7% 62.9% Asset 12 Senior 09/19 76.6 75.1 74.9 L + 3.07% L + 3.58% 3.0 NY Multifamily 62.7% 67.1% Asset 13 Senior 11/17 75.3 75.3 74.8 L + 4.45% L + 5.20% 3.0 TX Hotel 68.2% 61.6% Asset 14 Senior 10/17 74.8 54.9 45.9 L + 4.07% L + 4.47% 4.0 DC Office 67.0% 66.0% Asset 15 Senior 12/16 71.8 68.2 68.0 L + 3.75% L + 4 .87% 4.0 FL Office 73.3% 63.2% Assets 16-99 Various Various 2,720.4 2,435.9 2,398.2 L + 3.53% L + 4.19% 3.1 Various Various 66.9% 63.6% Total/Weighted Average $4,088.6 $3,647.5 $3,577.6 L + 3.48% L + 4.13%(1) 3.1 65.9% 63.5% (1) See definition in this appendix.
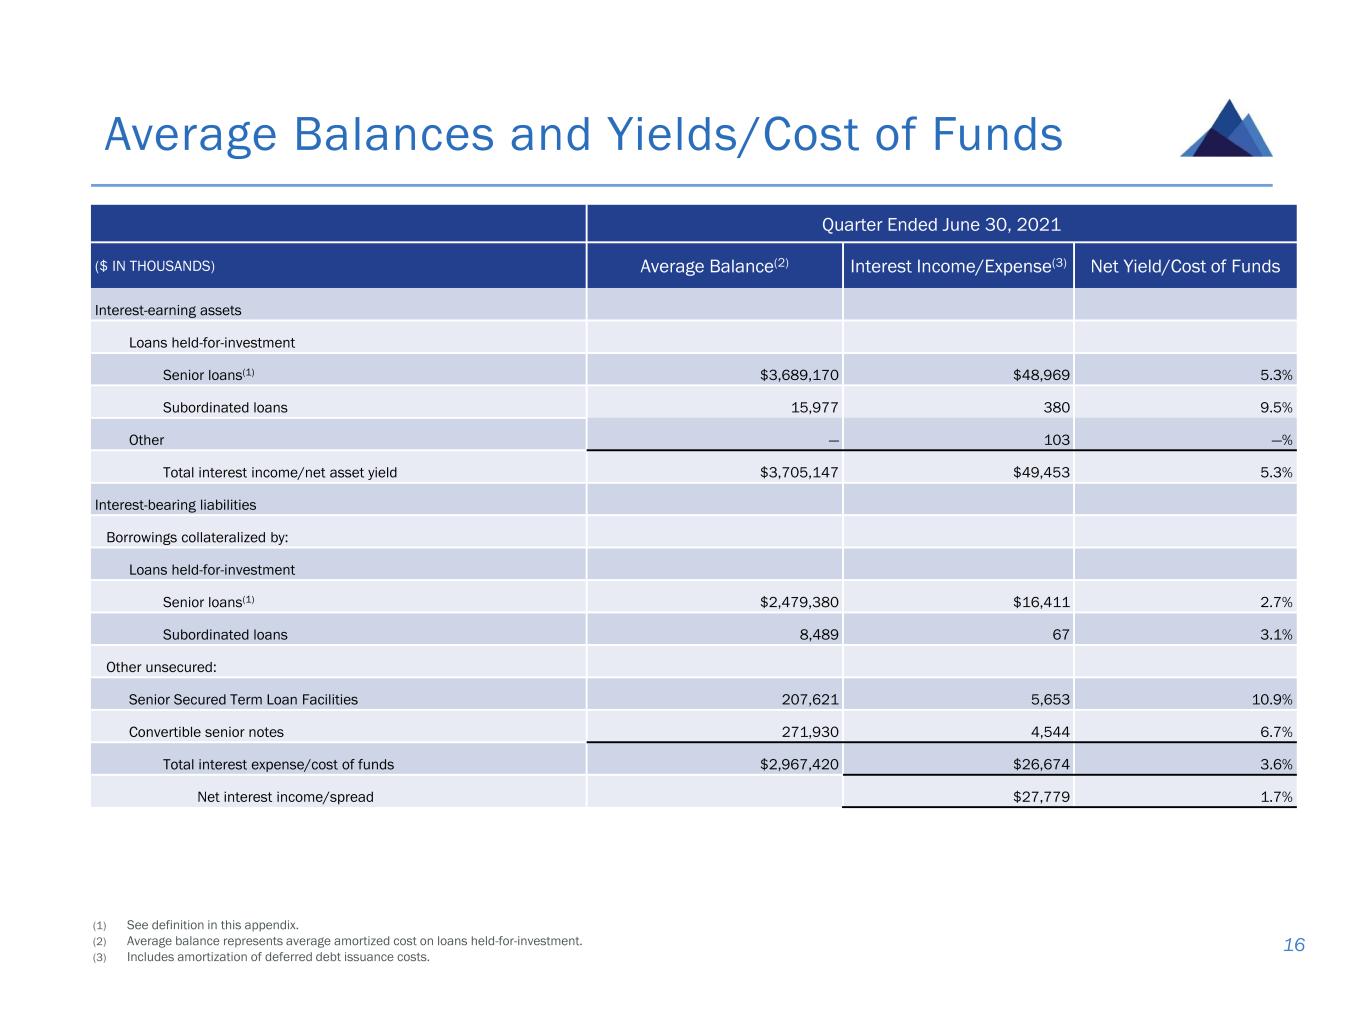
Average Balances and Yields/Cost of Funds 16 Quarter Ended June 30, 2021 ($ IN THOUSANDS) Average Balance(2) Interest Income/Expense(3) Net Yield/Cost of Funds Interest-earning assets Loans held-for-investment Senior loans(1) $3,689,170 $48,969 5.3% Subordinated loans 15,977 380 9.5% Other — 103 —% Total interest income/net asset yield $3,705,147 $49,453 5.3% Interest-bearing liabilities Borrowings collateralized by: Loans held-for-investment Senior loans(1) $2,479,380 $16,411 2.7% Subordinated loans 8,489 67 3.1% Other unsecured: Senior Secured Term Loan Facilities 207,621 5,653 10.9% Convertible senior notes 271,930 4,544 6.7% Total interest expense/cost of funds $2,967,420 $26,674 3.6% Net interest income/spread $27,779 1.7% (1) See definition in this appendix. (2) Average balance represents average amortized cost on loans held-for-investment. (3) Includes amortization of deferred debt issuance costs.
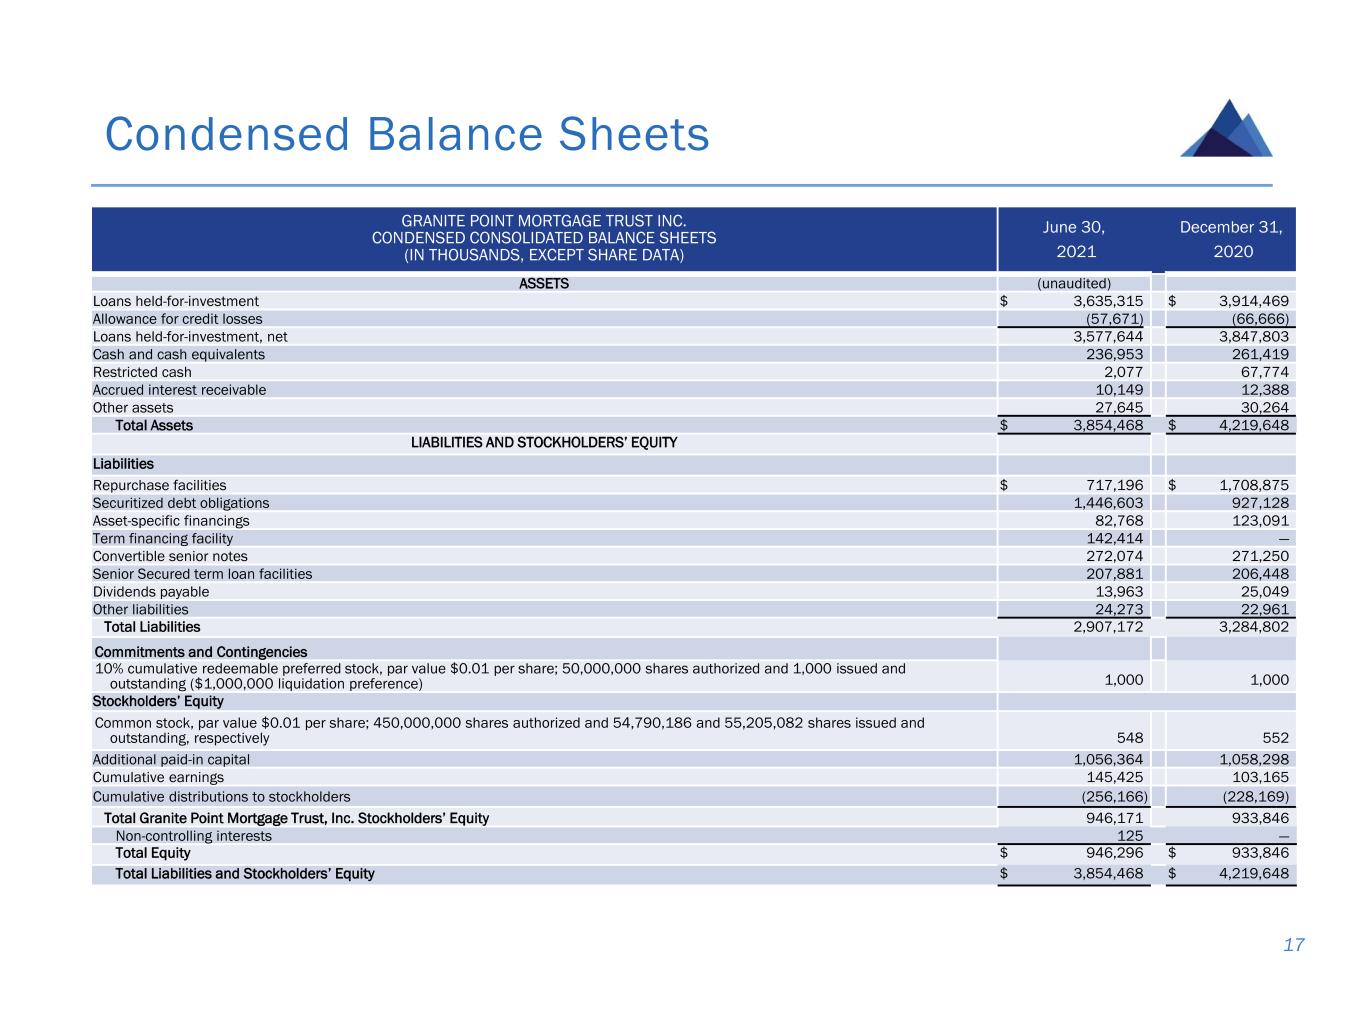
Condensed Balance Sheets 17 GRANITE POINT MORTGAGE TRUST INC. CONDENSED CONSOLIDATED BALANCE SHEETS (IN THOUSANDS, EXCEPT SHARE DATA) June 30, 2021 December 31, 2020 ASSETS (unaudited) Loans held-for-investment $ 3,635,315 $ 3,914,469 Allowance for credit losses (57,671) (66,666) Loans held-for-investment, net 3,577,644 3,847,803 Cash and cash equivalents 236,953 261,419 Restricted cash 2,077 67,774 Accrued interest receivable 10,149 12,388 Other assets 27,645 30,264 Total Assets $ 3,854,468 $ 4,219,648 LIABILITIES AND STOCKHOLDERS’ EQUITY Liabilities Repurchase facilities $ 717,196 $ 1,708,875 Securitized debt obligations 1,446,603 927,128 Asset-specific financings 82,768 123,091 Term financing facility 142,414 — Convertible senior notes 272,074 271,250 Senior Secured term loan facilities 207,881 206,448 Dividends payable 13,963 25,049 Other liabilities 24,273 22,961 Total Liabilities 2,907,172 3,284,802 Commitments and Contingencies 10% cumulative redeemable preferred stock, par value $0.01 per share; 50,000,000 shares authorized and 1,000 issued and outstanding ($1,000,000 liquidation preference) 1,000 1,000 Stockholders’ Equity Common stock, par value $0.01 per share; 450,000,000 shares authorized and 54,790,186 and 55,205,082 shares issued and outstanding, respectively 548 552 Additional paid-in capital 1,056,364 1,058,298 Cumulative earnings 145,425 103,165 Cumulative distributions to stockholders (256,166) (228,169) Total Granite Point Mortgage Trust, Inc. Stockholders’ Equity 946,171 933,846 Non-controlling interests 125 — Total Equity $ 946,296 $ 933,846 Total Liabilities and Stockholders’ Equity $ 3,854,468 $ 4,219,648
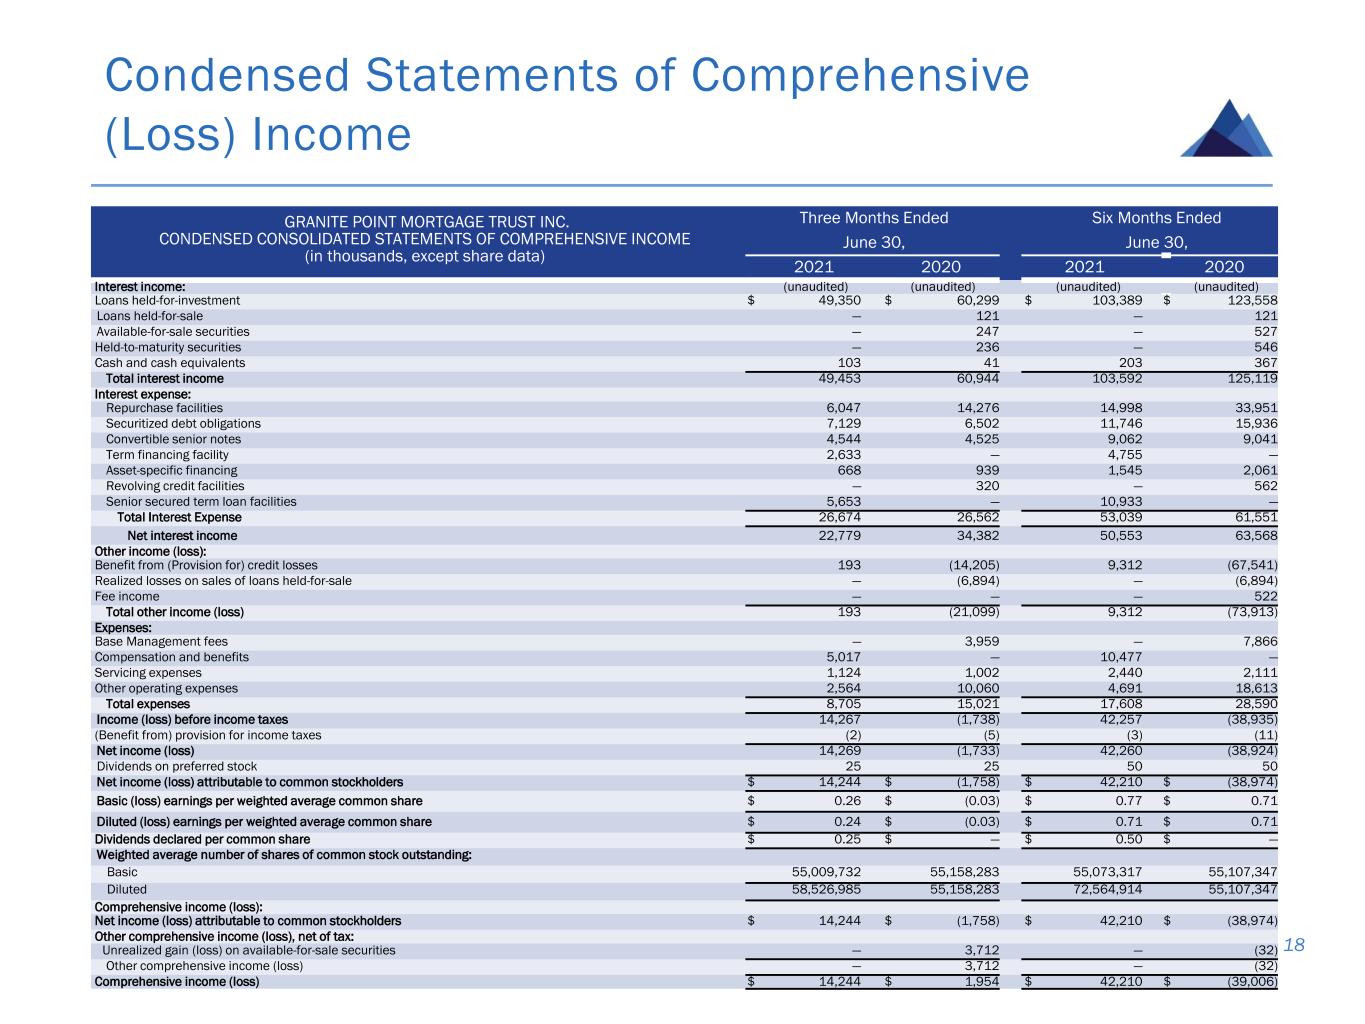
Condensed Statements of Comprehensive (Loss) Income 18 GRANITE POINT MORTGAGE TRUST INC. CONDENSED CONSOLIDATED STATEMENTS OF COMPREHENSIVE INCOME (in thousands, except share data) Three Months Ended June 30, Six Months Ended June 30, 2021 2020 2021 2020 Interest income: (unaudited) (unaudited) (unaudited) (unaudited) Loans held-for-investment $ 49,350 $ 60,299 $ 103,389 $ 123,558 Loans held-for-sale — 121 — 121 Available-for-sale securities — 247 — 527 Held-to-maturity securities — 236 — 546 Cash and cash equivalents 103 41 203 367 Total interest income 49,453 60,944 103,592 125,119 Interest expense: Repurchase facilities 6,047 14,276 14,998 33,951 Securitized debt obligations 7,129 6,502 11,746 15,936 Convertible senior notes 4,544 4,525 9,062 9,041 Term financing facility 2,633 — 4,755 — Asset-specific financing 668 939 1,545 2,061 Revolving credit facilities — 320 — 562 Senior secured term loan facilities 5,653 — 10,933 — Total Interest Expense 26,674 26,562 53,039 61,551 Net interest income 22,779 34,382 50,553 63,568 Other income (loss): Benefit from (Provision for) credit losses 193 (14,205) 9,312 (67,541) Realized losses on sales of loans held-for-sale — (6,894) — (6,894) Fee income — — — 522 Total other income (loss) 193 (21,099) 9,312 (73,913) Expenses: Base Management fees — 3,959 — 7,866 Compensation and benefits 5,017 — 10,477 — Servicing expenses 1,124 1,002 2,440 2,111 Other operating expenses 2,564 10,060 4,691 18,613 Total expenses 8,705 15,021 17,608 28,590 Income (loss) before income taxes 14,267 (1,738) 42,257 (38,935) (Benefit from) provision for income taxes (2) (5) (3) (11) Net income (loss) 14,269 (1,733) 42,260 (38,924) Dividends on preferred stock 25 25 50 50 Net income (loss) attributable to common stockholders $ 14,244 $ (1,758) $ 42,210 $ (38,974) Basic (loss) earnings per weighted average common share $ 0.26 $ (0.03) $ 0.77 $ 0.71 Diluted (loss) earnings per weighted average common share $ 0.24 $ (0.03) $ 0.71 $ 0.71 Dividends declared per common share $ 0.25 $ — $ 0.50 $ — Weighted average number of shares of common stock outstanding: Basic 55,009,732 55,158,283 55,073,317 55,107,347 Diluted 58,526,985 55,158,283 72,564,914 55,107,347 Comprehensive income (loss): Net income (loss) attributable to common stockholders $ 14,244 $ (1,758) $ 42,210 $ (38,974) Other comprehensive income (loss), net of tax: Unrealized gain (loss) on available-for-sale securities — 3,712 — (32) Other comprehensive income (loss) — 3,712 — (32) Comprehensive income (loss) $ 14,244 $ 1,954 $ 42,210 $ (39,006)
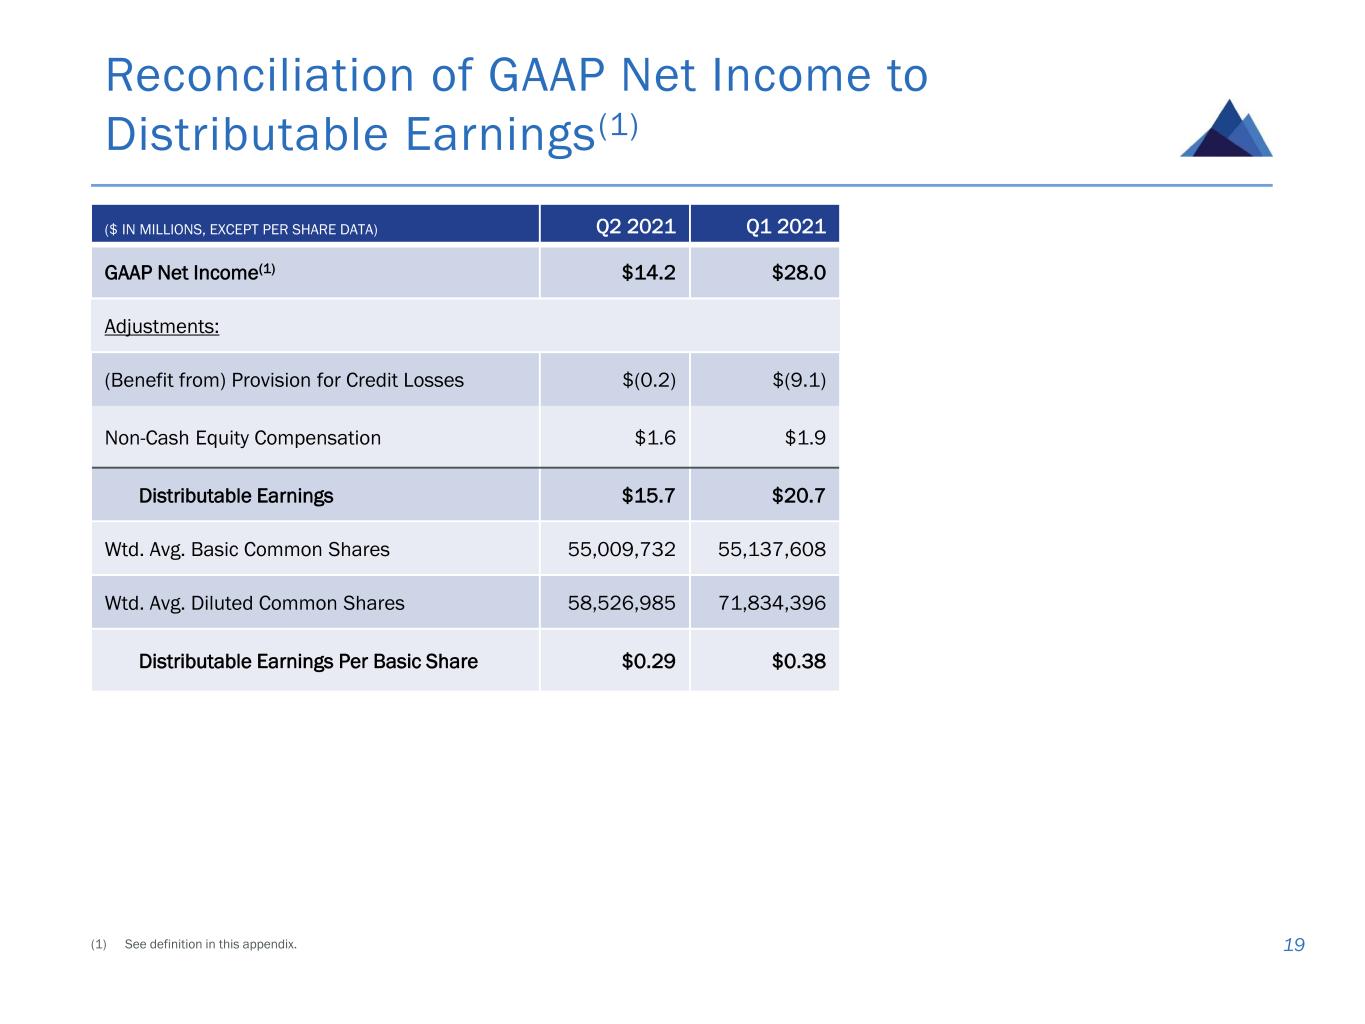
Reconciliation of GAAP Net Income to Distributable Earnings(1) 19 ($ IN MILLIONS, EXCEPT PER SHARE DATA) Q2 2021 Q1 2021 GAAP Net Income(1) $14.2 $28.0 Adjustments: (Benefit from) Provision for Credit Losses $(0.2) $(9.1) Non-Cash Equity Compensation $1.6 $1.9 Distributable Earnings $15.7 $20.7 Wtd. Avg. Basic Common Shares 55,009,732 55,137,608 Wtd. Avg. Diluted Common Shares 58,526,985 71,834,396 Distributable Earnings Per Basic Share $0.29 $0.38 (1) See definition in this appendix.
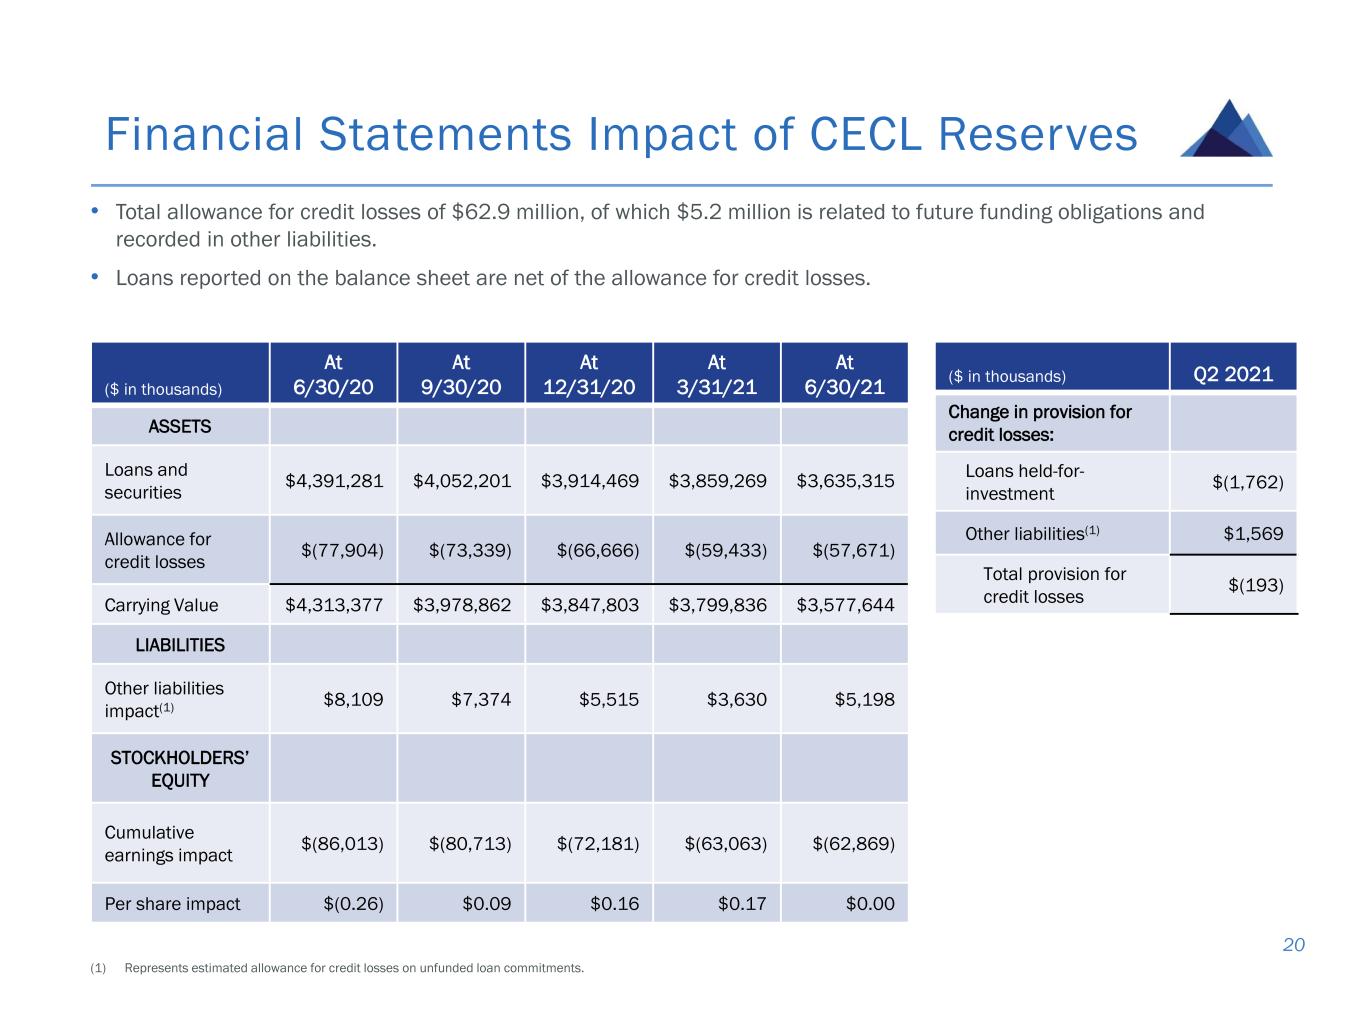
Financial Statements Impact of CECL Reserves 20 • Total allowance for credit losses of $62.9 million, of which $5.2 million is related to future funding obligations and recorded in other liabilities. • Loans reported on the balance sheet are net of the allowance for credit losses. ($ in thousands) At 6/30/20 At 9/30/20 At 12/31/20 At 3/31/21 At 6/30/21 ASSETS Loans and securities $4,391,281 $4,052,201 $3,914,469 $3,859,269 $3,635,315 Allowance for credit losses $(77,904) $(73,339) $(66,666) $(59,433) $(57,671) Carrying Value $4,313,377 $3,978,862 $3,847,803 $3,799,836 $3,577,644 LIABILITIES Other liabilities impact(1) $8,109 $7,374 $5,515 $3,630 $5,198 STOCKHOLDERS’ EQUITY Cumulative earnings impact $(86,013) $(80,713) $(72,181) $(63,063) $(62,869) Per share impact $(0.26) $0.09 $0.16 $0.17 $0.00 ($ in thousands) Q2 2021 Change in provision for credit losses: Loans held-for- investment $(1,762) Other liabilities(1) $1,569 Total provision for credit losses $(193) (1) Represents estimated allowance for credit losses on unfunded loan commitments.
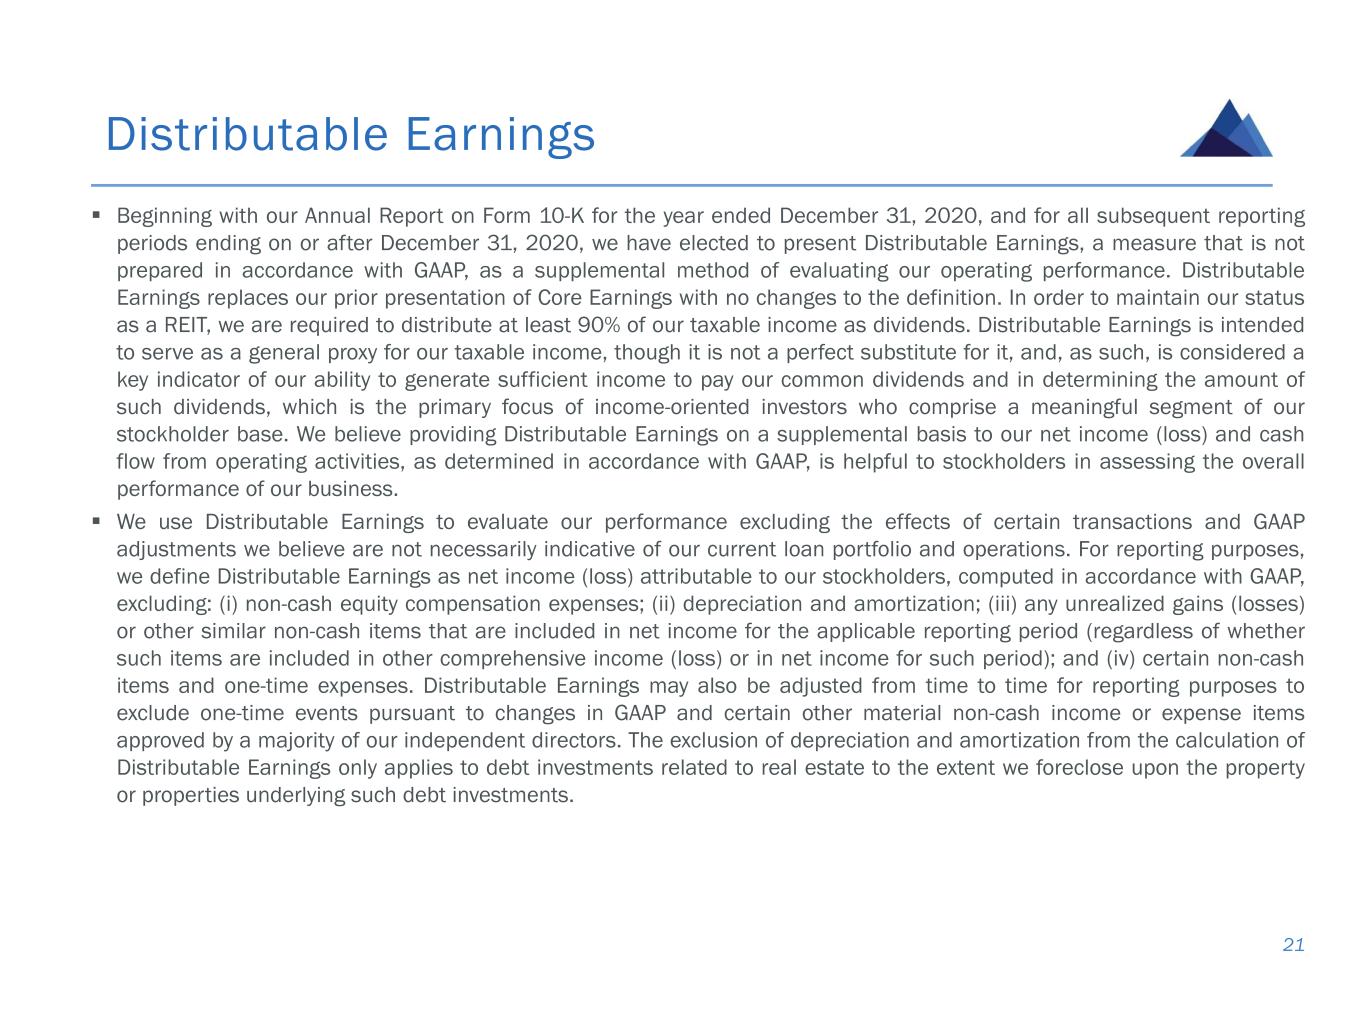
▪ Beginning with our Annual Report on Form 10-K for the year ended December 31, 2020, and for all subsequent reporting periods ending on or after December 31, 2020, we have elected to present Distributable Earnings, a measure that is not prepared in accordance with GAAP, as a supplemental method of evaluating our operating performance. Distributable Earnings replaces our prior presentation of Core Earnings with no changes to the definition. In order to maintain our status as a REIT, we are required to distribute at least 90% of our taxable income as dividends. Distributable Earnings is intended to serve as a general proxy for our taxable income, though it is not a perfect substitute for it, and, as such, is considered a key indicator of our ability to generate sufficient income to pay our common dividends and in determining the amount of such dividends, which is the primary focus of income-oriented investors who comprise a meaningful segment of our stockholder base. We believe providing Distributable Earnings on a supplemental basis to our net income (loss) and cash flow from operating activities, as determined in accordance with GAAP, is helpful to stockholders in assessing the overall performance of our business. ▪ We use Distributable Earnings to evaluate our performance excluding the effects of certain transactions and GAAP adjustments we believe are not necessarily indicative of our current loan portfolio and operations. For reporting purposes, we define Distributable Earnings as net income (loss) attributable to our stockholders, computed in accordance with GAAP, excluding: (i) non-cash equity compensation expenses; (ii) depreciation and amortization; (iii) any unrealized gains (losses) or other similar non-cash items that are included in net income for the applicable reporting period (regardless of whether such items are included in other comprehensive income (loss) or in net income for such period); and (iv) certain non-cash items and one-time expenses. Distributable Earnings may also be adjusted from time to time for reporting purposes to exclude one-time events pursuant to changes in GAAP and certain other material non-cash income or expense items approved by a majority of our independent directors. The exclusion of depreciation and amortization from the calculation of Distributable Earnings only applies to debt investments related to real estate to the extent we foreclose upon the property or properties underlying such debt investments. Distributable Earnings 21
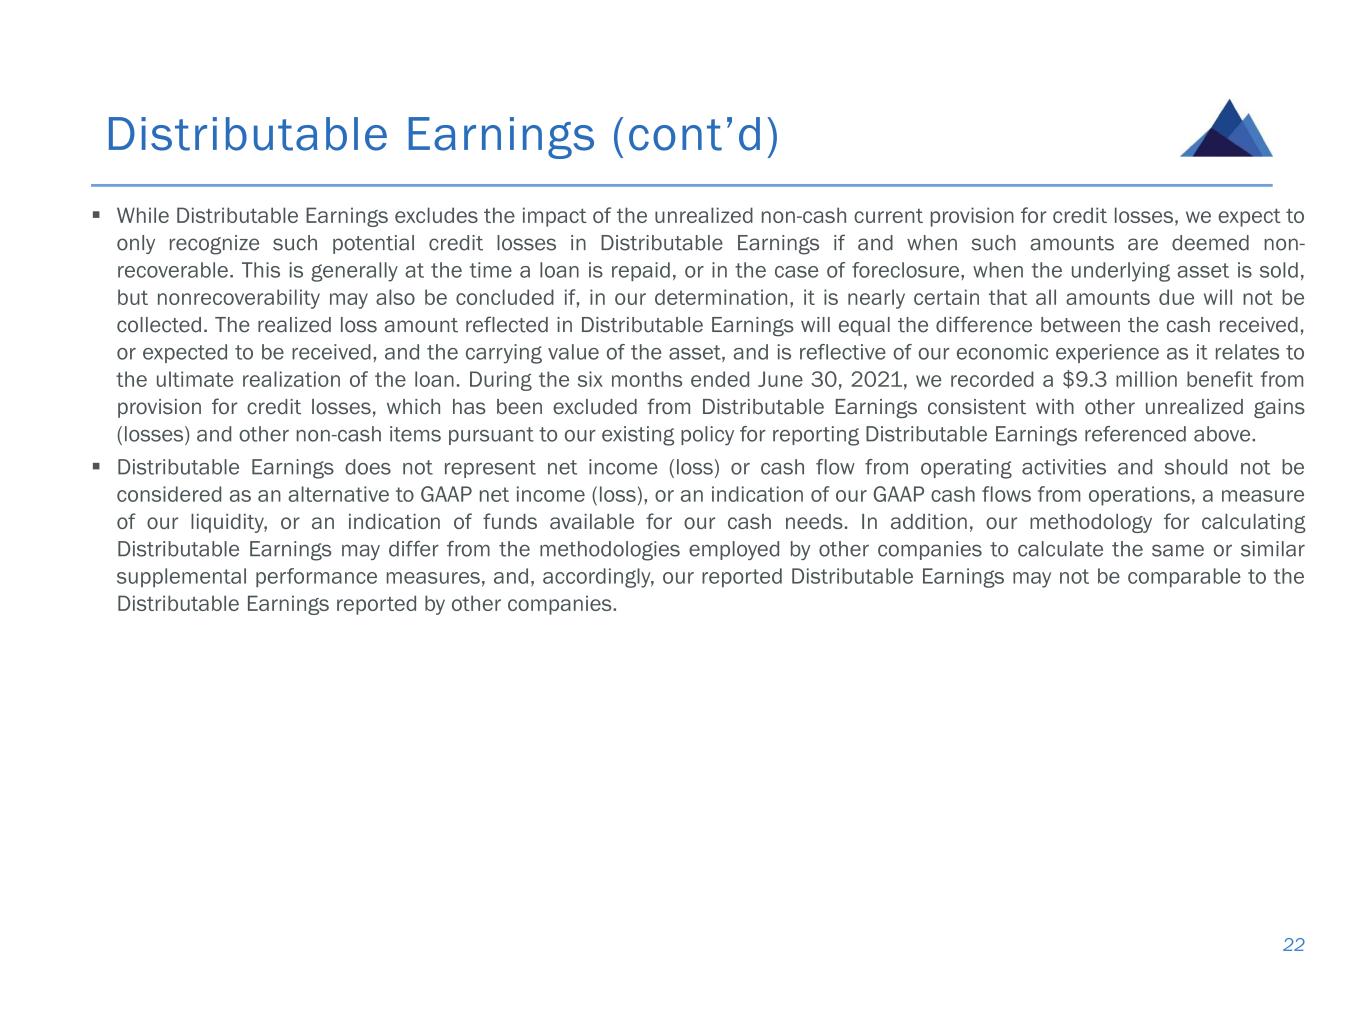
▪ While Distributable Earnings excludes the impact of the unrealized non-cash current provision for credit losses, we expect to only recognize such potential credit losses in Distributable Earnings if and when such amounts are deemed non- recoverable. This is generally at the time a loan is repaid, or in the case of foreclosure, when the underlying asset is sold, but nonrecoverability may also be concluded if, in our determination, it is nearly certain that all amounts due will not be collected. The realized loss amount reflected in Distributable Earnings will equal the difference between the cash received, or expected to be received, and the carrying value of the asset, and is reflective of our economic experience as it relates to the ultimate realization of the loan. During the six months ended June 30, 2021, we recorded a $9.3 million benefit from provision for credit losses, which has been excluded from Distributable Earnings consistent with other unrealized gains (losses) and other non-cash items pursuant to our existing policy for reporting Distributable Earnings referenced above. ▪ Distributable Earnings does not represent net income (loss) or cash flow from operating activities and should not be considered as an alternative to GAAP net income (loss), or an indication of our GAAP cash flows from operations, a measure of our liquidity, or an indication of funds available for our cash needs. In addition, our methodology for calculating Distributable Earnings may differ from the methodologies employed by other companies to calculate the same or similar supplemental performance measures, and, accordingly, our reported Distributable Earnings may not be comparable to the Distributable Earnings reported by other companies. Distributable Earnings (cont’d) 22
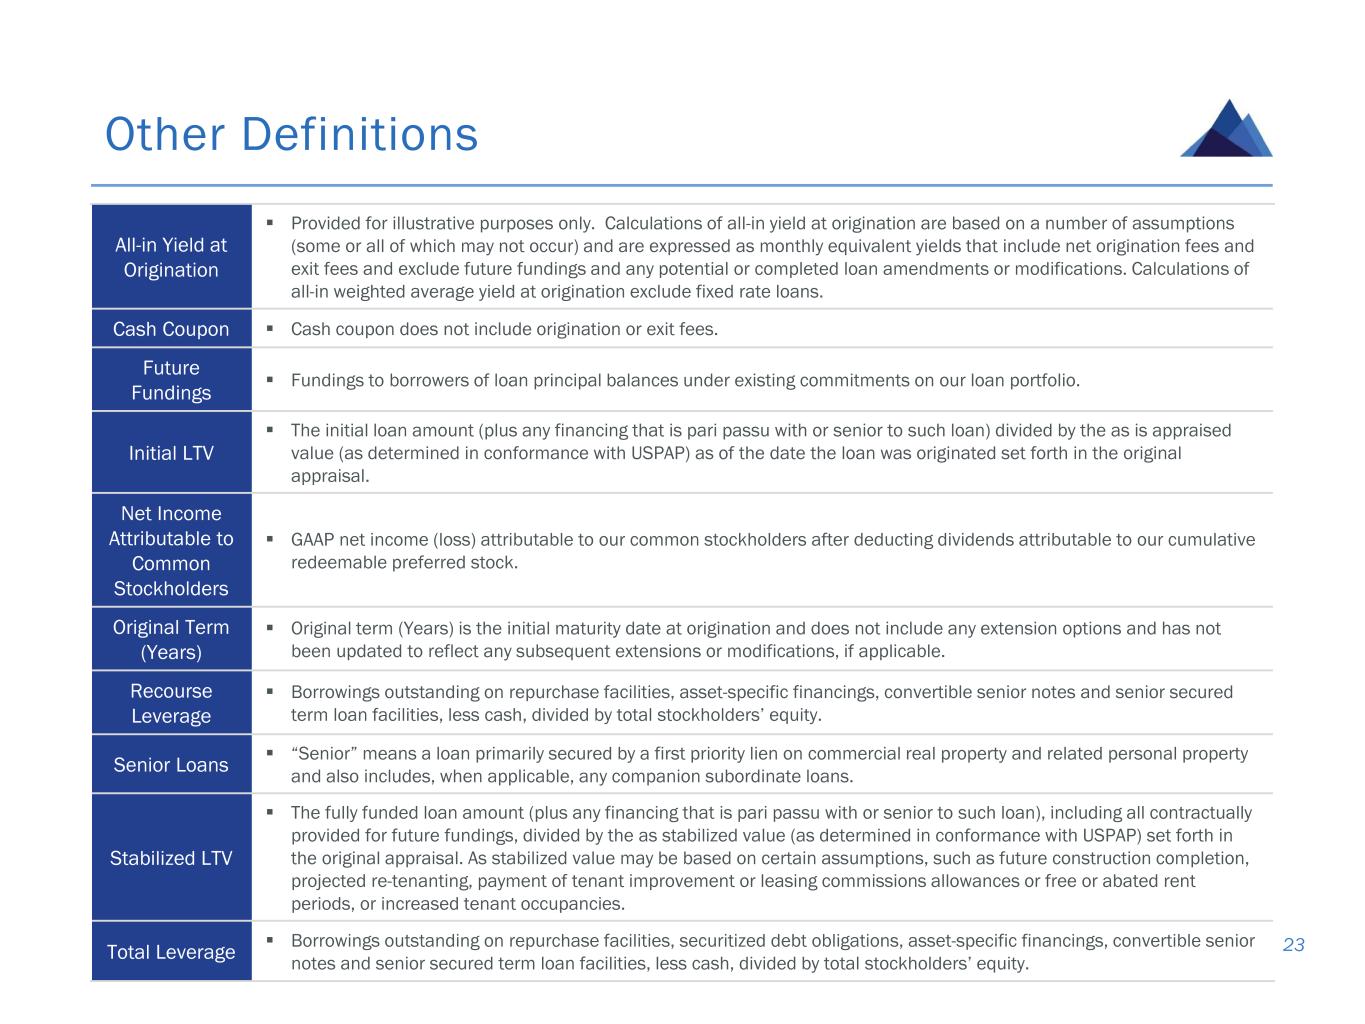
Other Definitions 23 All-in Yield at Origination ▪ Provided for illustrative purposes only. Calculations of all-in yield at origination are based on a number of assumptions (some or all of which may not occur) and are expressed as monthly equivalent yields that include net origination fees and exit fees and exclude future fundings and any potential or completed loan amendments or modifications. Calculations of all-in weighted average yield at origination exclude fixed rate loans. Cash Coupon ▪ Cash coupon does not include origination or exit fees. Future Fundings ▪ Fundings to borrowers of loan principal balances under existing commitments on our loan portfolio. Initial LTV ▪ The initial loan amount (plus any financing that is pari passu with or senior to such loan) divided by the as is appraised value (as determined in conformance with USPAP) as of the date the loan was originated set forth in the original appraisal. Net Income Attributable to Common Stockholders ▪ GAAP net income (loss) attributable to our common stockholders after deducting dividends attributable to our cumulative redeemable preferred stock. Original Term (Years) ▪ Original term (Years) is the initial maturity date at origination and does not include any extension options and has not been updated to reflect any subsequent extensions or modifications, if applicable. Recourse Leverage ▪ Borrowings outstanding on repurchase facilities, asset-specific financings, convertible senior notes and senior secured term loan facilities, less cash, divided by total stockholders’ equity. Senior Loans ▪ “Senior” means a loan primarily secured by a first priority lien on commercial real property and related personal property and also includes, when applicable, any companion subordinate loans. Stabilized LTV ▪ The fully funded loan amount (plus any financing that is pari passu with or senior to such loan), including all contractually provided for future fundings, divided by the as stabilized value (as determined in conformance with USPAP) set forth in the original appraisal. As stabilized value may be based on certain assumptions, such as future construction completion, projected re-tenanting, payment of tenant improvement or leasing commissions allowances or free or abated rent periods, or increased tenant occupancies. Total Leverage ▪ Borrowings outstanding on repurchase facilities, securitized debt obligations, asset-specific financings, convertible senior notes and senior secured term loan facilities, less cash, divided by total stockholders’ equity.
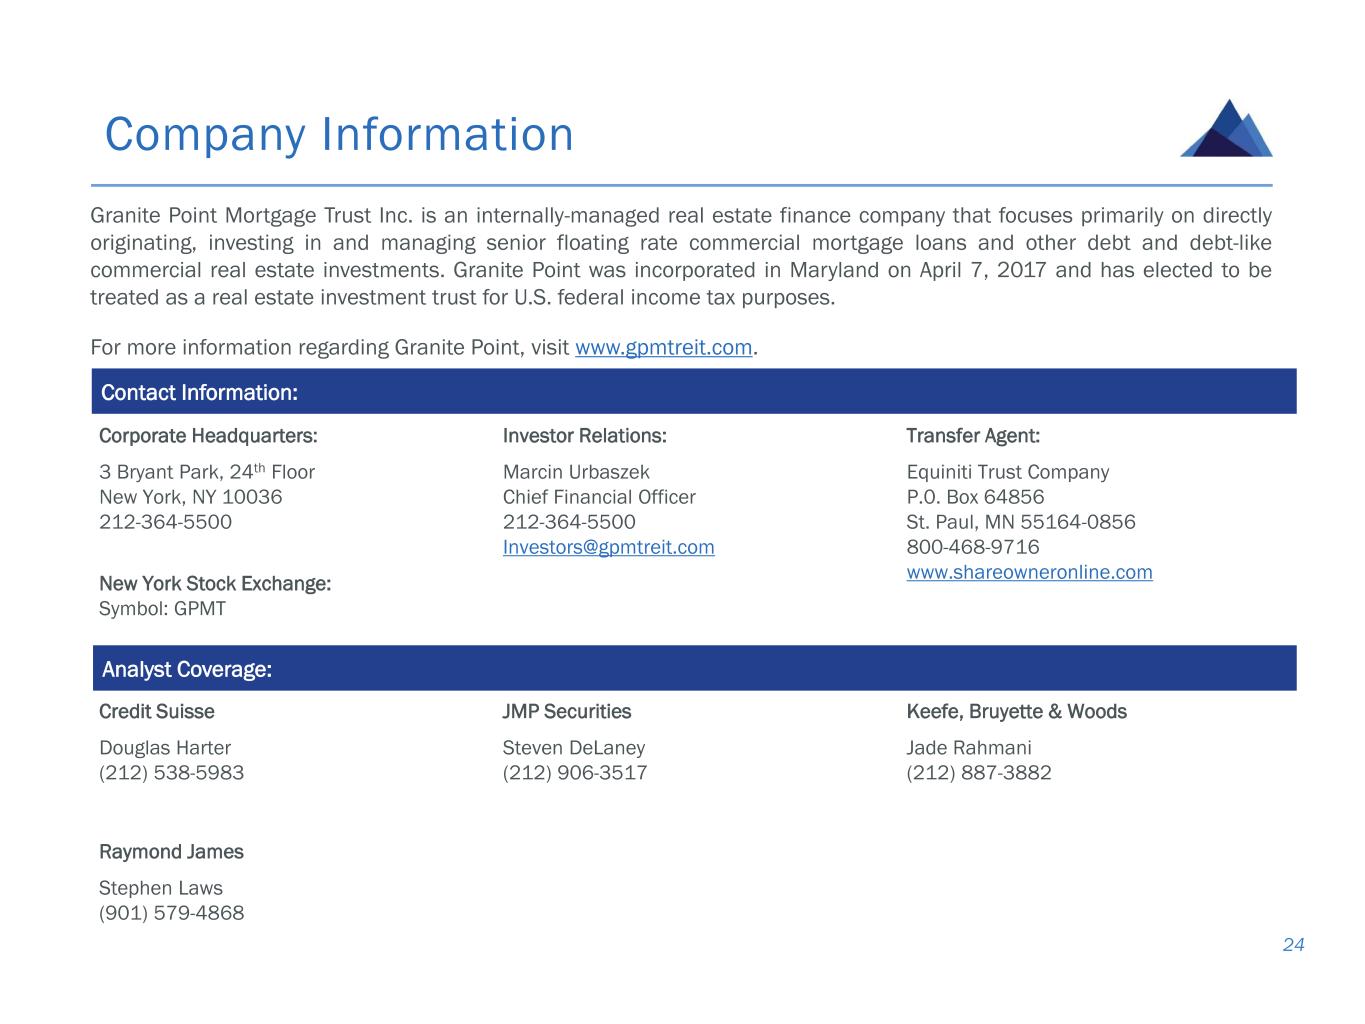
Company Information 24 Granite Point Mortgage Trust Inc. is an internally-managed real estate finance company that focuses primarily on directly originating, investing in and managing senior floating rate commercial mortgage loans and other debt and debt-like commercial real estate investments. Granite Point was incorporated in Maryland on April 7, 2017 and has elected to be treated as a real estate investment trust for U.S. federal income tax purposes. For more information regarding Granite Point, visit www.gpmtreit.com. Contact Information: Corporate Headquarters: 3 Bryant Park, 24th Floor New York, NY 10036 212-364-5500 New York Stock Exchange: Symbol: GPMT Investor Relations: Marcin Urbaszek Chief Financial Officer 212-364-5500 Investors@gpmtreit.com Transfer Agent: Equiniti Trust Company P.0. Box 64856 St. Paul, MN 55164-0856 800-468-9716 www.shareowneronline.com Credit Suisse Douglas Harter (212) 538-5983 JMP Securities Steven DeLaney (212) 906-3517 Keefe, Bruyette & Woods Jade Rahmani (212) 887-3882 Raymond James Stephen Laws (901) 579-4868 Analyst Coverage:
