000170364412/312023Q1FALSE0.0500894349.300017036442023-01-012023-03-310001703644us-gaap:CommonStockMember2023-01-012023-03-310001703644us-gaap:SeriesAPreferredStockMember2023-01-012023-03-3100017036442023-05-04xbrli:shares00017036442023-03-31iso4217:USD00017036442022-12-310001703644us-gaap:CumulativePreferredStockMember2022-01-012022-03-31xbrli:pure0001703644us-gaap:CumulativePreferredStockMember2023-01-012023-03-310001703644us-gaap:CumulativePreferredStockMember2023-03-31iso4217:USDxbrli:shares0001703644us-gaap:CumulativePreferredStockMember2022-12-310001703644us-gaap:SeriesAPreferredStockMember2022-01-012022-03-310001703644us-gaap:SeriesAPreferredStockMember2023-03-310001703644us-gaap:SeriesAPreferredStockMember2022-12-310001703644us-gaap:VariableInterestEntityPrimaryBeneficiaryMember2023-03-310001703644us-gaap:VariableInterestEntityPrimaryBeneficiaryMember2022-12-3100017036442022-01-012022-03-310001703644us-gaap:CommonStockMember2021-12-310001703644us-gaap:PreferredStockMember2021-12-310001703644us-gaap:AdditionalPaidInCapitalMember2021-12-310001703644us-gaap:RetainedEarningsMember2021-12-310001703644us-gaap:AccumulatedDistributionsInExcessOfNetIncomeMember2021-12-310001703644us-gaap:ParentMember2021-12-310001703644us-gaap:NoncontrollingInterestMember2021-12-3100017036442021-12-310001703644us-gaap:RetainedEarningsMember2022-01-012022-03-310001703644us-gaap:ParentMember2022-01-012022-03-310001703644us-gaap:PreferredStockMember2022-01-012022-03-310001703644us-gaap:AdditionalPaidInCapitalMember2022-01-012022-03-310001703644us-gaap:CommonStockMember2022-01-012022-03-310001703644us-gaap:CumulativePreferredStockMemberus-gaap:AccumulatedDistributionsInExcessOfNetIncomeMember2022-01-012022-03-310001703644us-gaap:CumulativePreferredStockMemberus-gaap:ParentMember2022-01-012022-03-310001703644us-gaap:SeriesAPreferredStockMemberus-gaap:AccumulatedDistributionsInExcessOfNetIncomeMember2022-01-012022-03-310001703644us-gaap:ParentMemberus-gaap:SeriesAPreferredStockMember2022-01-012022-03-310001703644us-gaap:AccumulatedDistributionsInExcessOfNetIncomeMember2022-01-012022-03-310001703644us-gaap:CommonStockMember2022-03-310001703644us-gaap:PreferredStockMember2022-03-310001703644us-gaap:AdditionalPaidInCapitalMember2022-03-310001703644us-gaap:RetainedEarningsMember2022-03-310001703644us-gaap:AccumulatedDistributionsInExcessOfNetIncomeMember2022-03-310001703644us-gaap:ParentMember2022-03-310001703644us-gaap:NoncontrollingInterestMember2022-03-3100017036442022-03-310001703644us-gaap:CommonStockMember2022-12-310001703644us-gaap:PreferredStockMember2022-12-310001703644us-gaap:AdditionalPaidInCapitalMember2022-12-310001703644us-gaap:RetainedEarningsMember2022-12-310001703644us-gaap:AccumulatedDistributionsInExcessOfNetIncomeMember2022-12-310001703644us-gaap:ParentMember2022-12-310001703644us-gaap:NoncontrollingInterestMember2022-12-310001703644us-gaap:RetainedEarningsMember2023-01-012023-03-310001703644us-gaap:ParentMember2023-01-012023-03-310001703644us-gaap:CommonStockMember2023-01-012023-03-310001703644us-gaap:AdditionalPaidInCapitalMember2023-01-012023-03-310001703644us-gaap:CumulativePreferredStockMemberus-gaap:AccumulatedDistributionsInExcessOfNetIncomeMember2023-01-012023-03-310001703644us-gaap:CumulativePreferredStockMemberus-gaap:ParentMember2023-01-012023-03-310001703644us-gaap:SeriesAPreferredStockMemberus-gaap:AccumulatedDistributionsInExcessOfNetIncomeMember2023-01-012023-03-310001703644us-gaap:ParentMemberus-gaap:SeriesAPreferredStockMember2023-01-012023-03-310001703644us-gaap:AccumulatedDistributionsInExcessOfNetIncomeMember2023-01-012023-03-310001703644us-gaap:CommonStockMember2023-03-310001703644us-gaap:PreferredStockMember2023-03-310001703644us-gaap:AdditionalPaidInCapitalMember2023-03-310001703644us-gaap:RetainedEarningsMember2023-03-310001703644us-gaap:AccumulatedDistributionsInExcessOfNetIncomeMember2023-03-310001703644us-gaap:ParentMember2023-03-310001703644us-gaap:NoncontrollingInterestMember2023-03-31gpmt:segment0001703644us-gaap:FirstMortgageMember2023-03-310001703644us-gaap:JuniorLoansMember2023-03-31gpmt:loan0001703644us-gaap:FirstMortgageMember2023-01-012023-03-310001703644us-gaap:JuniorLoansMember2023-01-012023-03-310001703644us-gaap:FirstMortgageMember2022-12-310001703644us-gaap:JuniorLoansMember2022-12-310001703644us-gaap:FirstMortgageMember2022-01-012022-12-310001703644us-gaap:JuniorLoansMember2022-01-012022-12-3100017036442022-01-012022-12-310001703644srt:OfficeBuildingMember2023-03-310001703644srt:OfficeBuildingMember2022-12-310001703644srt:MultifamilyMember2023-03-310001703644srt:MultifamilyMember2022-12-310001703644srt:HotelMember2023-03-310001703644srt:HotelMember2022-12-310001703644srt:RetailSiteMember2023-03-310001703644srt:RetailSiteMember2022-12-310001703644srt:IndustrialPropertyMember2023-03-310001703644srt:IndustrialPropertyMember2022-12-310001703644srt:OtherPropertyMember2023-03-310001703644srt:OtherPropertyMember2022-12-310001703644gpmt:UnitedStatesNortheasternRegionMember2023-03-310001703644gpmt:UnitedStatesNortheasternRegionMember2022-12-310001703644gpmt:UnitedStatesSouthwesternRegionMember2023-03-310001703644gpmt:UnitedStatesSouthwesternRegionMember2022-12-310001703644gpmt:UnitedStatesWesternRegionMember2023-03-310001703644gpmt:UnitedStatesWesternRegionMember2022-12-310001703644gpmt:UnitedStatesMidwesternRegionMember2023-03-310001703644gpmt:UnitedStatesMidwesternRegionMember2022-12-310001703644gpmt:UnitedStatesSoutheasternRegionMember2023-03-310001703644gpmt:UnitedStatesSoutheasternRegionMember2022-12-310001703644us-gaap:CollateralPledgedMember2023-03-310001703644us-gaap:CollateralPledgedMember2022-12-310001703644us-gaap:FairValueMeasurementsNonrecurringMember2023-03-310001703644gpmt:LoanOneMemberus-gaap:FairValueMeasurementsNonrecurringMember2023-03-310001703644us-gaap:UnfundedLoanCommitmentMember2023-03-310001703644gpmt:NonAccrualLoanMember2023-01-012023-03-310001703644gpmt:RiskRating5Membersrt:HotelMember2023-03-310001703644us-gaap:SeniorLoansMemberus-gaap:FinancialAssetNotPastDueMember2023-03-310001703644us-gaap:SeniorLoansMemberus-gaap:FinancingReceivables30To59DaysPastDueMember2023-03-310001703644us-gaap:SeniorLoansMemberus-gaap:FinancingReceivables60To89DaysPastDueMember2023-03-310001703644us-gaap:SeniorLoansMemberus-gaap:FinancingReceivablesEqualToGreaterThan90DaysPastDueMember2023-03-310001703644us-gaap:SeniorLoansMemberus-gaap:FinancialAssetPastDueMember2023-03-310001703644us-gaap:SeniorLoansMember2023-03-310001703644gpmt:SubordinatedAndMezzanineLoansMemberus-gaap:FinancialAssetNotPastDueMember2023-03-310001703644gpmt:SubordinatedAndMezzanineLoansMemberus-gaap:FinancingReceivables30To59DaysPastDueMember2023-03-310001703644gpmt:SubordinatedAndMezzanineLoansMemberus-gaap:FinancingReceivables60To89DaysPastDueMember2023-03-310001703644gpmt:SubordinatedAndMezzanineLoansMemberus-gaap:FinancingReceivablesEqualToGreaterThan90DaysPastDueMember2023-03-310001703644gpmt:SubordinatedAndMezzanineLoansMemberus-gaap:FinancialAssetPastDueMember2023-03-310001703644gpmt:SubordinatedAndMezzanineLoansMember2023-03-310001703644us-gaap:FinancialAssetNotPastDueMember2023-03-310001703644us-gaap:FinancingReceivables30To59DaysPastDueMember2023-03-310001703644us-gaap:FinancingReceivables60To89DaysPastDueMember2023-03-310001703644us-gaap:FinancingReceivablesEqualToGreaterThan90DaysPastDueMember2023-03-310001703644us-gaap:FinancialAssetPastDueMember2023-03-310001703644us-gaap:SeniorLoansMemberus-gaap:FinancialAssetNotPastDueMember2022-12-310001703644us-gaap:SeniorLoansMemberus-gaap:FinancingReceivables30To59DaysPastDueMember2022-12-310001703644us-gaap:SeniorLoansMemberus-gaap:FinancingReceivables60To89DaysPastDueMember2022-12-310001703644us-gaap:SeniorLoansMemberus-gaap:FinancingReceivablesEqualToGreaterThan90DaysPastDueMember2022-12-310001703644us-gaap:SeniorLoansMemberus-gaap:FinancialAssetPastDueMember2022-12-310001703644us-gaap:SeniorLoansMember2022-12-310001703644gpmt:SubordinatedAndMezzanineLoansMemberus-gaap:FinancialAssetNotPastDueMember2022-12-310001703644gpmt:SubordinatedAndMezzanineLoansMemberus-gaap:FinancingReceivables30To59DaysPastDueMember2022-12-310001703644gpmt:SubordinatedAndMezzanineLoansMemberus-gaap:FinancingReceivables60To89DaysPastDueMember2022-12-310001703644gpmt:SubordinatedAndMezzanineLoansMemberus-gaap:FinancingReceivablesEqualToGreaterThan90DaysPastDueMember2022-12-310001703644gpmt:SubordinatedAndMezzanineLoansMemberus-gaap:FinancialAssetPastDueMember2022-12-310001703644gpmt:SubordinatedAndMezzanineLoansMember2022-12-310001703644us-gaap:FinancialAssetNotPastDueMember2022-12-310001703644us-gaap:FinancingReceivables30To59DaysPastDueMember2022-12-310001703644us-gaap:FinancingReceivables60To89DaysPastDueMember2022-12-310001703644us-gaap:FinancingReceivablesEqualToGreaterThan90DaysPastDueMember2022-12-310001703644us-gaap:FinancialAssetPastDueMember2022-12-310001703644gpmt:RiskRating1Member2023-03-310001703644gpmt:RiskRating1Member2022-12-310001703644gpmt:RiskRating2Member2023-03-310001703644gpmt:RiskRating2Member2022-12-310001703644gpmt:RiskRating3Member2023-03-310001703644gpmt:RiskRating3Member2022-12-310001703644gpmt:RiskRating4Member2023-03-310001703644gpmt:RiskRating4Member2022-12-310001703644gpmt:RiskRating5Member2023-03-310001703644gpmt:RiskRating5Member2022-12-310001703644us-gaap:LoansReceivableMemberus-gaap:VariableInterestEntityPrimaryBeneficiaryMember2023-03-310001703644us-gaap:LoansReceivableMemberus-gaap:VariableInterestEntityPrimaryBeneficiaryMember2022-12-310001703644gpmt:FinancingReceivableAllowanceforCreditLossMemberus-gaap:VariableInterestEntityPrimaryBeneficiaryMember2023-03-310001703644gpmt:FinancingReceivableAllowanceforCreditLossMemberus-gaap:VariableInterestEntityPrimaryBeneficiaryMember2022-12-310001703644gpmt:LoansReceivableNetMemberus-gaap:VariableInterestEntityPrimaryBeneficiaryMember2023-03-310001703644gpmt:LoansReceivableNetMemberus-gaap:VariableInterestEntityPrimaryBeneficiaryMember2022-12-310001703644gpmt:RestrictedCashAndCashEquivalentsMemberus-gaap:VariableInterestEntityPrimaryBeneficiaryMember2023-03-310001703644gpmt:RestrictedCashAndCashEquivalentsMemberus-gaap:VariableInterestEntityPrimaryBeneficiaryMember2022-12-310001703644us-gaap:OtherAssetsMemberus-gaap:VariableInterestEntityPrimaryBeneficiaryMember2023-03-310001703644us-gaap:OtherAssetsMemberus-gaap:VariableInterestEntityPrimaryBeneficiaryMember2022-12-310001703644us-gaap:BorrowingsMemberus-gaap:VariableInterestEntityPrimaryBeneficiaryMember2023-03-310001703644us-gaap:BorrowingsMemberus-gaap:VariableInterestEntityPrimaryBeneficiaryMember2022-12-310001703644us-gaap:VariableInterestEntityPrimaryBeneficiaryMemberus-gaap:OtherLiabilitiesMember2023-03-310001703644us-gaap:VariableInterestEntityPrimaryBeneficiaryMemberus-gaap:OtherLiabilitiesMember2022-12-310001703644gpmt:GPMT2019FL2CRECLOMembergpmt:FinancingProvidedMember2023-03-160001703644gpmt:CollateralAssetsMembergpmt:GPMT2019FL2CRECLOMember2023-03-160001703644gpmt:GPMT2019FL2CRECLOMember2023-03-162023-03-160001703644gpmt:CollateralAssetsMembergpmt:GPMT2021FL4CRECLOMember2023-03-310001703644gpmt:CollateralAssetsMembergpmt:GPMT2021FL4CRECLOMember2022-12-310001703644gpmt:GPMT2021FL4CRECLOMembergpmt:FinancingProvidedMember2023-03-310001703644gpmt:GPMT2021FL4CRECLOMembergpmt:FinancingProvidedMember2022-12-310001703644gpmt:CollateralAssetsMembergpmt:GPMT2021FL3CRECLOMember2023-03-310001703644gpmt:CollateralAssetsMembergpmt:GPMT2021FL3CRECLOMember2022-12-310001703644gpmt:FinancingProvidedMembergpmt:GPMT2021FL3CRECLOMember2023-03-310001703644gpmt:FinancingProvidedMembergpmt:GPMT2021FL3CRECLOMember2022-12-310001703644gpmt:CollateralAssetsMembergpmt:GPMT2019FL2CRECLOMember2023-03-310001703644gpmt:CollateralAssetsMembergpmt:GPMT2019FL2CRECLOMember2022-12-310001703644gpmt:GPMT2019FL2CRECLOMembergpmt:FinancingProvidedMember2023-03-310001703644gpmt:GPMT2019FL2CRECLOMembergpmt:FinancingProvidedMember2022-12-310001703644gpmt:CollateralAssetsMember2023-03-310001703644gpmt:CollateralAssetsMember2022-12-310001703644gpmt:FinancingProvidedMember2023-03-310001703644gpmt:FinancingProvidedMember2022-12-310001703644us-gaap:LoansReceivableMembergpmt:LenderMorganStanleyBankMember2023-03-310001703644gpmt:LenderGoldmanSachsBankMemberus-gaap:LoansReceivableMember2023-03-310001703644gpmt:LenderJPMorganChaseBankMemberus-gaap:LoansReceivableMember2023-03-310001703644gpmt:LenderCitibankMemberus-gaap:LoansReceivableMember2023-03-310001703644us-gaap:LoansReceivableMembergpmt:CentennialCorporateFinanceGroupMember2023-03-310001703644gpmt:LenderCanadianImperialBankofCommerceMember2023-03-310001703644us-gaap:SecuredDebtMember2023-03-310001703644us-gaap:LoansReceivableMembergpmt:LenderMorganStanleyBankMember2022-12-310001703644gpmt:LenderGoldmanSachsBankMemberus-gaap:LoansReceivableMember2022-12-310001703644gpmt:LenderJPMorganChaseBankMemberus-gaap:LoansReceivableMember2022-12-310001703644gpmt:LenderCitibankMemberus-gaap:LoansReceivableMember2022-12-310001703644gpmt:LenderWellsFargoBankMemberus-gaap:LoansReceivableMember2022-12-310001703644us-gaap:LoansReceivableMembergpmt:CentennialCorporateFinanceGroupMember2022-12-310001703644gpmt:LenderCanadianImperialBankofCommerceMember2022-12-310001703644gpmt:LenderCanadianImperialBankofCommerceMemberus-gaap:SecuredDebtMember2022-12-310001703644us-gaap:SecuredDebtMember2022-12-310001703644us-gaap:SubsequentEventMemberus-gaap:LoansReceivableMembergpmt:CentennialCorporateFinanceGroupMember2023-04-010001703644us-gaap:RevolvingCreditFacilityMember2023-03-310001703644us-gaap:RevolvingCreditFacilityMember2022-12-310001703644gpmt:MaturityWithinOneYearMember2023-03-310001703644gpmt:MaturityOneToTwoYearsMember2023-03-310001703644gpmt:MaturityTwoToThreeMember2023-03-310001703644gpmt:MaturityThreeToFourYearsMember2023-03-310001703644gpmt:MaturityFourToFiveYearsMember2023-03-310001703644gpmt:MaturityOverFiveYearsMember2023-03-310001703644gpmt:MaturityWithinOneYearMember2022-12-310001703644gpmt:MaturityOneToTwoYearsMember2022-12-310001703644gpmt:MaturityTwoToThreeMember2022-12-310001703644gpmt:MaturityThreeToFourYearsMember2022-12-310001703644gpmt:MaturityFourToFiveYearsMember2022-12-310001703644gpmt:MaturityOverFiveYearsMember2022-12-310001703644gpmt:RepurchaseAgreementCounterpartyMorganStanleyBankMember2023-03-310001703644gpmt:RepurchaseAgreementCounterpartyMorganStanleyBankMember2023-01-012023-03-310001703644gpmt:RepurchaseAgreementCounterpartyMorganStanleyBankMember2022-12-310001703644gpmt:RepurchaseAgreementCounterpartyMorganStanleyBankMember2022-01-012022-12-310001703644gpmt:RepurchaseAgreementCounterpartyJPMorganChaseBankMember2023-03-310001703644gpmt:RepurchaseAgreementCounterpartyJPMorganChaseBankMember2023-01-012023-03-310001703644gpmt:RepurchaseAgreementCounterpartyJPMorganChaseBankMember2022-12-310001703644gpmt:RepurchaseAgreementCounterpartyJPMorganChaseBankMember2022-01-012022-12-310001703644gpmt:RepurchaseAgreementCounterpartyGoldmanSachsBankMember2023-03-310001703644gpmt:RepurchaseAgreementCounterpartyGoldmanSachsBankMember2023-01-012023-03-310001703644gpmt:RepurchaseAgreementCounterpartyGoldmanSachsBankMember2022-12-310001703644gpmt:RepurchaseAgreementCounterpartyGoldmanSachsBankMember2022-01-012022-12-310001703644gpmt:RepurchaseAgreementCounterpartyCitibankMember2023-03-310001703644gpmt:RepurchaseAgreementCounterpartyCitibankMember2023-01-012023-03-310001703644gpmt:RepurchaseAgreementCounterpartyCitibankMember2022-12-310001703644gpmt:RepurchaseAgreementCounterpartyCitibankMember2022-01-012022-12-310001703644gpmt:RepurchaseAgreementCounterpartyWellsFargoBankMember2023-03-310001703644gpmt:RepurchaseAgreementCounterpartyWellsFargoBankMember2023-01-012023-03-310001703644gpmt:RepurchaseAgreementCounterpartyWellsFargoBankMember2022-12-310001703644gpmt:RepurchaseAgreementCounterpartyWellsFargoBankMember2022-01-012022-12-310001703644gpmt:RepurchaseAgreementCounterpartyCentennialCorporateFinanceGroupMember2023-03-310001703644gpmt:RepurchaseAgreementCounterpartyCentennialCorporateFinanceGroupMember2023-01-012023-03-310001703644gpmt:RepurchaseAgreementCounterpartyCentennialCorporateFinanceGroupMember2022-12-310001703644gpmt:RepurchaseAgreementCounterpartyCentennialCorporateFinanceGroupMember2022-01-012022-12-310001703644srt:MaximumMember2023-03-310001703644srt:MinimumMember2023-03-310001703644us-gaap:PrivatePlacementMembergpmt:ConvertibleDebt2018IssuanceMemberus-gaap:ConvertibleDebtMember2018-10-310001703644gpmt:ConvertibleDebt2018IssuanceMember2018-10-012018-10-310001703644gpmt:ConvertibleDebt2018IssuanceMemberus-gaap:ConvertibleDebtMember2018-10-310001703644us-gaap:ConvertibleDebtMember2023-03-310001703644us-gaap:ConvertibleDebtMember2022-12-310001703644gpmt:ConvertibleSeniorNotesMember2023-01-012023-03-310001703644gpmt:ConvertibleSeniorNotesMember2022-01-012022-03-310001703644gpmt:October2023ConvertibleSeniorNotesMember2023-03-310001703644gpmt:October2023ConvertibleSeniorNotesMember2022-12-310001703644gpmt:ConvertibleDebt2018IssuanceMember2023-01-012023-03-310001703644gpmt:TermLoanMember2020-09-250001703644gpmt:TermLoanMember2020-09-280001703644gpmt:SeniorSecuredTermLoanFacilitiesMember2022-01-012022-03-310001703644gpmt:SeniorSecuredTermLoanFacilitiesMember2023-01-012023-03-310001703644gpmt:SeniorSecuredTermLoanMember2023-01-012023-03-310001703644gpmt:SeniorSecuredTermLoanMember2022-01-012022-03-310001703644gpmt:TermLoanMember2021-02-040001703644gpmt:RestrictedCashAndCashEquivalentsMember2023-03-310001703644gpmt:MeasurementInputExitCapitalizationRateMembersrt:MinimumMember2023-03-310001703644srt:MaximumMembergpmt:MeasurementInputExitCapitalizationRateMember2023-03-310001703644us-gaap:MeasurementInputDiscountRateMembersrt:MinimumMember2023-03-310001703644srt:MaximumMemberus-gaap:MeasurementInputDiscountRateMember2023-03-310001703644gpmt:MeasurementInputReturnOnCostAssumptionMembersrt:MinimumMember2023-03-310001703644gpmt:MeasurementInputReturnOnCostAssumptionMembersrt:MaximumMember2023-03-310001703644us-gaap:SeriesAPreferredStockMembergpmt:SubREITMember2021-01-310001703644us-gaap:SeriesAPreferredStockMember2021-01-310001703644us-gaap:SeriesAPreferredStockMembergpmt:SubREITMember2021-01-012021-01-310001703644us-gaap:SeriesAPreferredStockMembergpmt:PublicOfferingMember2021-11-302021-11-300001703644gpmt:PublicOfferingMember2021-11-302021-11-300001703644us-gaap:OverAllotmentOptionMemberus-gaap:SeriesAPreferredStockMember2022-01-182022-02-080001703644us-gaap:SeriesAPreferredStockMember2021-11-300001703644us-gaap:CommonStockMember2023-03-162023-03-160001703644us-gaap:CommonStockMember2022-03-172022-03-170001703644us-gaap:CommonStockMember2022-01-012022-03-3100017036442021-12-160001703644gpmt:ShareRepurchaseProgramMember2023-01-012023-03-310001703644gpmt:ShareRepurchaseProgramMember2022-01-012022-03-310001703644gpmt:RepurchasedSharesFromEmployeesMember2023-01-012023-03-310001703644gpmt:RepurchasedSharesFromEmployeesMember2022-01-012022-03-310001703644us-gaap:PreferredStockMember2023-03-162023-03-160001703644us-gaap:PreferredStockMember2023-01-012023-03-310001703644us-gaap:PreferredStockMember2022-03-172022-03-170001703644us-gaap:PreferredStockMember2022-01-012022-03-310001703644gpmt:A2022PlanMember2023-03-310001703644gpmt:A2017PlanMember2023-03-310001703644us-gaap:RestrictedStockMember2023-01-012023-03-310001703644us-gaap:RestrictedStockMember2022-01-012022-03-310001703644us-gaap:RestrictedStockUnitsRSUMember2023-03-310001703644us-gaap:RestrictedStockUnitsRSUMember2023-01-012023-03-310001703644us-gaap:RestrictedStockUnitsRSUMember2022-01-012022-03-310001703644us-gaap:PhantomShareUnitsPSUsMember2023-01-012023-03-310001703644srt:MinimumMemberus-gaap:PhantomShareUnitsPSUsMember2023-01-012023-03-310001703644srt:MaximumMemberus-gaap:PhantomShareUnitsPSUsMember2023-01-012023-03-310001703644us-gaap:ShareBasedCompensationAwardTrancheOneMemberus-gaap:PhantomShareUnitsPSUsMember2023-01-012023-03-310001703644us-gaap:ShareBasedCompensationAwardTrancheTwoMemberus-gaap:PhantomShareUnitsPSUsMember2023-01-012023-03-310001703644us-gaap:ShareBasedCompensationAwardTrancheThreeMemberus-gaap:PhantomShareUnitsPSUsMember2023-01-012023-03-310001703644gpmt:ShareBasedPaymentArrangementTrancheFourMemberus-gaap:PhantomShareUnitsPSUsMember2023-01-012023-03-310001703644gpmt:ShareBasedPaymentArrangementTrancheFiveMemberus-gaap:PhantomShareUnitsPSUsMember2023-01-012023-03-310001703644gpmt:ShareBasedPaymentArrangementTrancheSixMemberus-gaap:PhantomShareUnitsPSUsMember2023-01-012023-03-310001703644us-gaap:PhantomShareUnitsPSUsMember2023-03-310001703644us-gaap:PhantomShareUnitsPSUsMember2022-01-012022-03-310001703644us-gaap:RestrictedStockMember2022-12-310001703644us-gaap:RestrictedStockUnitsRSUMember2022-12-310001703644us-gaap:PhantomShareUnitsPSUsMember2022-12-310001703644us-gaap:RestrictedStockMember2023-03-310001703644gpmt:YearOneMemberus-gaap:RestrictedStockMember2023-01-012023-03-310001703644gpmt:YearOneMemberus-gaap:RestrictedStockUnitsRSUMember2023-01-012023-03-310001703644gpmt:YearOneMemberus-gaap:PhantomShareUnitsPSUsMember2023-01-012023-03-310001703644gpmt:YearOneMember2023-01-012023-03-310001703644us-gaap:RestrictedStockMembergpmt:YearTwoMember2023-01-012023-03-310001703644us-gaap:RestrictedStockUnitsRSUMembergpmt:YearTwoMember2023-01-012023-03-310001703644gpmt:YearTwoMemberus-gaap:PhantomShareUnitsPSUsMember2023-01-012023-03-310001703644gpmt:YearTwoMember2023-01-012023-03-310001703644gpmt:YearThreeMemberus-gaap:RestrictedStockMember2023-01-012023-03-310001703644gpmt:YearThreeMemberus-gaap:RestrictedStockUnitsRSUMember2023-01-012023-03-310001703644gpmt:YearThreeMemberus-gaap:PhantomShareUnitsPSUsMember2023-01-012023-03-310001703644gpmt:YearThreeMember2023-01-012023-03-310001703644us-gaap:RestrictedStockMembergpmt:YearFourMember2023-01-012023-03-310001703644us-gaap:RestrictedStockUnitsRSUMembergpmt:YearFourMember2023-01-012023-03-310001703644gpmt:YearFourMemberus-gaap:PhantomShareUnitsPSUsMember2023-01-012023-03-310001703644gpmt:YearFourMember2023-01-012023-03-310001703644us-gaap:ConvertibleDebtSecuritiesMember2023-01-012023-03-310001703644us-gaap:ConvertibleDebtSecuritiesMember2022-01-012022-03-31
UNITED STATES
SECURITIES AND EXCHANGE COMMISSION
Washington, D.C. 20549
FORM 10-Q
| | | | | |
| ☒ | QUARTERLY REPORT PURSUANT TO SECTION 13 OR 15(d) OF THE SECURITIES EXCHANGE ACT OF 1934 |
For the quarterly period ended March 31, 2023
OR
| | | | | |
| ☐ | TRANSITION REPORT PURSUANT TO SECTION 13 OR 15(d) OF THE SECURITIES EXCHANGE ACT OF 1934 |
For the transition period from to
Commission File Number: 001-38124
GRANITE POINT MORTGAGE TRUST INC.
(Exact name of registrant as specified in its charter)
| | | | | | | | |
| Maryland | | 61-1843143 |
| (State or other jurisdiction of incorporation or organization) | | (I.R.S. Employer Identification No.) |
| | | | | | | | | | | |
3 Bryant Park, Suite 2400A | | |
| New York, | New York | | 10036 |
| (Address of principal executive offices) | | (Zip Code) |
(212) 364-5500
(Registrant’s telephone number, including area code)
Securities registered pursuant to Section 12(b) of the Act:
| | | | | | | | | | | | | | |
| Title of each class | | Trading Symbol(s) | | Name of each exchange on which registered |
| Common Stock, par value $0.01 per share | | GPMT | | NYSE |
| 7.00% Series A Fixed-to-Floating Rate Cumulative Redeemable Preferred Stock, par value $0.01 per share | | GPMTPrA | | NYSE |
Indicate by check mark whether the registrant (1) has filed all reports required to be filed by Section 13 or 15(d) of the Securities Exchange Act of 1934 during the preceding 12 months (or for such shorter period that the registrant was required to file such reports), and (2) has been subject to such filing requirements for the past 90 days. Yes ☒ No ☐
Indicate by check mark whether the registrant has submitted electronically every Interactive Data File required to be submitted pursuant to Rule 405 of Regulation S-T (§232.405 of this chapter) during the preceding 12 months (or for such shorter period that the registrant was required to submit such files). Yes ☒ No ☐
Indicate by check mark whether the registrant is a large accelerated filer, an accelerated filer, a non-accelerated filer, a smaller reporting company, or an emerging growth company. See the definitions of “large accelerated filer,” “accelerated filer,” “smaller reporting company,” and “emerging growth company” in Rule 12b-2 of the Exchange Act.
| | | | | | | | | | | | | | |
| Large accelerated filer | ☐ | | Accelerated filer | ☒ |
| Non-accelerated filer | ☐ | | Smaller reporting company | ☐ |
| | | Emerging growth company | ☐ |
If an emerging growth company, indicate by check mark if the registrant has elected not to use the extended transition period for complying with any new or revised financial accounting standards provided pursuant to Section 13(a) of the Exchange Act. ☐
Indicate by check mark whether the registrant is a shell company (as defined in Rule 12b-2 of the Exchange Act). Yes ☐ No ☒
Indicate the number of shares outstanding of each of the issuer’s classes of common stock, as of the latest practicable date.
As of May 4, 2023, there were 51,526,039 shares of outstanding common stock, par value $0.01 per share, issued and outstanding.
GRANITE POINT MORTGAGE TRUST INC.
INDEX
| | | | | | | | |
| | Page |
| PART I - FINANCIAL INFORMATION | |
Item 1. | Financial Statements (unaudited) | |
| | |
| | |
| | |
| | |
| | |
| | |
| | |
| | |
| PART II - OTHER INFORMATION | |
| | |
| | |
| | |
| | |
| | |
| | |
| | |
| |
| |
CAUTIONARY NOTE REGARDING FORWARD-LOOKING STATEMENTS
This Quarterly Report on Form 10-Q contains, or incorporates by reference, not only historical information, but also forward-looking statements within the meaning of Section 27A of the Securities Act of 1933, as amended, or the Securities Act, and Section 21E of the Exchange Act of 1934, as amended, or the Exchange Act, and that are subject to the safe harbors created by such sections. Forward-looking statements involve numerous risks and uncertainties. Our actual results may differ from our beliefs, expectations, estimates and projections and, consequently, you should not rely on these forward-looking statements as predictions of future events. Forward-looking statements are not historical in nature and can be identified by words such as “anticipate,” “estimate,” “will,” “should,” “expect,” “target,” “believe,” “outlook,” “potential,” “continue,” “intend,” “seek,” “plan,” “goals,” “future,” “likely,” “may” and similar expressions or their negative forms, or by references to strategy, plans or intentions. By their nature, forward-looking statements speak only as of the date they are made, are not statements of historical facts or guarantees of future performance and are subject to risks, uncertainties, assumptions or changes in circumstances that are difficult to predict or quantify. Our expectations, beliefs and estimates are expressed in good faith and we believe there is a reasonable basis for them. However, there can be no assurance that management's expectations, beliefs and estimates will prove to be correct or be achieved and actual results may vary materially from what is expressed in or indicated by the forward-looking statements.
These forward-looking statements are subject to risks and uncertainties, including, among other things, those described in our Annual Report on Form 10-K for the year ended December 31, 2022, under the caption “Risk Factors.” Other risks, uncertainties and factors that could cause actual results to differ materially from those projected are described below and may be described from time to time in reports we file with the SEC, including our Quarterly Reports on Form 10-Q and Current Reports on Form 8-K. Forward-looking statements speak only as of the date they are made, and we undertake no obligation to update or revise any such forward-looking statements, whether as a result of new information, future events or otherwise.
Important factors that may affect our actual results include, among others:
•the general political, economic and competitive conditions in the markets in which we invest, including with respect to the lagging effects of and ongoing impacts of the pandemic on various subsectors of the real estate market, and their impact on our loan portfolio, financial condition and business operations;
•accelerating inflationary trends, spurred by multiple factors including high commodity prices, a tight labor market, and low residential vacancy rates, may result further in interest rate increases and lead to increased market volatility;
•higher interest rates imposed by the Federal Reserve may lead to a decrease in prepayment timing and an increase in the number of our borrowers who exercise extension options, which could extend beyond the term of certain secured financing agreements we use to finance our loan investments;
•the economic impact of escalating global trade tensions, including the conflict between Russia and Ukraine and the adoption or expansion of economic sanctions or trade restrictions;
•reduced demand for office, multifamily or retail space, including as a result of the COVID-19 pandemic and/or hybrid work schedules which allow work from remote locations other than the employer's office premises;
•defaults by borrowers in paying debt service on outstanding indebtedness and borrowers' abilities to manage and stabilize properties;
•our ability to obtain or maintain financing arrangements on terms favorable to us or at all;
•the level and volatility of prevailing interest rates and credit spreads;
•reductions in the yield on our investments and increases in the cost of our financing;
•general volatility of the securities markets in which we participate and the potential need to post additional collateral on our financing arrangements;
•the return or impact of current or future investments;
•changes in our business, investment strategies or target investments;
•increased competition from entities investing in our target investments;
•effects of hedging instruments on our target investments;
•changes in governmental regulations, tax law and rates and similar matters;
•our ability to maintain our qualification as a real estate investment trust, or REIT, for U.S. federal income tax purposes and our exclusion from registration under the Investment Company Act of 1940, as amended, or the Investment Company Act;
•availability of desirable investment opportunities;
•threats to information security, including by way of cyber-attacks;
•availability of qualified personnel;
•operational failures by third parties on whom we rely in the conduct of our business;
•estimates relating to our ability to make distributions to our stockholders in the future;
•acts of God, such as hurricanes, earthquakes and other natural disasters, including climate change-related risks, acts of war and/or terrorism, pandemics or outbreaks of infectious disease and other events that may cause unanticipated and uninsured performance declines and/or losses to us or the owners and operators of the real estate securing our investments;
•deterioration in the performance of the properties securing our investments that may cause deterioration in the performance of our investments, risks in collection of contractual interest payments and, potentially, principal losses to us, including the risk of credit loss charges and any impact on our ability to satisfy the covenants and conditions in our debt agreements; and
•difficulty or delays in redeploying the proceeds from repayments of our existing investments.
This Quarterly Report on Form 10-Q may contain statistics and other data that, in some cases, have been obtained or compiled from information made available by loan servicers and other third-party service providers.
PART I. FINANCIAL INFORMATION
Item 1. Financial Statements (unaudited)
GRANITE POINT MORTGAGE TRUST INC.
CONDENSED CONSOLIDATED BALANCE SHEETS
(in thousands, except share data)
| | | | | | | | | | | |
| March 31,
2023 | | December 31,
2022 |
| ASSETS | | | |
| Loans held-for-investment | $ | 3,310,830 | | | $ | 3,350,150 | |
| Allowance for credit losses | (128,451) | | | (82,335) | |
| Loans held-for-investment, net | 3,182,379 | | | 3,267,815 | |
| | | |
| | | |
| Cash and cash equivalents | 223,432 | | | 133,132 | |
| Restricted cash | 3,344 | | | 7,033 | |
| Accrued interest receivable | 13,869 | | | 13,413 | |
| | | |
| | | |
| | | |
| Other assets | 52,317 | | | 32,708 | |
Total Assets (1) | $ | 3,475,341 | | | $ | 3,454,101 | |
| LIABILITIES AND STOCKHOLDERS’ EQUITY | | | |
| Liabilities | | | |
| Repurchase facilities | $ | 1,191,571 | | | $ | 1,015,566 | |
| Securitized debt obligations | 1,039,407 | | | 1,138,749 | |
| Asset-specific financings | 45,823 | | | 44,913 | |
| Secured credit facility | 100,000 | | | 100,000 | |
| | | |
| Convertible senior notes | 131,131 | | | 130,918 | |
| | | |
| | | |
| | | |
| Dividends payable | 14,307 | | | 14,318 | |
| Other liabilities | 20,644 | | | 24,967 | |
Total Liabilities (1) | 2,542,883 | | | 2,469,431 | |
| Commitments and Contingencies (see Note 10) | | | |
10.00% cumulative redeemable preferred stock, par value $0.01 per share; 50,000,000 shares authorized, and 1,000 shares issued and outstanding ($1,000,000 liquidation preference) | 1,000 | | | 1,000 | |
| Stockholders’ Equity | | | |
7.00% Series A cumulative redeemable preferred stock, par value $0.01 per share; 11,500,000 shares authorized, and 8,229,500 and 8,229,500 shares issued and outstanding, respectively; liquidation preference $25.00 per share | 82 | | | 82 | |
Common stock, par value $0.01 per share; 450,000,000 shares authorized, and 51,526,039 and 52,350,989 shares issued and outstanding, respectively | 515 | | | 524 | |
| Additional paid-in capital | 1,198,272 | | | 1,202,315 | |
| Cumulative earnings | 96,864 | | | 130,693 | |
| Cumulative distributions to stockholders | (364,400) | | | (350,069) | |
| Total Granite Point Mortgage Trust Inc. Stockholders’ Equity | 931,333 | | | 983,545 | |
| Non-controlling interests | 125 | | | 125 | |
| Total Equity | $ | 931,458 | | | $ | 983,670 | |
| Total Liabilities and Stockholders’ Equity | $ | 3,475,341 | | | $ | 3,454,101 | |
____________________
(1)The condensed consolidated balance sheets include assets of consolidated variable interest entities, or VIEs, that can only be used to settle obligations of these VIEs, and liabilities of the consolidated VIEs for which creditors do not have recourse to Granite Point Mortgage Trust Inc. At March 31, 2023, and December 31, 2022, assets of the VIEs totaled $1,280,560 and $1,551,936, respectively, and liabilities of the VIEs totaled $1,041,473 and $1,141,028, respectively. See Note 4 - Variable Interest Entities and Securitized Debt Obligations for additional information.
The accompanying notes are an integral part of these condensed consolidated financial statements.
GRANITE POINT MORTGAGE TRUST INC.
CONDENSED CONSOLIDATED STATEMENTS OF COMPREHENSIVE (LOSS) INCOME
(in thousands, except share data)
| | | | | | | | | | | | | | | | | | | | |
| | | | Three Months Ended |
| | | | March 31, |
| | | | | | 2023 | | 2022 | | |
| Interest income: | | | |
| Loans held-for-investment | | | | | $ | 65,291 | | | $ | 47,298 | | | |
| | | | | | | | | | |
| | | | | | | | | | |
| | | | | | | | | | |
| Cash and cash equivalents | | | | | 1,428 | | | 23 | | | |
| Total interest income | | | | | 66,719 | | | 47,321 | | | |
| Interest expense: | | | | | | | | | |
| Repurchase facilities | | | | | 19,772 | | | 5,008 | | | |
| Secured credit facility | | | | | 2,929 | | | — | | | |
| Securitized debt obligations | | | | | 18,051 | | | 9,732 | | | |
| Convertible senior notes | | | | | 2,311 | | | 4,546 | | | |
| Term financing facility | | | | | — | | | 1,373 | | | |
| Asset-specific financings | | | | | 743 | | | 282 | | | |
| | | | | | | | | | |
| Senior secured term loan facilities | | | | | — | | | 2,868 | | | |
| Total interest expense | | | | | 43,806 | | | 23,809 | | | |
| Net interest income | | | | | 22,913 | | | 23,512 | | | |
| | | | | | | | | | |
| | | | | | | | | | |
| | | | | | | | | | |
| | | | | | | | | | |
| Other (loss) income: | | | | | | | | | |
| Provision for credit losses | | | | | (46,410) | | | (3,688) | | | |
| Gain (loss) on extinguishment of debt | | | | | 238 | | | (5,791) | | | |
| | | | | | | | | | |
| Fee income | | | | | — | | | 493 | | | |
| | | | | | | | | | |
| Total other (loss) income | | | | | (46,172) | | | (8,986) | | | |
| Expenses: | | | | | | | | | |
| | | | | | | | | | |
| | | | | | | | | | |
| Compensation and benefits | | | | | 5,912 | | | 5,816 | | | |
| Servicing expenses | | | | | 1,378 | | | 1,461 | | | |
| Other operating expenses | | | | | 3,271 | | | 2,614 | | | |
| | | | | | | | | | |
| Total expenses | | | | | 10,561 | | | 9,891 | | | |
| (Loss) income before income taxes | | | | | (33,820) | | | 4,635 | | | |
| Provision for (benefit from) income taxes | | | | | 9 | | | (1) | | | |
| Net (loss) income | | | | | (33,829) | | | 4,636 | | | |
| Dividends on preferred stock | | | | | 3,625 | | | 3,625 | | | |
| | | | | | | | | | |
| Net (loss) income attributable to common stockholders | | | | | $ | (37,454) | | | $ | 1,011 | | | |
| Basic (loss) earnings per weighted average common share | | | | | $ | (0.72) | | | $ | 0.02 | | | |
| Diluted (loss) earnings per weighted average common share | | | | | $ | (0.72) | | | $ | 0.02 | | | |
| | | | | | | | | | |
| Weighted average number of shares of common stock outstanding: | | | | | | | | | |
| Basic | | | | | 52,308,380 | | | 53,857,051 | | | |
| Diluted | | | | | 52,308,380 | | | 53,961,497 | | | |
| | | | | | | | | | |
| Net (loss) income attributable to common stockholders | | | | | $ | (37,454) | | | $ | 1,011 | | | |
| | | | | | | | | | |
| | | | | | | | | | |
| | | | | | | | | | |
| Comprehensive (loss) income | | | | | $ | (37,454) | | | $ | 1,011 | | | |
The accompanying notes are an integral part of these condensed consolidated financial statements.
GRANITE POINT MORTGAGE TRUST INC
CONDENSED CONSOLIDATED STATEMENTS OF STOCKHOLDERS’ EQUITY
(in thousands, except share data)
| | | | | | | | | | | | | | | | | | | | | | | | | | | | | | | | | | | | | | | | | | | | | | | | | | | | | | | | | | | | | | | |
| Common Stock | | Preferred Stock | | | | | | | | | | | | | | | | |
| Shares | | Amount | | Shares | | Amount | | Additional Paid-in Capital | | | | | | Cumulative Earnings | | Cumulative Distributions to Stockholders | | Total Stockholders’ Equity | | Non-controlling Interests | | Total Equity |
| | | | | | | | | | | | | | | | | | | | | | | |
| | | | | | | | | | | | | | | | | | | | | | | |
| | | | | | | | | | | | | | | | | | | | | | | |
| | | | | | | | | | | | | | | | | | | | | | | |
| | | | | | | | | | | | | | | | | | | | | | | |
| | | | | | | | | | | | | | | | | | | | | | | |
| | | | | | | | | | | | | | | | | | | | | | | |
| | | | | | | | | | | | | | | | | | | | | | | |
| | | | | | | | | | | | | | | | | | | | | | | |
| | | | | | | | | | | | | | | | | | | | | | | |
| | | | | | | | | | | | | | | | | | | | | | | |
| | | | | | | | | | | | | | | | | | | | | | | |
| | | | | | | | | | | | | | | | | | | | | | | |
| | | | | | | | | | | | | | | | | | | | | | | |
| | | | | | | | | | | | | | | | | | | | | | | |
| | | | | | | | | | | | | | | | | | | | | | | |
| | | | | | | | | | | | | | | | | | | | | | | |
| | | | | | | | | | | | | | | | | | | | | | | |
| | | | | | | | | | | | | | | | | | | | | | | |
| | | | | | | | | | | | | | | | | | | | | | | |
| | | | | | | | | | | | | | | | | | | | | | | |
| | | | | | | | | | | | | | | | | | | | | | | |
| | | | | | | | | | | | | | | | | | | | | | | |
| | | | | | | | | | | | | | | | | | | | | | | |
| | | | | | | | | | | | | | | | | | | | | | | |
| | | | | | | | | | | | | | | | | | | | | | | |
| | | | | | | | | | | | | | | | | | | | | | | |
| | | | | | | | | | | | | | | | | | | | | | | |
| | | | | | | | | | | | | | | | | | | | | | | |
| | | | | | | | | | | | | | | | | | | | | | | |
| | | | | | | | | | | | | | | | | | | | | | | |
| | | | | | | | | | | | | | | | | | | | | | | |
| | | | | | | | | | | | | | | | | | | | | | | |
| | | | | | | | | | | | | | | | | | | | | | | |
| | | | | | | | | | | | | | | | | | | | | | | |
| | | | | | | | | | | | | | | | | | | | | | | |
| | | | | | | | | | | | | | | | | | | | | | | |
| | | | | | | | | | | | | | | | | | | | | | | |
| | | | | | | | | | | | | | | | | | | | | | | |
| | | | | | | | | | | | | | | | | | | | | | | |
| | | | | | | | | | | | | | | | | | | | | | | |
| | | | | | | | | | | | | | | | | | | | | | | |
| | | | | | | | | | | | | | | | | | | | | | | |
| | | | | | | | | | | | | | | | | | | | | | | |
| | | | | | | | | | | | | | | | | | | | | | | |
| | | | | | | | | | | | | | | | | | | | | | | |
| | | | | | | | | | | | | | | | | | | | | | | |
| | | | | | | | | | | | | | | | | | | | | | | |
| | | | | | | | | | | | | | | | | | | | | | | |
| | | | | | | | | | | | | | | | | | | | | | | |
| Balance, December 31, 2021 | 53,789,465 | | | 538 | | | 4,596,500 | | | 46 | | | 1,125,241 | | | | | | | 171,518 | | | (284,285) | | | 1,013,058 | | | 125 | | | 1,013,183 | |
| Net income | — | | | — | | | — | | | — | | | — | | | | | | | 4,636 | | | — | | | 4,636 | | | — | | | 4,636 | |
| | | | | | | | | | | | | | | | | | | | | | | |
| Issuance of preferred stock, net of offering costs | — | | | | | 3,633,000 | | | 36 | | | 87,485 | | | | | | | — | | | — | | | 87,521 | | | — | | | 87,521 | |
| Restricted stock forfeiture | (69,039) | | | — | | | — | | | — | | | (824) | | | | | | | — | | | — | | | (824) | | | — | | | (824) | |
| Restricted Stock Unit (RSU) forfeiture | — | | | — | | | — | | | — | | | (798) | | | | | | | — | | | — | | | (798) | | | — | | | (798) | |
Preferred dividends declared, $25.00 per share | — | | | — | | | — | | | — | | | — | | | | | | | — | | | (25) | | | (25) | | | — | | | (25) | |
Preferred dividends declared, $0.4375 per share | — | | | — | | | — | | | — | | | — | | | | | | | — | | | (3,600) | | | (3,600) | | | — | | | (3,600) | |
Common dividends declared, $0.25 per share | — | | | — | | | — | | | — | | | — | | | | | | | — | | | (13,770) | | | (13,770) | | | — | | | (13,770) | |
| | | | | | | | | | | | | | | | | | | | | | | |
| | | | | | | | | | | | | | | | | | | | | | | |
| | | | | | | | | | | | | | | | | | | | | | | |
| Non-cash equity award compensation | 135,151 | | | 1 | | | — | | | — | | | 2,170 | | | | | | | — | | | — | | | 2,171 | | | — | | | 2,171 | |
| Balance, March 31, 2022 | 53,855,577 | | | 539 | | | 8,229,500 | | | 82 | | | 1,213,274 | | | | | | | 176,154 | | | (301,680) | | | 1,088,369 | | | 125 | | | 1,088,494 | |
| | | | | | | | | | | | | | | | | | | | | | | |
| | | | | | | | | | | | | | | | | | | | | | | |
| | | | | | | | | | | | | | | | | | | | | | | |
| | | | | | | | | | | | | | | | | | | | | | | |
| | | | | | | | | | | | | | | | | | | | | | | |
| | | | | | | | | | | | | | | | | | | | | | | |
| | | | | | | | | | | | | | | | | | | | | | | |
| | | | | | | | | | | | | | | | | | | | | | | |
| | | | | | | | | | | | | | | | | | | | | | | |
| | | | | | | | | | | | | | | | | | | | | | | |
| | | | | | | | | | | | | | | | | | | | | | | |
| | | | | | | | | | | | | | | | | | | | | | | |
| | | | | | | | | | | | | | | | | | | | | | | |
| | | | | | | | | | | | | | | | | | | | | | | |
| | | | | | | | | | | | | | | | | | | | | | | |
| | | | | | | | | | | | | | | | | | | | | | | |
| | | | | | | | | | | | | | | | | | | | | | | |
| | | | | | | | | | | | | | | | | | | | | | | |
| | | | | | | | | | | | | | | | | | | | | | | |
| | | | | | | | | | | | | | | | | | | | | | | |
| | | | | | | | | | | | | | | | | | | | | | | |
| | | | | | | | | | | | | | | | | | | | | | | |
| | | | | | | | | | | | | | | | | | | | | | | |
| | | | | | | | | | | | | | | | | | | | | | | |
| | | | | | | | | | | | | | | | | | | | | | | |
| | | | | | | | | | | | | | | | | | | | | | | |
| | | | | | | | | | | | | | | | | | | | | | | |
| | | | | | | | | | | | | | | | | | | | | | | |
| Balance, December 31, 2022 | 52,350,989 | | | 524 | | | 8,229,500 | | | 82 | | | 1,202,315 | | | | | | | 130,693 | | | (350,069) | | | 983,545 | | | 125 | | | 983,670 | |
| Net (loss) income | — | | | — | | | — | | | — | | | — | | | | | | | (33,829) | | | — | | | (33,829) | | | — | | | (33,829) | |
| | | | | | | | | | | | | | | | | | | | | | | |
| Repurchase of common stock | (1,001,338) | | | (10) | | | — | | | — | | | (5,108) | | | | | | | — | | | — | | | (5,118) | | | — | | | (5,118) | |
| Restricted stock forfeiture | (36,916) | | | (1) | | | — | | | — | | | (236) | | | | | | | — | | | — | | | (237) | | | — | | | (237) | |
| Restricted Stock Unit (RSU) forfeiture | — | | | — | | | — | | | — | | | (652) | | | | | | | — | | | — | | | (652) | | | — | | | (652) | |
Preferred dividends declared, $25.00 per share | — | | | — | | | — | | | — | | | — | | | | | | | — | | | (25) | | | (25) | | | — | | | (25) | |
Preferred dividends declared, $0.4375 per share | — | | | — | | | — | | | — | | | — | | | | | | | — | | | (3,600) | | | (3,600) | | | — | | | (3,600) | |
Common dividends declared, $0.20 per share | — | | | — | | | — | | | — | | | — | | | | | | | — | | | (10,706) | | | (10,706) | | | — | | | (10,706) | |
| | | | | | | | | | | | | | | | | | | | | | | |
| Non-cash equity award compensation | 213,304 | | | 2 | | | — | | | — | | | 1,953 | | | | | | | — | | | — | | | 1,955 | | | — | | | 1,955 | |
| Balance, March 31, 2023 | 51,526,039 | | | 515 | | | 8,229,500 | | | 82 | | | 1,198,272 | | | | | | | 96,864 | | | (364,400) | | | 931,333 | | | 125 | | | 931,458 | |
The accompanying notes are an integral part of these condensed consolidated financial statements.
GRANITE POINT MORTGAGE TRUST INC.
CONDENSED CONSOLIDATED STATEMENTS OF CASH FLOWS (in thousands) | | | | | | | | | | | | | | |
| | Three Months Ended |
| | March 31, |
| | 2023 | | 2022 | | |
| Cash Flows From Operating Activities: | | | |
| Net (loss) income | $ | (33,829) | | | $ | 4,636 | | | |
| Adjustments to reconcile net (loss) income to net cash provided by operating activities: | | | | | |
| Accretion of discounts and net deferred fees on loans held-for-investment and deferred interest capitalized to loans held-for-investment | (3,425) | | | (4,531) | | | |
| Amortization of deferred debt issuance costs | 2,155 | | | 3,839 | | | |
| Provision for credit losses | 46,410 | | | 3,688 | | | |
| (Gain) loss on extinguishment of debt | (274) | | | 3,291 | | | |
| | | | | | |
| | | | | | |
| | | | | | |
| | | | | | |
| | | | | | |
| | | | | | |
| Amortization of equity-based compensation | 1,955 | | | 2,171 | | | |
| Proceeds received from deferred interest capitalized on loans held-for-investment | — | | | 284 | | | |
| Net change in assets and liabilities: | | | | | |
| (Increase) decrease in accrued interest receivable | (456) | | | (426) | | | |
| | | | | | |
| | | | | | |
| | | | | | |
| Decrease (increase) in other assets | 2,276 | | | 542 | | | |
| | | | | | |
| | | | | | |
| | | | | | |
| | | | | | |
| Increase (decrease) in other liabilities | (4,348) | | | (265) | | | |
| | | | | | |
| Net cash provided by operating activities | 10,464 | | | 13,229 | | | |
| Cash Flows From Investing Activities: | | | | | |
| Originations, acquisitions and additional fundings of loans held-for-investment, net of deferred fees | (16,706) | | | (170,091) | | | |
| Proceeds from loan sales | — | | | 43,714 | | | |
| Proceeds from repayment of loans held-for-investment | 59,450 | | | 118,098 | | | |
| | | | | | |
| | | | | | |
| | | | | | |
| | | | | | |
| Increase in other assets, due from servicer on repayments of loans held-for-investment | (23,236) | | | (570) | | | |
| | | | | | |
| | | | | | |
| | | | | | |
| | | | | | |
| | | | | | |
| | | | | | |
| | | | | | |
| | | | | | |
| Net cash provided by (used in) investing activities | 19,508 | | | (8,849) | | | |
| | | | | | |
| Cash Flows From Financing Activities: | | | | | |
| Proceeds from repurchase facilities | 370,419 | | | 108,429 | | | |
| Principal payments on repurchase facilities | (194,414) | | | (37,159) | | | |
| | | | | | |
| Principal payments on securitized debt obligations | (99,300) | | | (47,267) | | | |
| | | | | | |
| Repayment of senior secured term loan facilities | — | | | (50,000) | | | |
| Proceeds from asset-specific financings | 911 | | | — | | | |
| | | | | | |
| | | | | | |
| | | | | | |
| | | | | | |
| | | | | | |
| | | | | | |
| | | | | | |
| | | | | | |
| | | | | | |
| Payment of debt issuance costs | (627) | | | (35) | | | |
| | | | | | |
| | | | | | |
| | | | | | |
| Proceeds from issuance of preferred stock, net of offering costs | — | | | 87,521 | | | |
| | | | | | |
| | | | | | |
| | | | | | |
| Tax withholding on restricted stock and RSUs | (889) | | | (1,622) | | | |
| Repurchase of common stock | (5,118) | | | — | | | |
| Dividends paid on preferred stock | (3,625) | | | (718) | | | |
| Dividends paid on common stock | (10,718) | | | (13,688) | | | |
| Net cash provided by (used in) financing activities | 56,639 | | | 45,461 | | | |
| Net increase (decrease) in cash, cash equivalents and restricted cash | 86,611 | | | 49,841 | | | |
| Cash, cash equivalents, and restricted cash at beginning of period | 140,165 | | | 204,293 | | | |
| Cash, cash equivalents, and restricted cash at end of period | $ | 226,776 | | | $ | 254,134 | | | |
| Supplemental Disclosure of Cash Flow Information: | | | | | |
| Cash paid for interest | $ | 44,689 | | | $ | 19,347 | | | |
| Cash paid for taxes | $ | 5 | | | $ | 291 | | | |
| Noncash Activities: | | | | | |
| | | | | | |
| Dividends declared but not paid at end of period | $ | 14,307 | | | $ | 17,395 | | | |
| Deferred financing costs, not yet paid | $ | 30 | | | $ | — | | | |
The accompanying notes are an integral part of these condensed consolidated financial statements.
GRANITE POINT MORTGAGE TRUST INC.
Notes to the Condensed Consolidated Financial Statements
Note 1. Organization and Operations
Granite Point Mortgage Trust Inc., or the Company, is an internally managed real estate finance company that focuses primarily on directly originating, investing in and managing senior floating-rate commercial mortgage loans and other debt and debt-like commercial real estate investments. These investments are capitalized by accessing a variety of funding sources, including borrowing under the Company’s bank credit facilities or other asset-specific financings, issuing commercial real estate collateralized loan obligations, or CRE CLOs, and issuing other forms of secured and unsecured debt and equity securities, depending on market conditions and the Company’s view of the most appropriate funding option available for the Company’s investments. The Company is not in the business of buying or trading securities, and the only securities it owns are the retained interests from its CRE CLOs. The Company’s investment objective is to preserve the Company’s stockholders’ capital while generating attractive risk-adjusted returns over the long term, primarily through dividends derived from current income produced by the Company’s investment portfolio. The Company’s common stock is listed on the NYSE under the symbol “GPMT”. The Company operates its business in a manner that is intended to permit it to maintain its exclusion from registration under the Investment Company Act of 1940, or the Investment Company Act. The Company operates its business as one segment. The Company was incorporated in Maryland on April 7, 2017, and commenced operations as a publicly traded company on June 28, 2017.
The Company has elected to be treated as a real estate investment trust, or REIT, as defined under the Internal Revenue Code of 1986, as amended, or the Code, for U.S. federal income tax purposes. As long as the Company continues to comply with a number of requirements under federal tax law and maintains its qualification as a REIT, the Company generally will not be subject to U.S. federal income taxes to the extent that the Company distributes its taxable income to its stockholders on an annual basis and does not engage in prohibited transactions. However, certain activities that the Company may perform may cause it to earn income which will not be qualifying income for REIT purposes. The Company has designated one of its subsidiaries as a taxable REIT subsidiary, or TRS, as defined in the Code, to engage in such activities.
Note 2. Basis of Presentation and Significant Accounting Policies
Consolidation and Basis of Presentation
The interim unaudited condensed consolidated financial statements of the Company have been prepared in accordance with the rules and regulations of the Securities and Exchange Commission, or SEC. Certain information and note disclosures normally included in financial statements prepared in accordance with U.S. generally accepted accounting principles, or U.S. GAAP, have been condensed or omitted according to such SEC rules and regulations. However, management believes that the disclosures included in these interim condensed consolidated financial statements are adequate to make the information presented not misleading. The accompanying unaudited condensed consolidated financial statements should be read in conjunction with the financial statements and notes thereto included in the Company’s Annual Report on Form 10-K for the year ended December 31, 2022. In the opinion of management, all normal and recurring adjustments necessary to present fairly the financial condition of the Company at March 31, 2023, and results of operations for all periods presented have been made. The results of operations for the three months ended March 31, 2023, should not be construed as indicative of the results to be expected for future periods or the full year.
The unaudited condensed consolidated financial statements of the Company include the accounts of all subsidiaries; inter-company accounts and transactions have been eliminated. Certain prior period amounts have been reclassified to conform to the current period presentation.
All entities in which the Company holds investments that are considered variable interest entities, or VIEs, for financial reporting purposes were reviewed for consolidation under the applicable consolidation guidance. Whenever the Company has both the power to direct the activities of an entity that most significantly impact the entity’s performance, and the obligation to absorb losses or the right to receive benefits of the entity that could be significant, the Company consolidates the entity.
Use of Estimates
The preparation of financial statements in conformity with GAAP requires management to make a number of significant estimates. These include estimates of amount and timing of allowances for credit losses, fair value of certain assets and liabilities, and other estimates that affect the reported amounts of certain assets and liabilities as of the date of the condensed consolidated financial statements and the reported amounts of certain revenues and expenses during the reported period. It is likely that changes in these estimates (e.g., valuation changes to the underlying collateral of loans due to changes in market interest and capitalization rates, leasing, credit worthiness of major tenants, occupancy rates, availability of financing, exit plan, loan sponsorship, actions of other lenders, overall economic and capital markets conditions, the broader commercial real estate market, local geographic sub-markets or other factors) will occur in the near term.
GRANITE POINT MORTGAGE TRUST INC.
Notes to the Condensed Consolidated Financial Statements
The Company believes the estimates and assumptions underlying its condensed consolidated financial statements are reasonable and supportable based on the information available as of March 31, 2023. However, the Company’s actual results could ultimately differ from its estimates and such differences may be material.
Significant Accounting Policies
Included in Note 2 to the Consolidated Financial Statements of the Company’s Annual Report on Form 10-K for the year ended December 31, 2022, is a summary of the Company’s significant accounting policies. Provided below is a summary of additional accounting policies that are significant to the Company’s condensed consolidated financial condition and results of operations for the three months ended March 31, 2023.
Recently Issued and/or Adopted Accounting Standards
Financial Instruments-Credit Losses (Topic 326): Troubled Debt Restructurings and Vintage Disclosures
In March 2022, the Financial Accounting Standards Board, or FASB, issued Accounting Standards Update, or ASU, 2022-02, Financial Instruments – Credit Losses (Topic 326): Troubled Debt Restructurings and Vintage Disclosures, or ASU 2022-02. The new guidance is based on whether a modification or restructuring with a borrower experiencing financial difficulty results in principal forgiveness, an interest rate reduction, a significant payment delay or term extension as opposed to simply a concession. The new guidance requires disclosure by class of financing receivables, of the types of modifications, the financial effects of those modifications and the performance of those modified receivables in the last twelve months. As it relates to ASC 326-20, the Company is now allowed to use any acceptable method to determine credit losses as a result of modification or restructuring with a borrower experiencing financial difficulty. ASU 2022-02 also requires disclosure of gross write-offs recorded in the current period, on a year-to-date basis, and by year of origination in the vintage disclosures. On January 1, 2023, the Company adopted ASU 2022-02 on a prospective basis and the adoption did not have a material impact on the Company’s condensed consolidated financial statements.
Facilitation of the Effects of Reference Rate Reform on Financial Reporting
In March 2020, FASB issued ASU No. 2020-04, Reference Rate Reform (Topic 848): Facilitation of the Effects of Reference Rate Reform on Financial Reporting, or ASU No. 2020-04, which provides optional expedients and exceptions for applying GAAP to debt instruments, derivatives, and other contracts that reference the London Interbank Offered Rate, or LIBOR, or other reference rates expected to be discontinued as a result of reference rate reform. In January 2021, the FASB issued ASU No. 2021-01, Reference Rate Reform (Topic 848), to clarify that certain optional expedients and exceptions in Topic 848 for contract modifications and hedge accounting apply to derivative instruments that use an interest rate for margining, discounting, or contract price alignment that is modified as a result of reference rate reform. ASU No. 2020-04 and ASU No. 2021-01 are effective for all entities and may be adopted retrospectively as of any date from the beginning of any interim period that includes or is subsequent to March 12, 2020. In December 2022, the FASB issued ASU No. 2022-06, Reference Rate Reform (Topic 848) to defer the sunset date of Topic 848 from December 31, 2022, to December 31, 2024. The Company has loan agreements and debt agreements that incorporate LIBOR as a referenced interest rate. It is difficult to predict the ultimate impacts of the phase-out of LIBOR and the use of alternative benchmarks, such as the Secured Overnight Financing Rate, or SOFR (a new index calculated by short-term repurchase agreements, backed by Treasury securities), on the Company’s business or on the overall financial markets. The Company has not adopted any of the optional expedients or exceptions through March 31, 2023, but will continue to evaluate the possible adoption of any such expedients or exceptions during the effective period as circumstances evolve.
Note 3. Loans Held-for-Investment, Net of Allowance for Credit Losses
The Company originates and acquires commercial real estate debt and related instruments generally to be held as long-term investments. These assets are classified as “loans held-for-investment” on the condensed consolidated balance sheets. Loans held-for-investment are reported at cost, net of any unamortized acquisition premiums or discounts, loan fees, origination costs and allowance for credit losses, as applicable.
GRANITE POINT MORTGAGE TRUST INC.
Notes to the Condensed Consolidated Financial Statements
The following tables summarize the Company’s loans held-for-investment by asset type, property type and geographic location as of March 31, 2023, and December 31, 2022:
| | | | | | | | | | | | | | | | | | | |
| March 31, 2023 |
| (dollars in thousands) | Senior Loans (1) | | | | B-Notes | | Total |
| Unpaid principal balance | $ | 3,307,063 | | | | | $ | 13,698 | | | $ | 3,320,761 | |
Unamortized (discount) premium | (35) | | | | | — | | | (35) | |
Unamortized net deferred origination fees | (9,896) | | | | | — | | | (9,896) | |
| Allowance for credit losses | (127,932) | | | | | (519) | | | (128,451) | |
| Carrying value | $ | 3,169,200 | | | | | $ | 13,179 | | | $ | 3,182,379 | |
| Unfunded commitments | $ | 204,511 | | | | | $ | — | | | $ | 204,511 | |
| Number of loans | 87 | | | | | 1 | | | 88 | |
| Weighted average coupon | 7.7 | % | | | | 8.0 | % | | 7.7 | % |
Weighted average years to maturity (2) | 0.9 | | | | 3.8 | | 0.9 |
| | | | | | | | | | | | | | | | | | | |
| December 31, 2022 |
| (dollars in thousands) | Senior Loans (1) | | | | B-Notes | | Total |
| Unpaid principal balance | $ | 3,348,242 | | | | | $ | 13,764 | | | $ | 3,362,006 | |
Unamortized (discount) premium | (48) | | | | | — | | | (48) | |
Unamortized net deferred origination fees | (11,808) | | | | | — | | | (11,808) | |
| Allowance for credit losses | (81,768) | | | | | (567) | | | (82,335) | |
| Carrying value | $ | 3,254,618 | | | | | $ | 13,197 | | | $ | 3,267,815 | |
| Unfunded commitments | $ | 229,607 | | | | | $ | — | | | $ | 229,607 | |
| Number of loans | 89 | | | | | 1 | | | 90 | |
| Weighted average coupon | 6.3 | % | | | | 8.0 | % | | 6.3 | % |
Weighted average years to maturity (2) | 1.0 | | | | 4.1 | | 1.0 |
____________________
(1)Loans primarily secured by a first priority lien on commercial real property and related personal property and also includes, when applicable, any companion subordinate loans.
(2)Based on contractual maturity date. Certain loans are subject to contractual extension options with such conditions stipulated in the applicable loan documents. Actual maturities may differ from contractual maturities stated herein as certain borrowers may have the right to prepay with or without paying a prepayment fee. The Company may also extend contractual maturities in connection with certain loan modifications.
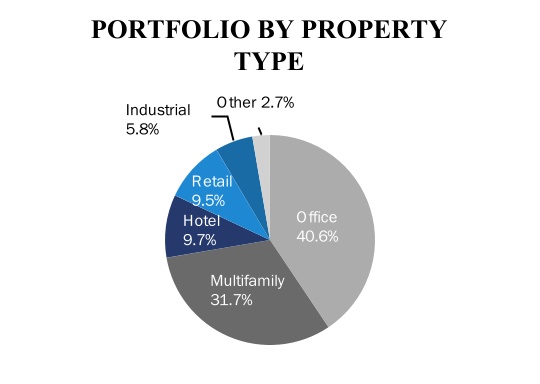
| | | | | | | | | | | | | | | | | | | | | | | | | | |
| (dollars in thousands) | | March 31, 2023 | | December 31, 2022 |
| Property Type | | Carrying Value | | % of Loan Portfolio | | Carrying Value | | % of Loan Portfolio |
| Office | | $ | 1,290,627 | | | 40.6 | % | | $ | 1,348,205 | | | 41.3 | % |
| Multifamily | | 1,010,054 | | | 31.7 | % | | 1,008,177 | | | 30.9 | % |
| Hotel | | 309,306 | | | 9.7 | % | | 337,264 | | | 10.3 | % |
| Retail | | 301,009 | | | 9.5 | % | | 303,266 | | | 9.3 | % |
| Industrial | | 185,387 | | | 5.8 | % | | 185,337 | | | 5.6 | % |
| Other | | 85,996 | | | 2.7 | % | | 85,566 | | | 2.6 | % |
| Total | | $ | 3,182,379 | | | 100.0 | % | | $ | 3,267,815 | | | 100.0 | % |
GRANITE POINT MORTGAGE TRUST INC.
Notes to the Condensed Consolidated Financial Statements
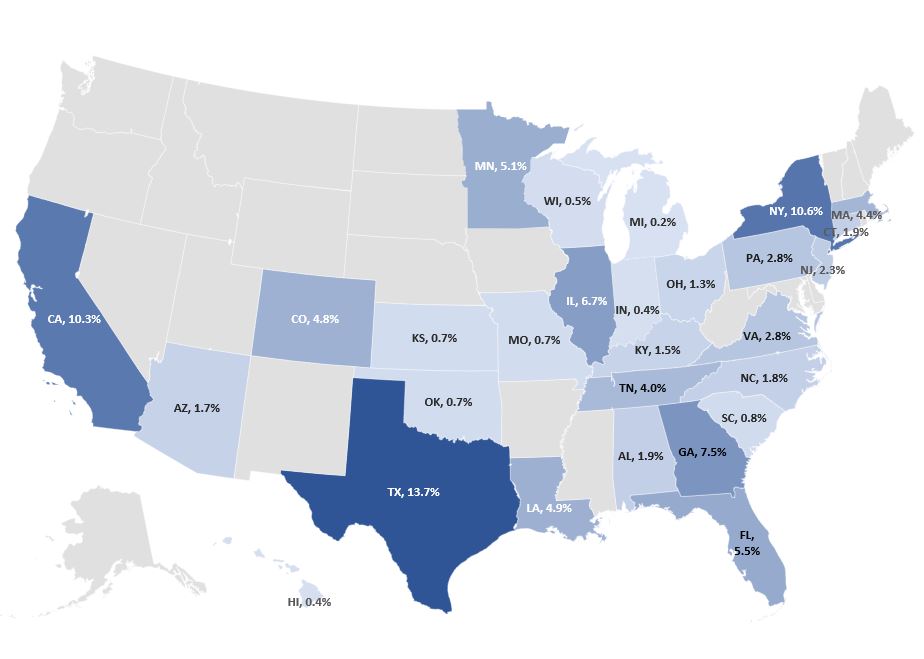
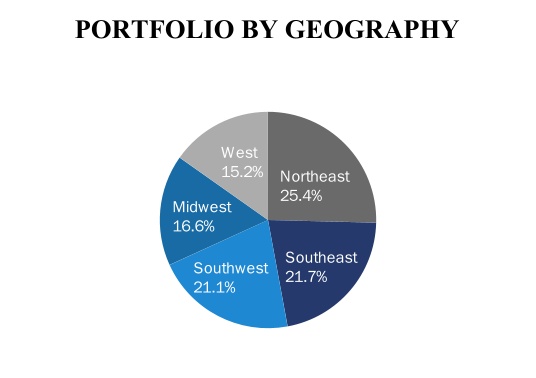
| | | | | | | | | | | | | | | | | | | | | | | | | | |
| (dollars in thousands) | | March 31, 2023 | | December 31, 2022 |
| Geographic Location | | Carrying Value | | % of Loan Portfolio | | Carrying Value | | % of Loan Portfolio |
| Northeast | | $ | 806,427 | | | 25.4 | % | | $ | 834,985 | | | 25.5 | % |
| Southwest | | 671,149 | | | 21.1 | % | | 675,288 | | | 20.7 | % |
| West | | 484,697 | | | 15.2 | % | | 519,244 | | | 15.9 | % |
| Midwest | | 528,272 | | | 16.6 | % | | 546,030 | | | 16.7 | % |
| Southeast | | 691,834 | | | 21.7 | % | | 692,268 | | | 21.2 | % |
| | | | | | | | |
| Total | | $ | 3,182,379 | | | 100.0 | % | | $ | 3,267,815 | | | 100.0 | % |
At March 31, 2023, and December 31, 2022, loans held-for-investment with a carrying value, net of allowance for credit losses, of $3.2 billion and $3.2 billion, respectively, collateralized the Company’s secured financing agreements and CRE CLOs. See Note 4 - Variable Interest Entities and Securitized Debt Obligations and Note 5 - Secured Financing Agreements.
The following table summarizes activity related to loans held-for-investment, net of allowance for credit losses, for the three months ended March 31, 2023, and 2022:
| | | | | | | | | | | | | | | | |
| | Three Months Ended March 31, |
| (in thousands) | | 2023 | | 2022 | | |
| Balance at beginning of period | | $ | 3,267,815 | | | 3,741,308 | | | |
| Originations, additional fundings, upsizing of loans and capitalized deferred interest | | 18,205 | | | 172,865 | | | |
| | | | | | |
| Repayments | | (59,450) | | | (118,383) | | | |
| Loan sales | | — | | | (43,714) | | | |
| Net discount accretion (premium amortization) | | 13 | | | 9 | | | |
| Increase in net deferred origination fees | | (619) | | | (2,240) | | | |
| Amortization of net deferred origination fees | | 2,531 | | | 3,989 | | | |
| | | | | | |
| (Provision for) benefit from credit losses | | (46,116) | | | (3,364) | | | |
| Balance at end of period | | $ | 3,182,379 | | | $ | 3,750,470 | | | |
Allowance for Credit Losses
To estimate and recognize an allowance for credit losses on loans held-for-investment and the related unfunded commitments, the Company continues to use a third-party licensed probability-weighted analytical model. The Company employs quarterly updated macroeconomic forecasts, which reflect expectations for overall economic output, unemployment rates, interest rates, values of real estate properties and other factors, including the lagging effects of the pandemic, geopolitical and banking system instability, the Federal Reserve monetary policy impacts on the overall U.S. economy, and commercial real estate markets generally. Significant inputs to the Company’s estimate of the allowance for credit losses include loan-specific factors such as debt-service coverage ratio, or DSCR, loan-to-value ratio, or LTV, remaining contractual loan term, property type and others. Additionally, there are a number of significant assumptions and qualitative factors included when determining the Company’s estimates, including, but not limited to, macroeconomic conditions and general portfolio trends. As part of the quarterly review of the portfolio, the Company assesses the expected repayment date of each loan, which is used to determine the contractual term for purposes of computing the current expected credit loss, or CECL, reserve. In certain instances, for loans with unique risk and credit characteristics, the Company may instead elect to employ different methods to estimate an allowance for credit losses.
As of March 31, 2023, the Company recognized an allowance for credit losses related to its loans held-for-investment of $128.5 million, which reflects a provision for credit losses of $46.1 million for the three months ended March 31, 2023. The increase in the Company’s allowance for credit losses was impacted by an increasingly uncertain macroeconomic outlook which includes weakening in credit fundamentals, global market volatility, reduced liquidity in the capital markets especially for certain property types such as office assets located in underperforming markets, and inflationary expectations resulting in meaningfully higher interest rates, and uncertainty with respect to the geopolitical environment. The increase in the Company’s CECL reserve was primarily driven by recording an increase in the allowance for collateral-dependent loans during the three months ended March 31, 2023, that were individually assessed in accordance with ASU 2016-13. The collateral properties securing these loans have been affected by the above factors, resulting in slowing of business plan execution and reduced market liquidity impacting the borrowers’ ability to either sell or refinance their properties.
GRANITE POINT MORTGAGE TRUST INC.
Notes to the Condensed Consolidated Financial Statements
As of March 31, 2023, the Company had five collateral-dependent loans with an aggregate principal balance of $274.8 million, for which the Company recorded an allowance for credit losses of $67.5 million. Four collateral-dependent loans were first mortgage loans secured by office properties and one first mortgage loan secured by a hotel property, each of which were individually assessed in accordance with ASU 2016-13 during the three months ended March 31, 2023. See Note 9 - Fair Value, for further detail. The remaining increase in the Company’s allowance for credit losses was mainly related to implementing in its analysis more conservative macroeconomic forecasts including more emphasis on recessionary scenarios driven by the factors discussed above.
The allowance for credit losses related to the Company’s loans held-for-investment is deducted from the amortized cost basis of related loans, while the allowance for credit losses related to off-balance sheet unfunded commitments on existing loans is recorded as a component of other liabilities on the Company’s condensed consolidated balance sheets. As of March 31, 2023, the Company recognized $4.5 million in other liabilities related to the allowance for credit losses on unfunded commitments and recorded a provision for credit losses of $0.3 million for the three months ended March 31, 2023. Changes in the provision for credit losses for both loans held-for-investment and their related unfunded commitments are recognized through net (loss) income on the Company’s condensed consolidated statements of comprehensive income.
The following table presents the changes for the three months ended March 31, 2023, and 2022 in the allowance for credit losses on loans held-for-investment:
| | | | | | | | | | | | | | | | |
| | Three Months Ended March 31, |
| (in thousands) | | 2023 | | 2022 | | |
| Balance at beginning of period | | $ | 82,335 | | | $ | 40,897 | | | |
| Provision for (benefit from) credit losses | | 46,116 | | | 3,364 | | | |
| Write-off | | — | | | (10,107) | | | |
| | | | | | |
| Balance at end of period | | $ | 128,451 | | | $ | 34,154 | | | |
During the three months ended March 31, 2023, one first mortgage loan with a principal balance of $27.5 million collateralized by a hotel property was downgraded to a risk rating of “5” as a result of the collateral property’s operating performance being adversely affected by the lagging travel trends impacting the local hotel occupancy rates, capital markets volatility and other factors (see “Loan Risk Ratings” below). The Company held this loan on nonaccrual status as of March 31, 2023.
Generally, loans held-for-investment are placed on nonaccrual status when delinquent for more than 90 days or earlier when determined not to be probable of full collection. Interest income recognition is suspended when loans are placed on nonaccrual status. As of March 31, 2023, the Company has five senior loans with a total unpaid principal balance of $274.8 million and carrying value of $207.2 million that are held on nonaccrual status. No other loans were considered past due, and no other loans were held on nonaccrual status as of March 31, 2023.
The following table presents the carrying value of loans held-for-investment on nonaccrual status for the three months ended March 31, 2023, and 2022:
| | | | | | | | | | | | | | | | | | |
| | Three Months Ended March 31, |
| (in thousands) | | 2023 | | 2022 | | | | |
| Nonaccrual loan carrying value at beginning of period | | $ | 207,958 | | | $ | 145,370 | | | | | |
| Addition of nonaccrual loan carrying value | | $ | 23,270 | | | $ | 11 | | | | | |
| Reduction of nonaccrual loan carrying value | | $ | (23,994) | | | $ | (45,854) | | | | | |
| Nonaccrual loan carrying value at end of period | | $ | 207,234 | | | $ | 99,527 | | | | | |
GRANITE POINT MORTGAGE TRUST INC.
Notes to the Condensed Consolidated Financial Statements
During the three months ended March 31, 2023, the $23.3 million addition of nonaccrual loan carrying value represents the addition of one nonaccrual first mortgage loan collateralized by a hotel property, as discussed above, and the $24.0 million reduction of nonaccrual loan carrying value represents the increase in provision for credit losses on loans previously held on nonaccrual status. During the three months ended March 31, 2022, the $45.9 million removal of nonaccrual loan carrying value was related to the resolution of one first mortgage collateralized by an office property.
The following tables summarize the aging analysis of accrued interest past due on the carrying value of the Company’s loans held-for-investment as of March 31, 2023, and December 31, 2022:
| | | | | | | | | | | | | | | | | | | | | | | | | | | | | | | | | | | | | | | | | | | | |
| (in thousands) | | Days Outstanding as of March 31, 2023 | | | | | | |
| | Current | | Days: 30-59 | | Days: 60-89 | | Days: 90 or more | | Total loans past due | | Total loans | | 90 days or more past due and accruing interest |
| Loans held-for-investment: | | | | | | | | | | | | | | |
| Senior loans | | $ | 2,961,966 | | | $ | 23,270 | | | $ | — | | | $ | 183,964 | | | $ | 207,234 | | | $ | 3,169,200 | | | $ | — | |
| Subordinated loans | | 13,179 | | | — | | | — | | | — | | | — | | | 13,179 | | | — | |
| Total | | $ | 2,975,145 | | | $ | 23,270 | | | $ | — | | | $ | 183,964 | | | $ | 207,234 | | | $ | 3,182,379 | | | $ | — | |
| | | | | | | | | | | | | | | | | | | | | | | | | | | | | | | | | | | | | | | | | | | | |
| (in thousands) | | Days Outstanding as of December 31, 2022 | | | | | | |
| | Current | | Days: 30-59 | | Days: 60-89 | | Days: 90 or more | | Total loans past due | | Total loans | | 90 days or more past due and accruing interest |
| Loans held-for-investment: | | | | | | | | | | | | | | |
| Senior loans | | $ | 3,072,536 | | | $ | — | | | $ | — | | | $ | 182,082 | | | $ | 182,082 | | | $ | 3,254,618 | | | $ | — | |
| Subordinated loans | | 13,197 | | | — | | | — | | | — | | | — | | | 13,197 | | | — | |
| Total | | $ | 3,085,733 | | | $ | — | | | $ | — | | | $ | 182,082 | | | $ | 182,082 | | | $ | 3,267,815 | | | $ | — | |
Loan Modifications
The Company may amend or modify a loan depending on the loan’s specific facts and circumstances. These loan modifications typically include additional time for the borrower to refinance or sell the collateral property, adjustment or waiver of performance tests that are prerequisite to the extension of a loan maturity, and/or deferral of scheduled principal payments. In exchange for a modification, the Company may receive a partial repayment of principal, a short-term accrual of capitalized interest for a portion of interest due, a cash infusion to replenish interest or capital improvement reserves, termination of all or a portion of the remaining unfunded loan commitment, additional call protection, and/or an increase in the loan coupon. For the three months ended March 31, 2023, none of the Company’s loan modifications resulted in a significant modification.
GRANITE POINT MORTGAGE TRUST INC.
Notes to the Condensed Consolidated Financial Statements
Loan Risk Ratings
The Company’s primary credit quality indicators are its risk ratings. The Company evaluates the credit quality of each loan at least quarterly by assessing the risk factors of each loan and assigning a risk rating based on a variety of factors. Risk factors include property type, geographic and local market dynamics, physical condition, leasing and tenant profile, projected cash flow, loan structure and exit plan, LTV, project sponsorship and other factors deemed necessary. Risk ratings are defined as follows:
1 –Lower Risk
2 –Average Risk
3 –Acceptable Risk
4 –Higher Risk: A loan that has exhibited material deterioration in cash flows and/or other credit factors, which, if negative trends continue, could be indicative of probability of principal loss.
5 –Loss Likely: A loan that has a significantly increased probability of principal loss.
The following table presents the number of loans, unpaid principal balance and carrying value by risk rating for loans held-for-investment as of March 31, 2023, and December 31, 2022:
| | | | | | | | | | | | | | | | | | | | | | | | | | | | | | | | | | | | | | |
| (dollars in thousands) | | March 31, 2023 | | December 31, 2022 |
| Risk Rating | | Number of Loans | | Unpaid Principal Balance | | Carrying Value | | Number of Loans | | Unpaid Principal Balance | | Carrying Value |
| 1 | | 7 | | | $ | 257,477 | | | $ | 252,307 | | | 8 | | | $ | 291,236 | | | $ | 287,527 | |
| 2 | | 48 | | | 1,706,949 | | | 1,676,839 | | | 52 | | | 1,857,744 | | | 1,824,564 | |
| 3 | | 24 | | | 839,453 | | | 818,533 | | | 21 | | | 697,532 | | | 689,196 | |
| 4 | | 4 | | | 242,124 | | | 227,466 | | | 5 | | | 268,236 | | | 258,570 | |
| 5 | | 5 | | | 274,758 | | | 207,234 | | | 4 | | | 247,258 | | | 207,958 | |
| Total | | 88 | | | $ | 3,320,761 | | | $ | 3,182,379 | | | 90 | | | $ | 3,362,006 | | | $ | 3,267,815 | |
As of March 31, 2023, the weighted average risk rating of the Company’s portfolio was 2.6, versus 2.5 as of December 31, 2022, weighted by unpaid principal balance. The portfolio risk rating was largely unchanged versus December 31, 2022, as changes in portfolio mix from the two payoffs and paydowns mostly offset select loan rating downgrades as of March 31, 2023.
The following table presents the carrying value of loans held-for-investment as of March 31, 2023, and December 31, 2022, by risk rating and year of origination:
| | | | | | | | | | | | | | | | | | | | | | | | | | | | | | | | | | | | | | | | | | | | | | | | | | |
| | March 31, 2023 |
| (dollars in thousands) | | Origination Year | | |
| Risk Rating | | 2023 | | 2022 | | 2021 | | 2020 | | 2019 | | 2018 | | Prior | | Total |
| 1 | | $ | — | | | $ | — | | | $ | — | | | $ | 42,936 | | | $ | 187,198 | | | $ | 22,173 | | | $ | — | | | $ | 252,307 | |
| 2 | | $ | — | | | $ | 423,939 | | | $ | 471,196 | | | $ | 93,523 | | | $ | 435,250 | | | $ | 167,193 | | | $ | 85,738 | | | $ | 1,676,839 | |
| 3 | | $ | — | | | $ | — | | | $ | 142,301 | | | $ | 16,955 | | | $ | 287,158 | | | $ | 156,869 | | | $ | 215,250 | | | $ | 818,533 | |
| 4 | | $ | — | | | $ | — | | | $ | — | | | $ | — | | | $ | — | | | $ | 110,149 | | | $ | 117,317 | | | $ | 227,466 | |
| 5 | | $ | — | | | $ | — | | | $ | — | | | $ | — | | | $ | 137,112 | | | $ | 23,270 | | | $ | 46,852 | | | $ | 207,234 | |
| Total | | $ | — | | | $ | 423,939 | | | $ | 613,497 | | | $ | 153,414 | | | $ | 1,046,718 | | | $ | 479,654 | | | $ | 465,157 | | | $ | 3,182,379 | |
| | | | | | | | | | | | | | | | |
| Gross write-offs | | $ | — | | | $ | — | | | $ | — | | | $ | — | | | $ | — | | | $ | — | | | $ | — | | | $ | — | |
GRANITE POINT MORTGAGE TRUST INC.
Notes to the Condensed Consolidated Financial Statements
| | | | | | | | | | | | | | | | | | | | | | | | | | | | | | | | | | | | | | | | | | | | | | | | | | |
| | December 31, 2022 |
| (dollars in thousands) | | Origination Year | | |
| Risk Rating | | 2022 | | 2021 | | 2020 | | 2019 | | 2018 | | 2017 | | Prior | | Total |
| 1 | | — | | | — | | | 44,141 | | | 186,506 | | | 56,880 | | | — | | | — | | | $ | 287,527 | |
| 2 | | 419,617 | | | 512,526 | | | 95,560 | | | 516,723 | | | 193,900 | | | 13,196 | | | 73,042 | | | $ | 1,824,564 | |
| 3 | | — | | | 95,061 | | | 20,154 | | | 234,019 | | | 99,311 | | | 152,093 | | | 88,558 | | | $ | 689,196 | |
| 4 | | — | | | — | | | — | | | — | | | 135,782 | | | 43,381 | | | 79,407 | | | $ | 258,570 | |
| 5 | | — | | | — | | | — | | | 157,111 | | | — | | | 50,847 | | | — | | | $ | 207,958 | |
| Total | | $ | 419,617 | | | $ | 607,587 | | | $ | 159,855 | | | $ | 1,094,359 | | | $ | 485,873 | | | $ | 259,517 | | | $ | 241,007 | | | $ | 3,267,815 | |
| | | | | | | | | | | | | | | | |
| Gross write-offs | | $ | — | | | $ | — | | | $ | — | | | $ | — | | | $ | — | | | $ | — | | | $ | — | | | $ | — | |
Note 4. Variable Interest Entities and Securitized Debt Obligations
The Company finances pools of its commercial real estate loans through CRE CLOs, which are considered VIEs for financial reporting purposes, and, thus, are reviewed for consolidation under the applicable consolidation guidance. The Company has both the power to direct the activities of the CRE CLOs that most significantly impact the entities’ performance and the obligation to absorb losses or the right to receive benefits of the entities that could be significant; therefore, the Company consolidates the CRE CLOs.
The following table presents a summary of the assets and liabilities of all VIEs consolidated on the Company’s condensed consolidated balance sheets as of March 31, 2023, and December 31, 2022:
| | | | | | | | | | | |
| (in thousands) | March 31,
2023 | | December 31,
2022 |
| Loans held-for-investment | $ | 1,292,276 | | | $ | 1,557,731 | |
| Allowance for credit losses | (23,778) | | | (21,865) | |
| Loans held-for-investment, net | 1,268,498 | | | 1,535,866 | |
| | | |
| Restricted cash | 2,443 | | | 5,674 | |
| | | |
| Other assets | 9,619 | | | 10,396 | |
| Total Assets | $ | 1,280,560 | | | $ | 1,551,936 | |
| Securitized debt obligations | $ | 1,039,407 | | | $ | 1,138,749 | |
| | | |
| Other liabilities | 2,066 | | | 2,279 | |
| Total Liabilities | $ | 1,041,473 | | | $ | 1,141,028 | |
The securitized debt obligations issued by the CRE CLOs are recorded at outstanding principal, net of any unamortized deferred debt issuance costs, on the Company’s condensed consolidated balance sheets.
On March 16, 2023, the Company redeemed the GPMT 2019-FL2 CRE CLO, which at its redemption had $98.1 million of investment-grade bonds outstanding. The 11 loans or participation interests therein, with an aggregate principal balance of $269.3 million held by the trust, were refinanced in part by one of the Company’s existing secured financing facilities, which was upsized in connection therewith. As a result of the redemption, the Company realized a gain on early extinguishment of debt of approximately $0.3 million.
GRANITE POINT MORTGAGE TRUST INC.
Notes to the Condensed Consolidated Financial Statements
The following table details the Company’s CRE CLO securitized debt obligations:
| | | | | | | | | | | | | | | | | | | | | | | | | | | | | | | | | | | |
| (dollars in thousands) | March 31, 2023 | | December 31, 2022 |
| Securitized Debt Obligations | Principal Balance | | Carrying Value | | Wtd. Avg. Yield/Cost (1) | | Principal Balance | | Carrying Value | | Wtd. Avg. Yield/Cost (1) |
| GPMT 2021-FL4 CRE CLO | | | | | | | | | | | |
Collateral assets (2) | $ | 621,409 | | | $ | 608,049 | | | L+/S+3.7% | | $ | 621,409 | | | $ | 607,354 | | | L+/S+3.7% |
| Financing provided | 502,564 | | | 499,531 | | | L+1.7% | | 502,564 | | | 499,249 | | | L+1.7% |
| GPMT 2021-FL3 CRE CLO | | | | | | | | | | | |
Collateral assets (3) | 677,715 | | | 662,892 | | | L+/S+3.9% | | 677,715 | | | 669,279 | | | L+/S+3.9% |
| Financing provided | 539,876 | | | 539,876 | | | L+1.7% | | 539,876 | | | 539,892 | | | L+1.7% |
| GPMT 2019-FL2 CRE CLO | | | | | | | | | | | |
Collateral assets (4) | — | | | — | | | — | | | 270,498 | | | 264,907 | | | L+ 4.2% |
| Financing provided | — | | | — | | | — | | | 99,300 | | | 99,608 | | | L+ 2.7% |
| | | | | | | | | | | |
| | | | | | | | | | | |
| | | | | | | | | | | |
| Total | | | | | | | | | | | |
| Collateral assets | $ | 1,299,124 | | | $ | 1,270,941 | | | L+/S+3.8% | | $ | 1,569,622 | | | $ | 1,541,540 | | | L+/S+ 3.9% |
| Financing provided | $ | 1,042,440 | | | $ | 1,039,407 | | | L+1.7% | | $ | 1,141,740 | | | $ | 1,138,749 | | | L+ 1.8% |
| | | | | | | | | | | |
____________________
(1)Calculations of all-in yield on collateral assets at origination are based on a number of assumptions (some or all of which may not occur) and are expressed as monthly equivalent yields that include net origination fees and exit fees and exclude future fundings and any potential or completed loan amendments or modifications. Calculation of cost of funds is the weighted average coupon of the CRE CLO, exclusive of any CRE CLO issuance costs.
(2)No restricted cash is included as of March 31, 2023, or December 31, 2022. Yield on collateral assets is exclusive of restricted cash.
(3)Includes $2.4 million and $5.6 million of restricted cash as of March 31, 2023, and December 31, 2022, respectively. Yield on collateral assets is exclusive of restricted cash.
(4)During the three months ended March 31, 2023, the Company redeemed the GPMT 2019-FL2 CRE CLO. No restricted cash is included as of December 31, 2022. Yield on collateral assets is exclusive of restricted cash.
Note 5. Secured Financing Agreements
To finance its loans held-for-investment, the Company has a variety of secured financing arrangements with several counterparties, including repurchase facilities, an asset-specific financing facility and a secured credit facility. The Company’s repurchase facilities are collateralized by loans held-for-investment and certain cash balances. Although the transactions under repurchase facilities represent committed borrowings until maturity, other than with respect to the Company’s Centennial Bank repurchase facility, which provides financing on a non-mark-to-market basis, the other respective lenders retain the right to mark the underlying collateral to fair value. A reduction in the value of pledged assets due to collateral-specific credit events, or, with respect to a limited number of the Company’s repurchase facilities, capital market events, would require the Company to fund margin calls. The Company does not typically retain similar rights for the Company to make margin calls on its underlying borrowers as a result of a determination by the Company and/or its financing counterparty that there has been a decrease in the market value of the underlying pledged collateral.
The Company’s asset-specific financing and secured credit facilities are also collateralized by loans held-for-investment. Neither facility contains mark-to-market provisions and the asset-specific financing facility is generally term-matched to the underlying assets.
GRANITE POINT MORTGAGE TRUST INC.
Notes to the Condensed Consolidated Financial Statements
The following tables summarize details of the Company’s borrowings outstanding on its secured financing agreements as of March 31, 2023, and December 31, 2022:
| | | | | | | | | | | | | | | | | | | | | | | | | | | | | | | | | | | |
| March 31, 2023 |
| (dollars in thousands) | Maturity Date (1) | | Amount Outstanding | | Unused Capacity (2) | | Total Capacity | | Carrying Value of Collateral | | Weighted Average Borrowing Rate |
| Repurchase facilities: | | | | | | | | | | | |
Morgan Stanley Bank (3) | June 28, 2023 | | $ | 451,720 | | | $ | 148,280 | | | $ | 600,000 | | | $ | 609,241 | | | 7.4 | % |
Goldman Sachs Bank USA (4) | July 13, 2023 | | 67,749 | | | 182,251 | | | 250,000 | | | 93,119 | | | 7.1 | % |
| JPMorgan Chase Bank | June 28, 2024 | | 409,291 | | | 15,709 | | | 425,000 | | | 623,231 | | | 7.7 | % |
| Citibank | May 25, 2025 | | 256,021 | | | 243,979 | | | 500,000 | | | 343,227 | | | 6.7 | % |
| | | | | | | | | | | |
| | | | | | | | | | | |
Centennial Bank (5) | August 29, 2024 | | 6,790 | | | 143,210 | | | 150,000 | | | 23,971 | | | 9.8 | % |
| Total/Weighted Average | | | $ | 1,191,571 | | | $ | 733,429 | | | $ | 1,925,000 | | | $ | 1,692,789 | | | |
| | | | | | | | | | | |
Asset-specific financings | Term Matched | | $ | 45,823 | | | $ | 104,177 | | | $ | 150,000 | | | $ | 57,950 | | | 6.6 | % |
| | | | | | | | | | | |
| Secured credit facility | December 21, 2025 | | $ | 100,000 | | | — | | | $ | 100,000 | | | $ | 137,112 | | | 11.3 | % |
| | | | | | | | | | | |
| | | | | | | | | | | |
| | | | | | | | | | | | | | | | | | | | | | | | | | | | | | | | | | | |
| December 31, 2022 |
| (dollars in thousands) | Maturity Date (1) | | Amount Outstanding | | Unused Capacity (2) | | Total Capacity | | Carrying Value of Collateral | | Weighted Average Borrowing Rate |
| Repurchase facilities: | | | | | | | | | | | |
| Morgan Stanley Bank | June 28, 2023 | | $ | 494,250 | | | $ | 105,750 | | | $ | 600,000 | | | $ | 701,469 | | | 7.0 | % |
Goldman Sachs Bank USA (4) | July 13, 2023 | | 66,914 | | | 183,086 | | | 250,000 | | | 93,651 | | | 6.5 | % |
| JPMorgan Chase Bank | June 28, 2024 | | 132,438 | | | 217,562 | | | 350,000 | | | 211,841 | | | 6.7 | % |
| Citibank | May 25, 2025 | | 204,593 | | | 295,407 | | | 500,000 | | | 266,179 | | | 6.1 | % |
Wells Fargo Bank (6) | June 28, 2023 | | 71,091 | | | — | | | 71,091 | | | 111,154 | | | 6.3 | % |
Centennial Bank (5) | August 29, 2024 | | 46,280 | | | $ | 103,720 | | | $ | 150,000 | | | 101,844 | | | 9.3 | % |
| Total/Weighted Average | | | $ | 1,015,566 | | | $ | 905,525 | | | $ | 1,921,091 | | | $ | 1,486,138 | | | |
| | | | | | | | | | | |
Asset-specific financings | Term Matched | | $ | 44,913 | | | $ | 105,087 | | | $ | 150,000 | | | $ | 57,629 | | | 6.0 | % |
| Secured credit facility | December 21, 2025 | | $ | 100,000 | | | $ | — | | | $ | 100,000 | | | $ | 157,112 | | | 10.8 | % |
| | | | | | | | | | | |
____________________
(1)The facilities are set to mature on the stated maturity date, unless extended pursuant to their terms.
(2)Unused capacity is not committed as of March 31, 2023, and December 31, 2022.
(3)Subsequent to March 31, 2023, the Company entered into a modification of the facility to extend the maturity date to June 28, 2024, and adjust the total capacity to $475 million.
(4)As of March 31, 2023, and December 31, 2022, the Company retained options to increase the maximum facility capacity amount up to $350 million, subject to customary terms and conditions.
(5)As of March 31, 2023, and December 31, 2022, the Company retained options to increase the maximum facility capacity amount up to $200 million, subject to customary terms and conditions.
(6)During the three months ended March 31, 2023, the facility was terminated.
GRANITE POINT MORTGAGE TRUST INC.
Notes to the Condensed Consolidated Financial Statements
At March 31, 2023, and December 31, 2022, the Company’s borrowings outstanding on its secured financing facilities had contractual maturities as follows:
| | | | | | | | | | | | | | | | | | | | | | | | | | | | | |
| March 31, 2023 |
| (in thousands) | Repurchase Facilities | | Asset-Specific Financings (1) | | | | Secured Credit Facility | | | | | | Total Amount Outstanding |
| 2023 | $ | 519,469 | | | $ | 45,823 | | | | | $ | — | | | | | | | $ | 565,292 | |
| 2024 | 416,081 | | | — | | | | | — | | | | | | | 416,081 | |
| 2025 | 256,021 | | | — | | | | | 100,000 | | | | | | | 356,021 | |
| 2026 | — | | | — | | | | | — | | | | | | | — | |
| 2027 | — | | | — | | | | | — | | | | | | | — | |
| Thereafter | — | | | — | | | | | — | | | | | | | — | |
| Total | $ | 1,191,571 | | | $ | 45,823 | | | | | $ | 100,000 | | | | | | | $ | 1,337,394 | |
| | | | | | | | | | | | | | | | | | | | | | | | | |
| December 31, 2022 |
| (in thousands) | Repurchase Facilities | | Asset-Specific Financings (1) | | | | Secured Credit Facility | | Total Amount Outstanding |
| 2023 | $ | 632,255 | | | $ | 44,913 | | | | | $ | — | | | $ | 677,168 | |
| 2024 | 178,718 | | | — | | | | | — | | | 178,718 | |
| 2025 | 204,593 | | | — | | | | | 100,000 | | | 304,593 | |
| 2026 | — | | | — | | | | | — | | | — | |
| 2027 | — | | | — | | | | | — | | | — | |
| Thereafter | — | | | — | | | | | — | | | — | |
| Total | $ | 1,015,566 | | | $ | 44,913 | | | | | $ | 100,000 | | | $ | 1,160,479 | |
__________________(1)Maturity date is term matched to the corresponding loans.
(2)Amount outstanding includes unamortized debt issuance costs.
GRANITE POINT MORTGAGE TRUST INC.
Notes to the Condensed Consolidated Financial Statements
The following table summarizes certain characteristics of the Company’s repurchase facilities and counterparty concentration at March 31, 2023, and December 31, 2022:
| | | | | | | | | | | | | | | | | | | | | | | | | | | | | | | | | | | | | | | | | | | | | | | |
| March 31, 2023 | | December 31, 2022 |
| (dollars in thousands) | Amount Outstanding | | Net Counterparty Exposure (1) | | Percent of Equity | | Weighted Average Years to Maturity | | Amount Outstanding | | Net Counterparty Exposure (1) | | Percent of Equity | | Weighted Average Years to Maturity |
| Morgan Stanley Bank | $ | 451,720 | | | $ | 167,156 | | | 18 | % | | 0.24 | | $ | 494,250 | | | $ | 213,855 | | | 22 | % | | 0.49 |
| JPMorgan Chase Bank | 409,291 | | | 225,158 | | | 24 | % | | 1.25 | | 132,438 | | | 81,850 | | | 8 | % | | 1.49 |
| Goldman Sachs Bank USA | 67,749 | | | 27,030 | | | 3 | % | | 0.29 | | 66,914 | | | 27,594 | | | 3 | % | | 0.53 |
| Citibank | 256,021 | | | 89,425 | | | 10 | % | | 2.16 | | 204,593 | | | 63,924 | | | 6 | % | | 2.40 |
| Wells Fargo Bank | — | | | — | | | — | % | | 0.00 | | 71,091 | | | 42,447 | | | 4 | % | | 0.49 |
| Centennial Bank | 6,790 | | | 17,165 | | | 2 | % | | 1.42 | | 46,280 | | | 55,712 | | | 6 | % | | 1.66 |
| Total | $ | 1,191,571 | | | $ | 525,934 | | | | | | | $ | 1,015,566 | | | $ | 485,382 | | | | | |
____________________
(1)Represents the excess of the carrying amount or market value of the loans held-for-investment pledged as collateral for repurchase facilities, including accrued interest plus any cash on deposit to secure the repurchase obligation, less the amount of the repurchase liability, including accrued interest.
The Company does not anticipate any defaults by its financing counterparties, although there can be no assurance that one or more defaults will not occur.
Financial Covenants
The Company is subject to a variety of financial covenants under its secured financing agreements. The following represent the most restrictive financial covenants across the agreements as of March 31, 2023:
•Unrestricted cash cannot be less than the greater of $30.0 million and 5.0% of recourse indebtedness. As of March 31, 2023, the Company’s unrestricted cash was $223.4 million, while 5.0% of the Company’s recourse indebtedness was $23.0 million.
•Tangible net worth must be greater than the sum of (i) 75.0% of the Company’s tangible net worth as of June 28, 2017, and (ii) 75.0% of net cash proceeds of the Company’s equity issuances after June 28, 2017, which calculates to $931.7 million. As of March 31, 2023, the Company’s tangible net worth was $1.1 billion.
•Target asset leverage ratio cannot exceed 77.5% and total leverage ratio cannot exceed 80.0%. As of March 31, 2023, the Company’s target asset leverage ratio was 71.7% and the Company’s total leverage ratio was 70.5%.
•Minimum interest coverage of no less than 1.5:1.0. As of March 31, 2023, the Company’s minimum interest coverage was 1.6:1.0.
The Company may also be subject to additional financial covenants in connection with various other agreements it enters into in the normal course of its business. The Company was in compliance with all of its financial covenants as of March 31, 2023, and December 31, 2022, and intends to continue to operate in a manner which complies with all of its financial covenants.
Note 6. Convertible Senior Notes
In October 2018, the Company closed an underwritten public offering of $131.6 million aggregate principal amount of convertible senior notes due October 1, 2023. The net proceeds from the offering were approximately $127.7 million after deducting underwriting discounts and expenses. The notes are unsecured, pay interest semiannually at a rate of 6.375% per annum and are convertible at the option of the holder into shares of the Company’s common stock. The notes will mature on October 1, 2023, unless earlier converted or repurchased in accordance with their terms. The Company does not have the right to redeem the notes prior to maturity but may be required to repurchase the notes from holders under certain circumstances. As of March 31, 2023, the notes had a conversion rate of 50.0894 shares of common stock per $1,000 principal amount of the notes.
The consolidated amount outstanding due on convertible senior notes as of March 31, 2023, and December 31, 2022, was $131.1 million and $130.9 million, respectively, net of deferred issuance costs.
GRANITE POINT MORTGAGE TRUST INC.
Notes to the Condensed Consolidated Financial Statements
The following table details the interest expense related to the convertible senior notes:
| | | | | | | | | | | | | | |
| | Three Months Ended March 31, |
| (in thousands) | | 2023 | | 2022 |
| Cash coupon | | $ | 2,097 | | | $ | 4,119 | |
| Amortization of issuance costs | | 214 | | | 427 | |
| Total interest expense | | $ | 2,311 | | | $ | 4,546 | |
The following table details the carrying value of the convertible senior notes:
| | | | | | | | | | | | | | | | | |
| (in thousands) | March 31,
2023 | | | | December 31,
2022 | | | | |
| Principal outstanding | $ | 131,600 | | | | | $ | 131,600 | | | | | |
| Less: Unamortized issuance costs | (469) | | | | | (682) | | | | | |
| Net carrying value | $ | 131,131 | | | | | $ | 130,918 | | | | | |
Note 7. Senior Secured Term Loan Facilities
Senior Secured Term Loan Facilities
On September 25, 2020, the Company, as a guarantor, and certain of its subsidiaries, as borrowers, entered into a senior secured term loan credit agreement with certain investment vehicles managed by Pacific Investment Management Company LLC, or PIMCO, providing for up to $300.0 million of senior secured term loan facilities. On September 28, 2020, the Company borrowed $225.0 million under the initial term loan facility and on May 9, 2022, the Company completed the repayment of the borrowings under the senior secured term loan facilities.
During the three months ended March 31, 2022, the Company prepaid $50.0 million of borrowings under the senior secured term loan facilities, resulting in a total payment of approximately $53.0 million, inclusive of the principal amount, prepayment penalty and accrued interest. As a result of this repayment, the Company realized a charge on early extinguishment of debt of approximately $(5.8) million, or $(0.11) per basic share, comprised of the prepayment penalty and a pro-rata charge-off of unamortized discount including transaction costs. There was no realized charge on early extinguishment of debt during the three months ended March 31, 2023.
The following table details the interest expense related to the Senior Secured Term Loan as of the three months ended March 31, 2023, and 2022:
| | | | | | | | | | | | | | | | | |
| | | Three Months Ended March 31, |
| (in thousands) | | | | | | | 2023 | | 2022 |
| Cash coupon | | | | | | | $ | — | | | $ | 2,451 | |
| Amortization of issuance costs | | | | | | | — | | | 417 | |
| Total interest expense | | | | | | | $ | — | | | $ | 2,868 | |
Note 8. Cash, Cash Equivalents and Restricted Cash
Cash and cash equivalents include cash held in bank accounts and cash held in money market funds on an overnight basis.
The Company is required to maintain certain cash balances in restricted accounts as collateral for the Company’s repurchase facilities and with counterparties to support investment activities. As of March 31, 2023, the Company held $0.9 million in restricted cash in connection with its non-CRE CLO financing activities, compared to $1.4 million as of December 31, 2022. In addition, as of March 31, 2023, the Company held $2.4 million in restricted cash representing proceeds from principal paydowns of loans held in the CRE CLOs, compared to $5.6 million as of December 31, 2022.
GRANITE POINT MORTGAGE TRUST INC.
Notes to the Condensed Consolidated Financial Statements
The following table provides a reconciliation of cash, cash equivalents and restricted cash reported on the Company’s condensed consolidated balance sheets as of March 31, 2023, and December 31, 2022, that sum to the total of the same such amounts shown in the condensed consolidated statements of cash flows:
| | | | | | | | | | | | | |
| (in thousands) | March 31,
2023 | | December 31,
2022 | | |
| Cash and cash equivalents | $ | 223,432 | | | $ | 133,132 | | | |
| Restricted cash | 3,344 | | | 7,033 | | | |
| Total cash, cash equivalents and restricted cash | $ | 226,776 | | | $ | 140,165 | | | |
Note 9. Fair Value
Fair Value Measurements
ASC 820, Fair Value Measurements, or ASC 820, defines fair value as the price that would be received to sell an asset or paid to transfer a liability in an orderly transaction between market participants at the measurement date. ASC 820 clarifies that fair value should be based on the assumptions market participants would use when pricing an asset or liability and establishes a fair value hierarchy that prioritizes the information used to develop those assumptions. The fair value hierarchy gives the highest priority to quoted prices available in active markets (i.e., market-based or observable inputs) and the lowest priority to data lacking transparency (i.e., unobservable inputs) resulting in the use of management assumptions. Additionally, ASC 820 requires an entity to consider all aspects of nonperformance risk, including the entity’s own credit standing, when measuring fair value of a liability.
ASC 820 establishes a three-level hierarchy to be used when measuring and disclosing fair value. An instrument’s categorization within the fair value hierarchy is based on the lowest level of significant input to its valuation. Following is a description of the three levels:
Level 1Inputs are quoted prices in active markets for identical assets or liabilities as of the measurement date under current market conditions. Additionally, the entity must have the ability to access the active market and the quoted prices cannot be adjusted by the entity.
Level 2Inputs include quoted prices in active markets for similar assets or liabilities; quoted prices in inactive markets for identical or similar assets or liabilities; or inputs that are observable or can be corroborated by observable market data by correlation or other means for substantially the full-term of the assets or liabilities.
Level 3Unobservable inputs are supported by little or no market activity. The unobservable inputs represent the assumptions that market participants would use to price the assets and liabilities, including risk. Generally, Level 3 assets and liabilities are valued using pricing models, discounted cash flow methodologies or similar techniques that require significant judgment or estimation.
Following are descriptions of the valuation methodologies used to measure material assets and liabilities at fair value and details of the valuation models, key inputs to those models and significant assumptions utilized.
GRANITE POINT MORTGAGE TRUST INC.
Notes to the Condensed Consolidated Financial Statements
Recurring Fair Value
As of March 31, 2023, and December 31, 2022, the Company held no assets or liabilities measured at fair value on a recurring basis.
Nonrecurring Fair Value
The Company may be required to measure certain assets or liabilities at fair value from time to time. These periodic fair value measures typically result from establishing allowances for collateral-dependent assets under GAAP. These items would constitute nonrecurring fair value measures under ASC 820. For collateral-dependent loans that are identified as impaired, the Company measures allowance for credit losses by comparing its estimation of the fair value of the underlying collateral, less costs to sell, to the carrying value of the respective loan. To estimate the fair value of the underlying collateral, the Company may (i) use certain valuation techniques which, among others, may include a discounted cash flow method of valuation, or (ii) by obtaining a third-party independent assessment of value such as an appraisal or other opinion of value. These valuations require significant judgments, which include assumptions regarding capitalization rates, discount rates, leasing, creditworthiness of major tenants, occupancy rates, availability and cost of financing, exit plan, loan sponsorship, actions of other lenders, and other factors deemed relevant.
As of March 31, 2023, the Company assigned a risk rating of “5” to five of its loans held-for-investment with an aggregate outstanding principal balance of $274.8 million and an aggregate carrying value of $207.2 million during the quarterly risk rating process. Therefore, these loans had their CECL reserve recorded based on the estimation of the fair value of the loans’ underlying property collateral, less costs to sell, and are measured at fair value on a nonrecurring basis using significant unobservable inputs and are classified as Level 3 assets in the fair value hierarchy. The loans were valued using the discounted cash flow method. The significant unobservable inputs used to estimate the fair value on these loans include the exit capitalization rate, discount rate and return on cost assumptions used to forecast the future sale price of the underlying real estate collateral, which ranged from 6.75% to 9.50%, from 8.00% to 11.00%, and from 5.50% to 6.25%, respectively. Refer to Note 3 - Loans Held-for-Investment, Net of Allowance for Credit Losses for further detail.
Fair Value of Financial Instruments
In accordance with ASC 820, the Company is required to disclose the fair value of financial instruments, both assets and liabilities recognized and not recognized in the condensed consolidated balance sheets, for which fair value can be estimated.
The following describes the Company’s methods for estimating the fair value for financial instruments:
•Loans held-for-investment are carried at cost, net of any unamortized acquisition premiums or discounts, loan fees, origination costs and allowance for credit losses, as applicable. The Company estimates the fair value of its loans held-for-investment by assessing any changes in market interest rates, credit spreads for loans of comparable risk as corroborated by inquiry of other market participants, shifts in credit profiles and actual operating results, taking into consideration such factors as underlying property type, property competitive position within its market, market and submarket fundamentals, tenant mix, nature of business plan, sponsorship, extent of leverage and other loan terms. The Company categorizes the fair value measurement of these assets as Level 3.
•Cash and cash equivalents and restricted cash have a carrying value which approximates fair value because of the short maturities of these instruments. The Company categorizes the fair value measurement of these assets as Level 1.
•The carrying value of underlying loans in repurchase, asset-specific, and secured credit facilities that mature in less than one year generally approximates fair value due to the short maturities. The Company’s long-term repurchase, asset-specific, and secured credit facilities have floating rates based on an index plus a credit spread and the credit spread is typically consistent with those demanded in the market. Accordingly, the interest rates on these borrowings are at market and, thus, carrying value approximates fair value. The Company categorizes the fair value measurement of these liabilities as Level 2.
•Securitized debt obligations are recorded at outstanding principal, net of any unamortized deferred debt issuance costs. In determining the fair value of its securitized debt obligations, management’s judgment may be used to arrive at fair value that considers prices obtained from third-party pricing providers, broker quotes received and other applicable market data. If observable market prices are not available or insufficient to determine fair value due principally to illiquidity in the marketplace, then fair value is based upon internally developed models that are primarily based on observable market-based inputs but also include unobservable market data inputs (including prepayment speeds, delinquency levels and credit losses). The Company categorizes the fair value measurement of these liabilities as Level 2.
•Convertible senior notes are carried at their unpaid principal balance, net of any unamortized deferred issuance costs. The Company estimates the fair value of its convertible senior notes using the market transaction price nearest to March 31, 2023. The Company categorizes the fair value measurement of these assets as Level 2.
GRANITE POINT MORTGAGE TRUST INC.
Notes to the Condensed Consolidated Financial Statements
The following table presents the carrying values and estimated fair values of assets and liabilities that are required to be recorded or disclosed at fair value at March 31, 2023, and December 31, 2022:
| | | | | | | | | | | | | | | | | | | | | | | |
| March 31, 2023 | | December 31, 2022 |
| (in thousands) | Carrying Value | | Fair Value | | Carrying Value | | Fair Value |
| Assets | | | | | | | |
Loans held-for-investment, net of allowance for credit losses | $ | 3,182,379 | | | $ | 3,203,001 | | | $ | 3,267,815 | | | $ | 3,270,338 | |
| | | | | | | |
| | | | | | | |
| Cash and cash equivalents | $ | 223,432 | | | $ | 223,432 | | | $ | 133,132 | | | $ | 133,132 | |
| Restricted cash | $ | 3,344 | | | $ | 3,344 | | | $ | 7,033 | | | $ | 7,033 | |
| Liabilities | | | | | | | |
| Repurchase facilities | $ | 1,191,571 | | | $ | 1,191,571 | | | $ | 1,015,566 | | | $ | 1,015,566 | |
| Securitized debt obligations | $ | 1,039,407 | | | $ | 988,403 | | | $ | 1,138,749 | | | $ | 1,093,351 | |
| Asset-specific financings | $ | 45,823 | | | $ | 45,823 | | | $ | 44,913 | | | $ | 44,913 | |
| Secured credit facility | $ | 100,000 | | | $ | 100,000 | | | $ | 100,000 | | | $ | 100,000 | |
| | | | | | | |
| Convertible senior notes | $ | 131,131 | | | $ | 124,680 | | | $ | 130,918 | | | $ | 127,881 | |
| | | | | | | |
Note 10. Commitments and Contingencies
The following represent the material commitments and contingencies of the Company as of March 31, 2023:
Legal and Regulatory
From time to time, the Company may be subject to liability under laws and government regulations and various claims and legal actions arising in the ordinary course of business. Liabilities are established for legal claims when payments associated with the claims become probable and the costs can be reasonably estimated. The actual costs of resolving legal claims may be substantially higher or lower than the amounts established for those claims. Based on information currently available, management is not aware of any legal or regulatory claims that would have a material effect on the Company’s condensed consolidated financial statements and, therefore, no accrual is required as of March 31, 2023.
Unfunded Commitments on Loans Held-for-Investment
Certain of the Company’s commercial real estate loan agreements contain provisions and obligations to extend credit to its borrowers through its unfunded loan commitments over the contractual period of its loans. As of March 31, 2023, and December 31, 2022, the Company had unfunded loan commitments of $204.5 million and $229.6 million, respectively, on loans held-for-investment, which it expects to fund, subject to the satisfaction of any conditions precedent to such commitments, over the tenure of these loans. These commitments generally provide funding for lease-related or capital improvement expenditures, as well as interest and carry costs, all of which will vary depending on the progress of capital improvement projects, leasing and cash flows at the properties that serve as collateral for the Company’s loans. Therefore, the exact timing and amounts of such loan balance future fundings are generally uncertain and will depend on the current and future performance of the collateral properties. The Company typically finances the funding of its loan commitments on terms generally consistent with its overall financing facilities; however, most of its financing agreement counterparties are not obligated to fund their ratable portion of these loan commitments over time and have varying degrees of discretion over future loan funding obligations, including the advance rates on their fundings. The Company may be obligated to fund loan commitments with respect to a financed asset even if the applicable financing counterparty will not fund their ratable portion of the loan commitment and/or has made margin calls with respect to such financed asset.
As of March 31, 2023, the Company recognized $4.5 million in other liabilities related to the allowance for credit losses on unfunded loan commitments. See Note 3 - Loans Held-for-Investment, Net of Allowance for Credit Losses for further detail.
Note 11. Preferred Stock
Temporary Equity
The Company’s 10% cumulative redeemable preferred stock ranks, with respect to rights to the payment of dividends and the distribution of assets upon liquidation, dissolution or winding up of the Company, senior to the rights of holders of the Fixed-to-Floating Rate Cumulative Redeemable Preferred Stock. The holders of the 10% cumulative redeemable preferred stock are entitled to receive, when, as and if authorized and declared by the Company’s board of directors, cumulative cash dividends at the rate of 10% per annum of the $1,000 liquidation preference per share of the 10% cumulative redeemable
GRANITE POINT MORTGAGE TRUST INC.
Notes to the Condensed Consolidated Financial Statements
preferred stock. Such dividends accrue on a daily basis and are cumulative from and including the initial issue date of the 10% cumulative redeemable preferred stock of June 28, 2017.
The Company currently has the option to redeem the 10% cumulative redeemable preferred stock at a redemption price of $1,000 per share, plus any accrued and unpaid dividends. At any time after six years from the initial issue date, the Company will, at the request of any 10% cumulative redeemable preferred stockholder, repurchase the holder’s 10% cumulative redeemable preferred stock at a price of $1,000 per share, plus any accrued and unpaid dividends.
During each of the three months ended March 31, 2023, and 2022, the Company declared dividends to the 10% cumulative redeemable preferred stockholder of $25,000.
Issuance of Sub-REIT Preferred Stock
In January 2021, a subsidiary of the Company issued 625 shares of Series A preferred stock of which 500 shares were retained by the Company and 125 shares were sold to third-party investors for proceeds of $0.1 million. The 500 preferred shares of Series A preferred stock retained by the Company are eliminated in the Company’s condensed consolidated statements of changes in equity and the 125 shares sold to third-party investors are shown in the Company’s condensed consolidated statements of changes in equity as non-controlling interests.
Issuance of Series A Preferred Stock
On November 30, 2021, and December 10, 2021, the Company received total net proceeds of $110.5 million from the issuance of 4,596,500 shares of Series A Preferred Stock, or the Initial Series A Preferred Stock Shares, after deducting the underwriting discount of $3.6 million and issuance costs of $0.8 million.
On January 18, 2022, and February 8, 2022, the Company received total net proceeds of $87.5 million from the issuance of 3,633,000 additional shares of Series A Preferred Stock, or the Additional Series A Preferred Stock Shares, after deducting the underwriting discount of $2.9 million and issuance costs of $0.4 million. The Series A Preferred Stock is currently listed on the NYSE under the symbol “GPMT PrA”.
On and after November 30, 2026, the Company, at its option, upon not fewer than 30 days’ nor more than 60 days’ written notice, may redeem the Series A Preferred Stock, in whole, at any time, or in part, from time to time, for cash, at a redemption price of $25.00 per share, plus any accrued and unpaid dividends thereon to, but excluding, the date fixed for redemption.
Upon the occurrence of a Change of Control event (as defined in the Articles Supplementary designating the Series A Preferred Stock, or the Articles Supplementary), the Company may, at its option, upon not less than 30 nor more than 60 days’ written notice, redeem the Series A Preferred Stock, in whole or in part, within 120 days on or after the first date on which such Change of Control occurred, for cash at a redemption price of $25.00 per share, plus any accumulated and unpaid dividends thereon to, but excluding, the redemption date, without interest.
Holders of Series A Preferred Stock do not have any voting rights except in limited circumstances as set forth in the Articles Supplementary.
During the three months ended March 31, 2023, the Company declared dividends on the Series A Preferred Stock of $3.6 million.
Note 12. Stockholders’ Equity
Common Stock
Distributions to Stockholders
The following table presents cash dividends declared by the Company’s board of directors on its common stock during the three months ended March 31, 2023, and 2022:
| | | | | | | | | | | | | | | | | | | | |
| Declaration Date | | Record Date | | Payment Date | | Cash Dividend Per Share |
| 2023 | | | | | | |
| March 16, 2023 | | April 3, 2023 | | April 17, 2023 | | $ | 0.20 | |
| | | | | | $ | 0.20 | |
| | | | | | |
| 2022 | | | | | | |
| | | | | | |
| | | | | | |
| | | | | | |
| March 17, 2022 | | April 1, 2022 | | April 15, 2022 | | $ | 0.25 | |
| | | | | | $ | 0.25 | |
| | | | | | |
| | | | | | |
| | | | | | |
| | | | | | |
| | | | | | |
| | | | | | |
| | | | | | |
| | | | | | |
| | | | | | |
| | | | | | |
| | | | | | |
| | | | | | |
| | | | | | |
| | | | | | |
| | | | | | |
| | | | | | |
| | | | | | |
| | | | | | |
| | | | | | |
| | | | | | |
| | | | | | |
| | | | | | |
| | | | | | |
GRANITE POINT MORTGAGE TRUST INC.
Notes to the Condensed Consolidated Financial Statements
Share Repurchases
On December 16, 2021, the Company announced that its board of directors had increased the Company’s share repurchase authorization to allow for the repurchase of up to an aggregate of 4,000,000 shares of the Company’s common stock. The Company’s share repurchase program has no expiration date. The shares are expected to be repurchased from time to time through privately negotiated transactions or open market transactions, including pursuant to a trading plan in accordance with Rules 10b5-1 and 10b-18 under the Exchange Act, or by any combination of such methods. The manner, price, number and timing of share repurchases will be subject to a variety of factors, including market conditions and applicable SEC rules. During the three months ended March 31, 2023, the Company repurchased 1,001,338 shares of its common stock for an aggregate cost of $5.1 million. No shares were repurchased during the three months ended March 31, 2022. As of March 31, 2023, there remained 157,916 shares authorized for repurchase.
The Company has also authorized the repurchase of shares of restricted stock granted to employees for tax withholding purposes. During the three months ended March 31, 2023, and 2022, the Company repurchased from employees 36,916 and 69,039 shares of its common stock, respectively, for an aggregate cost of $0.2 million and $0.8 million, respectively.
At-the-Market Offering
The Company is party to an equity distribution agreement under which the Company may sell up to an aggregate of 8,000,000 shares of its common stock from time to time in any method permitted by law deemed to be an “at-the-market” offering as defined in Rule 415 under the Securities Act. As of March 31, 2023, 3,242,364 shares of common stock had been sold under the equity distribution agreement for total accumulated net proceeds of approximately $61.2 million. No shares were sold during the three months ended March 31, 2023, or 2022.
Warrants to Purchase Common Stock
See Note 7 - Senior Secured Term Loan Facilities and Warrants to Purchase Shares of Common Stock for details on warrants to purchase shares of the Company’s common stock.
Preferred Stock
Distributions to Stockholders
The following table presents cash dividends declared by the Company’s board of directors on its Series A Preferred Stock during the three months ended March 31, 2023, and 2022:
| | | | | | | | | | | | | | | | | | | | |
| Declaration Date | | Record Date | | Payment Date | | Cash Dividend Per Share |
| 2023 | | | | | | |
| March 16, 2023 | | April 3, 2023 | | April 17, 2023 | | $ | 0.43750 | |
| | | | | | $ | 0.43750 | |
| 2022 | | | | | | |
| | | | | | |
| | | | | | |
| | | | | | |
| March 17, 2022 | | April 1, 2022 | | April 15, 2022 | | 0.43750 |
| | | | | | $ | 0.43750 | |
| | | | | | |
| | | | | | |
| | | | | | |
Note 13. Equity Incentive Plans
On June 2, 2022, the Company’s stockholders approved the adoption of the Granite Point Mortgage Trust Inc. 2022 Omnibus Incentive Plan, or the 2022 Plan. The 2022 Plan permits the granting of stock options, stock appreciation rights, restricted stock, restricted stock units (both non-performance-based, or RSUs, and performance-based, or PSUs), dividend equivalent rights, other stock-based awards and other cash-based awards to employees, certain consultants of the Company and members of the board of directors. As of March 31, 2023, the Company had 7,250,000 shares of common stock available for future issuance under the 2022 Plan.
With the adoption of the 2022 Plan, no new equity awards may be granted under the Granite Point Mortgage Trust Inc. 2017 Equity Incentive Plan, or the 2017 Plan, but previously-granted RSUs and PSUs remain outstanding under the 2017 Plan. As of March 31, 2023, the Company had 1,650,317 shares of common stock available for future issuance under the 2017 Plan.
The Company accounts for equity-based awards under ASC 718 - Compensation - Stock Compensation, which requires the Company to expense the cost of services received in exchange for equity-based awards based on the grant-date fair value of the awards. This expense is recognized ratably over the requisite service period following the date of grant. The fair value of awards of the Company’s RSUs is typically equivalent to the closing stock price on the grant date. The unrecognized compensation cost relating to such awards is recognized as an expense over the awards’ remaining vesting periods.
GRANITE POINT MORTGAGE TRUST INC.
Notes to the Condensed Consolidated Financial Statements
For the three months ended March 31, 2023, the Company recognized the remaining $47.5 thousand of compensation expense associated with awards of restricted stock, compared to $0.2 million for the three months ended March 31, 2022, within compensation and benefits expense on the condensed consolidated statements of income. As of March 31, 2023, all awards of restricted stock had vested.
As of March 31, 2023, there was $9.8 million of total unrecognized compensation cost for awards of RSUs that will be recognized over the grants’ remaining weighted average vesting period of 1.0 year. For the three months ended March 31, 2023, the Company recognized $1.5 million of compensation expense associated with these awards, compared to $1.3 million for the three months ended March 31, 2022, within compensation and benefits expense on the condensed consolidated statements of income.
Awards of PSUs have a three-year cliff vesting with the number of performance-based stock units vesting at the end of the three-year period based upon the Company’s performance with respect to metrics set in the applicable award agreements. Between 0% and 200% of the target number of units granted in early 2021 and 2022 may vest at the end of their respective performance periods based (i) 50% against the predetermined internal Company performance goal for “core” return on average equity, or ROAE and (ii) 50% against the Company’s performance ranking for “core” ROAE among a group of commercial mortgage REIT peer companies. Between 0% and 200% of the target number of units granted in March 2023 may vest at the end of the performance period based (i) 25% against the predetermined internal Company performance goal “run-rate” ROAE, (ii) 25% against the Company’s performance ranking for “run-rate” ROAE among a group of commercial mortgage REIT companies, (iii) 25% against the predetermined internal Company performance goal for change in book value per share, and (iv) 25% against the Company’s performance ranking for change in book value per share among a group of commercial mortgage REIT companies. The commercial mortgage REIT peer group used to measure relative “core” ROAE, “run-rate” ROAE and change in book value per share includes publicly traded commercial mortgage REITs, which the Company believes derive the majority of their revenues from commercial real estate balance sheet lending activities and meet certain market capitalization criteria.
As of March 31, 2023, there was $5.4 million of total unrecognized compensation cost for awards of PSUs that will be recognized over the grants’ remaining weighted average vesting period of 1.2 years. For the three months ended March 31, 2023, the Company recognized $0.4 million of compensation expense associated with these awards, respectively, compared to $0.7 million for the three months ended March 31, 2022, within compensation and benefits expenses on the condensed consolidated statements of income.
The following table summarizes the grants, vesting and forfeitures of restricted stock, RSUs and PSUs for the three months ended March 31, 2023:
| | | | | | | | | | | | | | | | | | | | | | | |
| Restricted Stock | | RSUs | | PSUs | | Weighted Average Grant Date Fair Market Value |
| | | | | | | |
| | | | | | | |
| | | | | | | |
| | | | | | | |
| | | | | | | |
| | | | | | | |
| | | | | | | |
| | | | | | | |
| | | | | | | |
| | | | | | | |
| | | | | | | |
| | | | | | | |
| | | | | | | |
| | | | | | | |
| | | | | | | |
| | | | | | | |
| Outstanding at December 31, 2022 | 92,585 | | | 1,238,439 | | | 660,434 | | | 11.83 | |
| Granted | — | | | 1,095,521 | | | 734,223 | | | 5.04 | |
| Vested | (92,585) | | | (213,304) | | | — | | | 13.05 | |
| Forfeited | — | | | (114,306) | | | — | | | 10.84 | |
| Outstanding at March 31, 2023 | — | | | 2,006,350 | | | 1,394,657 | | | 8.1 | |
Below is a summary of restricted stock, RSU and PSU vesting dates as of March 31, 2023:
| | | | | | | | | | | | | | | | | | | | | | | |
| Vesting Year | Restricted Stock | | RSUs | | PSUs | | Total Awards |
| 2023 | — | | | 67,036 | | | 347,896 | | | 414,932 | |
| 2024 | — | | | 690,413 | | | 312,538 | | | 1,002,951 | |
| 2025 | — | | | 886,100 | | | 734,223 | | | 1,620,323 | |
| 2026 | — | | | 362,801 | | | — | | | 362,801 | |
| Total | — | | | 2,006,350 | | | 1,394,657 | | | 3,401,007 | |
Note 14. Income Taxes
The Company has elected to be taxed as a REIT under the Code for U.S. federal income tax purposes. As long as the Company qualifies as a REIT, the Company generally will not be subject to U.S. federal income taxes on that portion of its
GRANITE POINT MORTGAGE TRUST INC.
Notes to the Condensed Consolidated Financial Statements
income that it distributes to its stockholders if it annually distributes at least 90% of its REIT taxable income, without regard to the deduction for dividends paid and excluding net capital gains, and does not engage in prohibited transactions. The Company intends to distribute 100% of its REIT taxable income and to continue to comply with all requirements to qualify as a REIT. The majority of states also recognize the Company’s REIT status. The Company’s TRS files a separate federal tax return and is fully taxed as a standalone U.S. C-corporation. It is assumed that the Company will retain its REIT status and will incur no REIT-level taxation as it intends to comply with the REIT regulations and annual distribution requirements.
Based on the Company’s evaluation, it has been concluded that there are no significant uncertain tax positions requiring recognition in the Company’s condensed consolidated financial statements of a contingent tax liability for uncertain tax positions. Additionally, there were no amounts accrued for penalties or interest as of, or during, the periods presented in these condensed consolidated financial statements.
Note 15. Earnings (Loss) Per Share
The following table presents a reconciliation of the earnings and shares used in calculating basic and diluted earnings per share for the three months ended March 31, 2023, and 2022:
| | | | | | | | | | | | | | | | | | | | | |
| | | Three Months Ended |
| | | March 31, |
| (in thousands, except share data) | | | | | 2023 | | 2022 | | | | |
| Numerator: | | | | | | | | | | | |
Net (loss) income attributable to common stockholders | | | | | $ | (37,454) | | | $ | 1,011 | | | | | |
| Dividends allocated to participating restricted stock units | | | | | $ | (401) | | | $ | — | | | | | |
Net (loss) income attributable to common stockholders - basic | | | | | $ | (37,855) | | | $ | 1,011 | | | | | |
| | | | | | | | | | | |
| | | | | | | | | | | |
| | | | | | | | | | | |
Net (loss) income attributable to common stockholders - diluted | | | | | $ | (37,855) | | | $ | 1,011 | | | | | |
| Denominator: | | | | | | | | | | | |
| Weighted average common shares outstanding | | | | | 52,277,518 | | | 53,705,195 | | | | | |
| Weighted average restricted stock shares | | | | | 30,862 | | | 151,856 | | | | | |
Basic weighted average shares outstanding | | | | | 52,308,380 | | | 53,857,051 | | | | | |
| | | | | | | | | | | |
| Effect of dilutive shares issued in an assumed conversion of RSUs as additional shares | | | | | — | | | 104,446 | | | | | |
| | | | | | | | | | | |
| | | | | | | | | | | |
| Diluted weighted average shares outstanding | | | | | 52,308,380 | | | 53,961,497 | | | | | |
(Loss) earnings per share | | | | | | | | | | | |
Basic | | | | | $ | (0.72) | | | $ | 0.02 | | | | | |
Diluted | | | | | $ | (0.72) | | | $ | 0.02 | | | | | |
For the three months ended March 31, 2023, and 2022, excluded from the calculation of diluted earnings per share is the effect of adding back $2.3 million and $4.5 million, respectively, of interest expense and 6,591,765 and 14,065,946, respectively, of weighted average common share equivalents related to the assumed conversion of the Company’s convertible senior notes, as their inclusion would be antidilutive.
The computation of diluted earnings per share is also based on the incremental shares that would be outstanding assuming the settlement of RSUs. The number of incremental shares is calculated by applying the treasury stock method. For the three months ended March 31, 2022, an additional 104,446 weighted-average unvested RSUs were included in the dilutive earnings per share denominator. For the three months ended March 31, 2023, 1,219,646 weighted-average unvested RSUs were excluded in the dilutive earnings per share denominator, as their inclusion would be antidilutive.
The computation of diluted earnings per share is also based on the incremental shares that would be outstanding assuming the settlement of PSUs. The number of incremental shares is calculated by applying the treasury stock method. For the three months ended March 31, 2023, and 2022, 420,997 and 497,220 additional weighted-average unvested PSUs were excluded in the dilutive earnings per share denominator, as their inclusion would be antidilutive.
Note 16. Subsequent Events
Events subsequent to March 31, 2023, were evaluated through the date these condensed consolidated financial statements were issued and no other additional events were identified requiring further disclosure in these condensed consolidated financial statements other than described below.
Subsequent to March 31, 2023, the Company entered into a modification of the Morgan Stanley Bank repurchase facility to extend the maturity date to June 28, 2024, and adjust the total capacity to $475 million.
Item 2. Management’s Discussion and Analysis of Financial Condition and Results of Operations
The following discussion and analysis should be read in conjunction with the interim unaudited condensed consolidated financial statements and accompanying notes included elsewhere in this Quarterly Report on Form 10-Q, as well as our Annual Report on Form 10-K for the year ended December 31, 2022.
Our Company
Granite Point Mortgage Trust Inc. is an internally-managed real estate finance company that focuses primarily on directly originating, investing in and managing senior floating-rate commercial mortgage loans and other debt and debt-like commercial real estate investments. Our investment objective is to preserve our stockholders’ capital while generating attractive risk-adjusted returns over the long term, primarily through dividends derived from current income produced by our investment portfolio. We operate as a REIT, as defined under the Code. We also operate our business in a manner intended to maintain our exclusion from registration under the Investment Company Act. We operate our business as one segment.
Recent Developments
Macroeconomic Environment
The period over the last several quarters has been characterized by steep declines and significant volatility in global securities markets driven by investor concerns over high inflation, rapidly rising interest rates, slowing economic growth and geopolitical uncertainty. Inflation across many key economies reached generational highs, prompting central banks to undertake monetary policy tightening actions that are likely to create headwinds for economic growth. The ongoing war between Russia and Ukraine is also contributing to economic and geopolitical uncertainty.
Inflation remains high and has caused the Federal Reserve to continue to raise interest rates with indications of future increases, which has created further uncertainty for the economy, the capital markets and for our borrowers. More recently, the negative developments in the regional bank sector driven by select bank failures have added to the overall market uncertainty especially with respect to liquidity in the commercial real estate market given the meaningful regional banks’ share of lending in this market. Although our business model is such that, in general, rising interest rates will, all else being equal, correlate to increases in our net income, increases in interest rates may adversely affect our existing borrowers and cost of financing their properties. Additionally, rising rates and increasing costs may dampen consumer spending and slow corporate profit growth, which may negatively impact the collateral underlying certain of our loans. While there is debate among economists as to whether such factors, coupled with recent periods of economic contraction in the U.S., indicate that the U.S. has entered, or in the near term will enter, a recession, it remains difficult to predict the full impact on macroeconomic conditions and our business of recent changes and any future changes in interest rates or inflation.
LIBOR Transition
On March 5, 2021, the Financial Conduct Authority of the U.K., or the FCA, which regulates LIBOR, announced that all LIBOR tenors relevant to us will cease to be published or will no longer be representative after June 30, 2023. The FCA announcement coincided with the March 5, 2021, announcement of LIBOR’s administrator, the ICE Benchmark Administration Limited, or the IBA, indicating that, as a result of not having access to input data necessary to calculate LIBOR tenors relevant to us on a representative basis after June 30, 2023, the IBA would have to cease publication of such LIBOR tenors immediately after the last publication on June 30, 2023. Further, on March 15, 2022, the Consolidated Appropriations Act of 2022, which includes the Adjustable Interest Rate (LIBOR) Act, was signed into law in the United States. This legislation establishes a uniform benchmark replacement process for financial contracts maturing after June 30, 2023, that do not contain clearly defined or practicable fallback provisions. The legislation also creates a safe harbor that shields lenders from litigation if they choose to utilize a replacement rate recommended by the Board of Governors of the United States Federal Reserve, or the Federal Reserve. The Federal Reserve has also advised banks to cease entering into new contracts that use U.S. dollar LIBOR as a reference rate. The Federal Reserve, in conjunction with the Alternative Reference Rate Committee, or the ARRC, a committee convened by the Federal Reserve that includes major market participants, has identified SOFR as its preferred alternative rate for LIBOR. There are significant differences between LIBOR and SOFR, such as LIBOR being an unsecured lending rate while SOFR is a secured lending rate, and SOFR is an overnight rate while LIBOR reflects term rates at different maturities. If our LIBOR-based borrowings are converted to SOFR, the differences between LIBOR and SOFR, and potential margin adjustments in connection with the transition, could result in higher interest costs for us, which could have a material adverse effect on our operating results. Although the ARRC has indicated that data from the cash and derivatives markets show continued momentum in the transition from LIBOR to SOFR and that SOFR is currently predominant across cash and derivatives markets, it is possible that some lenders may choose alternative replacement rates that may differ from LIBOR in ways similar to SOFR or in other ways that would result in higher interest costs for us. We cannot fully predict the ultimate effect of the decision not to sustain LIBOR, or the transition to SOFR or another alternative reference rate as LIBOR’s replacement.
As of March 31, 2023, 61.1% of our loans by carrying value earned a floating rate of interest indexed to LIBOR, and 37.5% to SOFR. As of March 31, 2023, 43.7% of our outstanding financing arrangements (excluding our convertible senior notes) bear interest indexed to LIBOR, and 56.3% to SOFR. All of our LIBOR-based arrangements provide procedures for
determining an alternative base rate when LIBOR is discontinued. As of March 31, 2023, the one-month SOFR was 4.80% and one-month US LIBOR was 4.86%. Regardless, there can be no assurances as to what alternative base rates may be and whether such base rate will be more or less favorable than LIBOR and any other unforeseen impacts of the discontinuation of LIBOR. We continue to monitor the developments with respect to the phasing out of LIBOR and are working with our lenders and borrowers to minimize the impact of the LIBOR transition on our financial condition and results of operations, but can provide no assurances regarding the ultimate impact of the discontinuation of LIBOR.
First Quarter 2023 Activity
Operating Results:
•GAAP net (loss) attributable to common stockholders of $(37.5) million, or $(0.72) per basic share, mainly reflecting an increase in CECL reserves of $(46.4) million.
•Distributable Earnings of $10.7 million, or $0.20 per basic share, which excludes the $(46.4) million non-cash provision for credit losses and $2.0 million of non-cash equity compensation expense.
•Book value per share of common stock of $14.08 inclusive of $(2.54) per share of total CECL reserve.
•Declared aggregate common stock dividends of $10.7 million, or $0.20 per share of common stock, and preferred dividends of $3.6 million, or $0.43750 per share of Series A Preferred Stock.
Investment Portfolio Activity:
•Funded $17.3 million of prior loan commitments.
•Realized loan repayments, principal paydowns and principal amortization of $59.5 million.
•Maintained a portfolio of 88 loan investments with an aggregate unpaid principal balance of $3.3 billion and total commitments of $3.5 billion, weighted average stabilized LTV at origination of 62.9%, and a weighted average all-in yield at origination of L+/S+4.04%.
Portfolio Financing Activity:
•Redeemed the GPMT 2019-FL2 CRE CLO, which at its redemption had $98.1 million of outstanding borrowings.
•Increased the maximum borrowing capacity on the JPMorgan financing facility up to $425.0 million.
Corporate Financing Activity:
•Accretively repurchased approximately 1.0 million shares of common stock at an average price of $5.08 for a total of $5.1 million.
Available Liquidity
•At March 31, 2023, carried unrestricted cash of $223.4 million, a portion of which is subject to certain liquidity covenants, as well as $2.4 million of restricted cash related to balances in CRE CLOs which can be used for reinvestment of certain loan balances or paydown of outstanding CLO borrowings.
Key Financial Measures and Indicators
As a commercial real estate finance company, we believe the key financial measures and indicators for our business are earnings per share presented on a GAAP basis, dividends declared on common stock, Distributable Earnings and book value per share of common stock. For the three months ended March 31, 2023, we recorded GAAP net (loss) per basic share of $(0.72), declared a cash dividend of $0.20 per share of common stock and reported Distributable Earnings of $0.20 per basic share. Our book value as of March 31, 2023, was $14.08 per share of common stock, inclusive of $(2.54) of total CECL reserve.
As further described below, Distributable Earnings is a measure that is not prepared in accordance with GAAP. We use Distributable Earnings to evaluate our performance, excluding the effects of certain transactions and GAAP adjustments that we believe are not necessarily indicative of our current loan portfolio and operations. In addition, Distributable Earnings is a performance metric we consider, along with other measures, when declaring our common stock dividends.
Earnings Per Share and Dividends Declared Per Common Share
The following table sets forth the calculation of basic and diluted (loss) earnings per share and dividends declared per share:
| | | | | | | | | | | | | | | | | |
| | | Three Months Ended |
| | | March 31, |
| (in thousands, except share data) | | | | | 2023 | | 2022 |
| Net (loss) income attributable to common stockholders | | | | | $ | (37,454) | | | $ | 1,011 | |
| Weighted average number of common shares outstanding | | | | | 52,308,380 | | | 53,857,051 | |
| Weighted average number of diluted shares outstanding | | | | | 52,308,380 | | | 53,961,497 | |
| Basic (loss) earnings per basic common share | | | | | $ | (0.72) | | | $ | 0.02 | |
| Diluted (loss) earnings per basic common share | | | | | $ | (0.72) | | | $ | 0.02 | |
| Dividend declared per common share | | | | | $ | 0.20 | | | $ | 0.25 | |
Distributable Earnings
In order to maintain our status as a REIT, we are required to distribute at least 90% of our taxable income as dividends. Distributable Earnings is intended to over time serve as a general, though imperfect, proxy for our taxable income. As such, Distributable Earnings is considered a key indicator of our ability to generate sufficient income to pay our common dividends, which is the primary focus of income-oriented investors who comprise a meaningful segment of our stockholder base. We believe providing Distributable Earnings on a supplemental basis to our net income and cash flow from operating activities, as determined in accordance with GAAP, is helpful to stockholders in assessing the overall run-rate operating performance of our business.
We use Distributable Earnings to evaluate our performance, excluding the effects of certain transactions and GAAP adjustments we believe are not necessarily indicative of our current loan portfolio and operations. For reporting purposes, we define Distributable Earnings as net income attributable to our stockholders, computed in accordance with GAAP, excluding: (i) non-cash equity compensation expenses; (ii) depreciation and amortization; (iii) any unrealized gains (losses) or other similar non-cash items that are included in net income for the applicable reporting period (regardless of whether such items are included in other comprehensive income or in net income for such period); and (iv) certain non-cash items and one-time expenses. Distributable Earnings may also be adjusted from time to time for reporting purposes to exclude one-time events pursuant to changes in GAAP and certain other material non-cash income or expense items approved by a majority of our independent directors. The exclusion of depreciation and amortization from the calculation of Distributable Earnings only applies to debt investments related to real estate to the extent we foreclose upon the property or properties underlying such debt investments.
While Distributable Earnings excludes the impact of the unrealized non-cash current provision for credit losses, we expect to only recognize such potential credit losses in Distributable Earnings if and when such amounts are deemed non-recoverable. This is generally at the time a loan is repaid, or in the case of foreclosure, when the underlying asset is sold, but non-recoverability may also be concluded if, in our determination, it is nearly certain that all amounts due will not be collected. The realized loss amount reflected in Distributable Earnings will equal the difference between the cash received, or expected to be received, and the carrying value of the asset, and is reflective of our economic experience as it relates to the ultimate realization of the loan. During the three months ended March 31, 2023, we recorded provision for credit losses of $(46.4) million, which has been excluded from Distributable Earnings consistent with other unrealized gains (losses) and other non-cash items pursuant to our existing policy for reporting Distributable Earnings referenced above. Pursuant to our existing policy for reporting Distributable Earnings referenced above. During the three months ended March 31, 2023, we recorded a $0.2 million gain on early extinguishment of debt, which has been excluded from Distributable Earnings consistent with certain one-time events pursuant to our existing policy for reporting Distributable Earnings as a helpful indicator in assessing the overall run-rate operating performance of our business.
Distributable Earnings does not represent net income or cash flow from operating activities and should not be considered as an alternative to GAAP net income, or an indication of our GAAP cash flows from operations, a measure of our liquidity, or an indication of funds available for our cash needs. In addition, our methodology for calculating Distributable Earnings may differ from the methodologies employed by other companies to calculate the same or similar supplemental performance measures, and, accordingly, our reported Distributable Earnings may not be comparable to the Distributable Earnings reported by other companies.
The following table provides a reconciliation of GAAP net (loss) income attributable to common stockholders to Distributable Earnings (in thousands, except share and per share data):
| | | | | | | | | | | | | | | | | |
| | | Three Months Ended |
| | | March 31, |
| (in thousands, except share data) | | | | | 2023 | | 2022 |
| Reconciliation of GAAP net (loss) income to Distributable Earnings: | | | |
| GAAP net (loss) income attributable to common stockholders | | | | | $ | (37,454) | | | $ | 1,011 | |
| Adjustments for non-distributable earnings: | | | | | | | |
| Provision for (benefit from) credit losses | | | | | 46,410 | | | 3,688 | |
| Write-offs | | | | | — | | | (10,107) | |
| | | | | | | |
| (Gain) loss on extinguishment of debt | | | | | (238) | | | 5,791 | |
| | | | | | | |
| Non-cash equity compensation | | | | | 1,955 | | | 2,171 | |
| Distributable Earnings | | | | | $ | 10,673 | | | $ | 2,554 | |
| Distributable Earnings per basic share of common stock | | | | | $ | 0.20 | | | $ | 0.05 | |
| Distributable Earnings per diluted share of common stock | | | | | $ | 0.20 | | | $ | 0.05 | |
| Basic weighted average common shares | | | | | 52,308,380 | | | 53,857,051 | |
| Diluted weighted average common shares | | | | | 52,308,380 | | | 53,961,497 | |
Book Value Per Common Share
The following table provides the calculation of our book value per share of common stock:
| | | | | | | | | | | | | | |
| | | | |
| | | | | | |
| (in thousands, except share data) | | | | March 31,
2023 | | December 31,
2022 |
| Stockholders’ equity | | | | $ | 931,333 | | | $ | 983,545 | |
| 7.00% Series A cumulative redeemable preferred stock liquidation preference | | | | (205,738) | | | (205,738) | |
| | | | | | |
| Common stockholders’ equity | | | | $ | 725,595 | | | $ | 777,807 | |
| Shares: | | | | | | |
| Common stock | | | | 51,526,039 | | | 52,258,404 | |
| Restricted stock | | | | — | | | 92,585 | |
| Total outstanding | | | | 51,526,039 | | | 52,350,989 | |
| Book value per share of common stock | | | | $ | 14.08 | | | $ | 14.86 | |
Book value per share as of March 31, 2023, includes the impact of an estimated allowance for credit losses of $(133.0) million, or $(2.54) per common share. See Note 3 – Loans Held-for-Investment, Net of Allowance for Credit Losses to our condensed consolidated financial statements included in this Quarterly Report on Form 10-Q for a detailed discussion of allowance for credit losses.
Portfolio Overview
Our business model is mainly focused on directly originating, investing in and managing senior floating-rate commercial mortgage loans and other debt and debt-like commercial real estate investments. As a result of this strategy, our operating performance is subject to overall market demand for commercial real estate loan products and other debt and debt-like commercial real estate investments. We place emphasis on diversifying our investment portfolio across geographical regions and local markets, property types, borrowers and loan structures. We do not limit our loan originations by geographical area or property type so that we may develop a well-diversified investment portfolio.
Interest-earning assets include our 100% loan investment portfolio. At March 31, 2023, our portfolio was comprised of 88 loans, of which 87 were senior first mortgage loans totaling $3.5 billion of commitments with an unpaid principal balance of $3.3 billion, and one was a subordinated loan totaling $13.7 million in commitments and unpaid principal balance. At March 31, 2023, the weighted average risk rating of our loan portfolio was 2.6, as compared to 2.5 at December 31, 2022, weighted by total unpaid principal balance.
During the three months ended March 31, 2023, we had $17.3 million of additional fundings made under existing loan commitments. Proceeds from loan repayments, paydowns, and principal amortization totaled $59.5 million. We generated interest income of $66.7 million and incurred interest expense of $43.8 million, which resulted in net interest income of $22.9 million. See Note 3 - Loans Held-for-Investment, Net of Allowance for Credit Losses to our Condensed Consolidated Financial Statements included in this Quarterly Report on Form 10-Q for details.
The following table details our loan activity by unpaid principal balance for the three months ended March 31, 2023, and 2022:
| | | | | | | | | | | | | |
| | | Three Months Ended March 31, |
| (in thousands) | | | 2023 | | 2022 |
Loan originations | | | $ | — | | | $ | 131,560 | |
Other loan fundings (1) | | | $ | 17,324 | | | $ | 40,772 | |
| Deferred interest capitalized | | | $ | 881 | | | $ | 533 | |
| Loan sales | | | $ | — | | | $ | (43,859) | |
Loan repayments (2) | | | $ | (59,450) | | | $ | (118,383) | |
| Loan write-offs and realized loan losses | | | $ | — | | | $ | (10,107) | |
| | | | | |
| | | | | |
| Total loan activity, net | | | $ | (41,245) | | | $ | 516 | |
___________________(1) Additional fundings made under existing loan commitments and upsizing of loans.
(2) Includes repayment of deferred interest capitalized.
The following table details overall statistics for our investment portfolio as of March 31, 2023:
| | | | | |
| (dollars in thousands) | |
| Portfolio Summary |
Number of loans | 88 | |
Total loan commitments | $ | 3,525,272 | |
| Unpaid principal balance | $ | 3,320,761 | |
Unfunded loan commitments | $ | 204,511 | |
| Carrying value | $ | 3,182,379 | |
| Weighted-average cash coupon | L+/S+3.67% |
| Weighted-average all-in yield | L+/S+4.04% |
| |
| Stabilized LTV at origination | 62.9 | % |
The following table provides detail of our portfolio as of March 31, 2023:
| | | | | | | | | | | | | | | | | | | | | | | | | | | | | | | | | | | | | | | | | | | | | | | | | | | | | | | | | | | | | | | | | | | | | | |
| (dollars in millions) | | | | | | | | | | | | | | | | | | | | | | |
Type (1) | | Origination/ Acquisition Date | | Maximum Loan Commitment | | Principal Balance | | Carrying Value | | | | Cash Coupon (2) | | All-in Yield at Origination (3) | | Original Term (Years) (4) | | State | | Property Type | | Initial LTV (5) | | Stabilized LTV (6) |
| Senior | | 12/19 | | $111.1 | | $109.2 | | $109.0 | | | | L+2.75% | | L+3.23% | | 3.0 | | IL | | Multifamily | | 76.5% | | 73.0% |
| Senior | | 12/18 | | 96.4 | | 88.7 | | 88.4 | | | | L+3.75% | | L+5.21% | | 3.0 | | NY | | Mixed-Use | | 26.2% | | 47.6% |
Senior (7) | | 08/19 | | 93.1 | | 93.1 | | 93.2 | | | | L+2.80% | | L+3.26% | | 3.0 | | MN | | Office | | 73.1% | | 71.2% |
Senior (7) | | 10/19 | | 92.6 | | 92.6 | | 92.6 | | | | L+3.24% | | L+3.86% | | 3.0 | | CA | | Office | | 63.9% | | 61.1% |
| Senior | | 07/19 | | 89.8 | | 79.8 | | 79.7 | | | | L+3.69% | | L+4.32% | | 3.0 | | IL | | Office | | 70.0% | | 64.4% |
| Senior | | 10/19 | | 87.8 | | 86.6 | | 86.4 | | | | L+2.55% | | L+3.05% | | 3.0 | | TN | | Office | | 70.2% | | 74.2% |
| Senior | | 12/15 | | 82.0 | | 82.0 | | 82.0 | | | | L+4.15% | | L+4.43% | | 4.0 | | LA | | Mixed-Use | | 65.5% | | 60.0% |
| Senior | | 01/20 | | 81.9 | | 72.7 | | 72.6 | | | | L+4.25% | | L+3.93% | | 3.0 | | CO | | Industrial | | 47.2% | | 47.5% |
| Senior | | 06/19 | | 81.7 | | 81.4 | | 81.4 | | | | S+2.69% | | S+3.05% | | 3.0 | | TX | | Mixed-Use | | 71.7% | | 72.2% |
| Senior | | 10/22 | | 77.3 | | 77.3 | | 77.3 | | | | S+4.50% | | S+4.61% | | 2.0 | | CA | | Retail | | 47.7% | | 36.6% |
| Senior | | 10/19 | | 76.8 | | 76.8 | | 76.7 | | | | L+3.36% | | L+3.73% | | 3.0 | | FL | | Mixed-Use | | 67.7% | | 62.9% |
| Senior | | 12/16 | | 67.8 | | 66.0 | | 66.0 | | | | S+5.15% | | S+4.87% | | 4.0 | | FL | | Office | | 73.3% | | 63.2% |
| Senior | | 12/19 | | 63.7 | | 60.5 | | 60.3 | | | | S+3.50% | | S+3.28% | | 3.0 | | NY | | Office | | 68.8% | | 59.3% |
| Senior | | 07/21 | | 63.3 | | 63.1 | | 62.8 | | | | L+3.00% | | L+3.39% | | 3.0 | | LA | | Multifamily | | 68.8% | | 68.6% |
| Senior | | 12/18 | | 60.1 | | 59.1 | | 59.0 | | | | S+2.90% | | S+3.44% | | 3.0 | | TX | | Office | | 68.5% | | 66.7% |
| Senior | | 10/21 | | 55.5 | | 52.8 | | 52.6 | | | | L+3.15% | | L+3.42% | | 3.0 | | CO | | Multifamily | | 78.2% | | 74.7% |
| Senior | | 05/22 | | 55.5 | | 42.7 | | 42.4 | | | | S+3.29% | | S+3.70% | | 3.0 | | TX | | Multifamily | | 59.3% | | 62.9% |
| Senior | | 05/19 | | 55.4 | | 53.1 | | 53.0 | | | | L+3.20% | | L+3.60% | | 3.0 | | NY | | Mixed-Use | | 59.7% | | 55.1% |
| Senior | | 06/19 | | 54.1 | | 54.0 | | 54.0 | | | | L+3.30% | | L+3.70% | | 3.0 | | VA | | Office | | 49.3% | | 49.9% |
| Senior | | 11/17 | | 53.7 | | 53.7 | | 53.6 | | | | S+5.50% | | S+5.20% | | 3.0 | | TX | | Hotel | | 68.2% | | 61.6% |
| Senior | | 11/21 | | 52.8 | | 48.3 | | 48.0 | | | | L+3.40% | | L+3.82% | | 3.0 | | PA | | Mixed-Use | | 62.0% | | 63.5% |
| Senior | | 06/21 | | 52.7 | | 46.7 | | 46.5 | | | | L+4.32% | | L+4.75% | | 3.0 | | GA | | Office | | 68.0% | | 69.4% |
| Senior | | 09/21 | | 51.7 | | 50.4 | | 50.4 | | | | L+5.00% | | L+5.12% | | 3.0 | | MN | | Hotel | | 68.4% | | 57.8% |
| Senior | | 02/20 | | 50.2 | | 46.2 | | 46.0 | | | | L+3.30% | | L+3.75% | | 3.0 | | TN | | Hotel | | 69.1% | | 54.2% |
| Senior | | 03/22 | | 49.9 | | 46.9 | | 46.5 | | | | S+3.25% | | S+3.64% | | 3.0 | | MA | | Industrial | | 67.3% | | 60.8% |
| Senior | | 08/19 | | 48.2 | | 45.3 | | 45.1 | | | | L+3.70% | | L+3.39% | | 3.0 | | GA | | Office | | 69.5% | | 68.3% |
| Senior | | 07/21 | | 46.4 | | 45.4 | | 45.1 | | | | L+3.69% | | L+4.19% | | 3.0 | | CT | | Office | | 68.3% | | 63.5% |
| Senior | | 04/22 | | 46.2 | | 43.3 | | 43.0 | | | | S+3.41% | | S+3.78% | | 3.0 | | TX | | Multifamily | | 74.4% | | 64.0% |
| Senior | | 08/21 | | 45.8 | | 45.4 | | 45.2 | | | | L+3.16% | | L+3.53% | | 3.0 | | TX | | Multifamily | | 77.8% | | 75.2% |
| Senior | | 08/17 | | 45.8 | | 45.8 | | 45.6 | | | | S+4.35% | | S+4.40% | | 3.0 | | KY | | Multifamily | | 79.8% | | 73.1% |
| Senior | | 07/22 | | 45.0 | | 43.5 | | 42.9 | | | | S+3.58% | | S+4.25% | | 3.0 | | GA | | Multifamily | | 74.5% | | 68.2% |
| Senior | | 09/21 | | 44.3 | | 40.2 | | 39.9 | | | | L+3.30% | | L+3.72% | | 3.0 | | CA | | Office | | 62.4% | | 66.1% |
| Senior | | 02/22 | | 42.4 | | 42.4 | | 42.1 | | | | S+3.05% | | S+3.40% | | 3.0 | | NJ | | Industrial | | 75.0% | | 59.5% |
| Senior | | 07/16 | | 40.5 | | 40.5 | | 40.4 | | | | L+4.65% | | L+4.99% | | 4.0 | | VA | | Office | | 62.8% | | 61.5% |
| Senior | | 12/17 | | 40.2 | | 38.6 | | 38.5 | | | | S+4.75% | | S+5.26% | | 3.0 | | MA | | Mixed-Use | | 72.9% | | 62.0% |
| Senior | | 04/22 | | 40.2 | | 36.7 | | 36.6 | | | | S+4.65% | | S+4.87% | | 3.0 | | NY | | Other | | 66.7% | | 61.8% |
| Senior | | 05/21 | | 38.9 | | 32.9 | | 32.7 | | | | L+3.28% | | L+3.83% | | 3.0 | | AL | | Multifamily | | 72.2% | | 64.8% |
| Senior | | 05/18 | | 38.8 | | 34.8 | | 34.8 | | | | L+3.18% | | L+3.95% | | 3.0 | | MA | | Office | | 47.0% | | 41.1% |
| Senior | | 11/18 | | 37.1 | | 37.1 | | 37.1 | | | | S+3.60% | | S+5.50% | | 3.0 | | CA | | Mixed-Use | | 69.9% | | 67.9% |
| Senior | | 11/19 | | 36.5 | | 36.0 | | 36.0 | | | | L+3.28% | | L+3.14% | | 3.0 | | NC | | Multifamily | | 80.0% | | 72.8% |
| Senior | | 03/20 | | 34.9 | | 18.0 | | 17.9 | | | | S+5.25% | | S+4.66% | | 3.0 | | GA | | Office | | 63.2% | | 64.6% |
| Senior | | 12/18 | | 34.2 | | 33.4 | | 33.3 | | | | S+4.11% | | S+3.27% | | 4.0 | | IL | | Multifamily | | 70.8% | | 62.1% |
| Senior | | 08/19 | | 33.5 | | 30.3 | | 30.3 | | | | L+2.90% | | L+3.38% | | 3.0 | | TX | | Multifamily | | 79.3% | | 72.5% |
| Senior | | 11/21 | | 33.4 | | 30.0 | | 29.9 | | | | L+3.18% | | L+3.52% | | 3.0 | | AL | | Multifamily | | 77.9% | | 68.1% |
| Senior | | 03/16 | | 32.8 | | 32.8 | | 32.8 | | | | 5.11% | | 5.26% | | 10.0 | | NJ | | Office | | 74.9% | | 74.9% |
Senior (7) | | 05/17 | | 31.8 | | 31.8 | | 31.7 | | | | L+5.35% | | L+5.97% | | 3.0 | | TX | | Office | | 68.7% | | 65.1% |
| Senior | | 04/22 | | 31.8 | | 29.0 | | 28.8 | | | | S+3.35% | | S+3.73% | | 3.0 | | GA | | Multifamily | | 75.1% | | 67.1% |
| Senior | | 03/19 | | 30.6 | | 27.1 | | 27.1 | | | | S+3.50% | | S+3.42% | | 3.0 | | NY | | Office | | 53.8% | | 48.5% |
Senior (7) | | 05/17 | | 29.7 | | 29.7 | | 29.7 | | | | S+4.51% | | S+5.36% | | 3.0 | | AZ | | Office | | 69.5% | | 59.0% |
| Senior | | 05/18 | | 29.4 | | 29.4 | | 29.3 | | | | S+5.00% | | S+4.63% | | 3.0 | | NY | | Mixed-Use | | 57.0% | | 51.1% |
| Senior | | 06/18 | | 29.3 | | 24.6 | | 24.5 | | | | S+4.57% | | S+4.75% | | 3.0 | | OH | | Hotel | | 70.6% | | 57.4% |
| Senior | | 04/22 | | 28.6 | | 25.9 | | 25.7 | | | | S+3.22% | | S+3.55% | | 3.0 | | TX | | Multifamily | | 73.3% | | 63.9% |
| Senior | | 01/19 | | 27.6 | | 26.9 | | 26.8 | | | | S+2.97% | | S+3.38% | | 3.0 | | TX | | Multifamily | | 64.9% | | 64.9% |
Senior (7) | | 12/18 | | 27.5 | | 27.5 | | 27.5 | | | | S+3.90% | | S+4.42% | | 3.0 | | MN | | Hotel | | 64.7% | | 57.7% |
| Senior | | 03/22 | | 27.2 | | 24.1 | | 23.7 | | | | S+4.14% | | S+4.89% | | 3.0 | | NC | | Office | | 47.4% | | 53.5% |
| Senior | | 01/19 | | 27.0 | | 25.2 | | 25.1 | | | | S+3.40% | | S+3.44% | | 3.0 | | MA | | Office | | 71.2% | | 70.1% |
| Senior | | 08/19 | | 26.8 | | 26.6 | | 26.5 | | | | L+3.15% | | L+3.67% | | 3.0 | | SC | | Multifamily | | 67.0% | | 58.7% |
| Senior | | 12/18 | | 25.9 | | 24.6 | | 24.5 | | | | L+4.00% | | L+5.56% | | 3.0 | | PA | | Multifamily | | 70.1% | | 67.0% |
| | | | | | | | | | | | | | | | | | | | | | | | | | | | | | | | | | | | | | | | | | | | | | | | | | | | | | | | | | | | | | | | | | | | | | |
| Senior | | 01/18 | | 25.7 | | 25.7 | | 25.7 | | | | L+5.13% | | L+5.58% | | 3.0 | | AZ | | Hotel | | 65.8% | | 61.3% |
| Senior | | 10/21 | | 25.7 | | 25.7 | | 25.5 | | | | L+3.15% | | L+3.43% | | 4.0 | | GA | | Industrial | | 67.5% | | 64.5% |
| Senior | | 03/20 | | 25.1 | | 22.0 | | 21.9 | | | | S+4.25% | | S+3.27% | | 3.0 | | CA | | Office | | 63.6% | | 66.7% |
| Senior | | 08/19 | | 25.0 | | 23.9 | | 23.9 | | | | L+2.66% | | L+3.07% | | 2.0 | | OK | | Multifamily | | 79.9% | | 74.2% |
| Senior | | 12/21 | | 24.7 | | 16.7 | | 16.6 | | | | L+3.30% | | L+3.59% | | 3.0 | | CA | | Office | | 72.9% | | 68.3% |
| Senior | | 09/21 | | 24.4 | | 23.3 | | 23.2 | | | | L+3.18% | | L+3.61% | | 3.0 | | CA | | Multifamily | | 71.9% | | 57.8% |
| Senior | | 12/21 | | 24.4 | | 20.4 | | 20.3 | | | | L+3.86% | | L+4.16% | | 3.0 | | Various | | Other | | 55.1% | | 64.3% |
| Senior | | 07/17 | | 24.3 | | 24.3 | | 24.2 | | | | S+4.50% | | S+4.58% | | 3.0 | | NY | | Multifamily | | 76.5% | | 76.5% |
| Senior | | 05/21 | | 23.3 | | 18.0 | | 17.9 | | | | L+3.50% | | L+4.09% | | 3.0 | | LA | | Multifamily | | 68.0% | | 69.6% |
| Senior | | 10/15 | | 22.9 | | 22.9 | | 22.9 | | | | L+4.07% | | L+5.76% | | 3.0 | | MO | | Hotel | | 73.2% | | 57.8% |
| Senior | | 02/22 | | 22.9 | | 19.7 | | 19.6 | | | | S+3.90% | | S+4.29% | | 3.0 | | CO | | Office | | 64.4% | | 60.2% |
| Senior | | 06/18 | | 22.8 | | 19.5 | | 19.5 | | | | S+5.31% | | S+4.73% | | 3.0 | | FL | | Retail | | 74.0% | | 69.4% |
| Senior | | 04/18 | | 22.2 | | 22.2 | | 22.2 | | | | L+4.05% | | L+4.46% | | 3.0 | | KS | | Multifamily | | 72.1% | | 67.4% |
| Senior | | 06/19 | | 21.5 | | 21.5 | | 21.4 | | | | L+4.50% | | L+5.05% | | 3.0 | | NY | | Other | | 39.6% | | 39.6% |
| Senior | | 07/21 | | 21.4 | | 21.4 | | 21.3 | | | | L+3.25% | | L+3.63% | | 3.0 | | GA | | Multifamily | | 77.0% | | 68.7% |
| Senior | | 05/21 | | 20.6 | | 19.7 | | 19.6 | | | | L+3.99% | | L+4.41% | | 3.0 | | FL | | Multifamily | | 69.8% | | 62.8% |
| Senior | | 06/19 | | 20.4 | | 20.4 | | 20.3 | | | | L+2.90% | | L+4.24% | | 3.0 | | GA | | Mixed-Use | | 60.6% | | 67.4% |
| Senior | | 10/18 | | 19.3 | | 19.1 | | 19.0 | | | | S+4.71% | | S+5.16% | | 3.0 | | CT | | Hotel | | 75.4% | | 66.9% |
| Senior | | 11/18 | | 19.0 | | 17.1 | | 17.1 | | | | L+3.20% | | L+3.83% | | 3.0 | | CA | | Office | | 73.1% | | 64.5% |
| Senior | | 07/19 | | 18.5 | | 16.1 | | 16.0 | | | | L+3.00% | | L+3.60% | | 3.0 | | OH | | Office | | 63.1% | | 66.1% |
| Senior | | 06/21 | | 16.7 | | 14.3 | | 14.1 | | | | L+3.35% | | L+3.82% | | 4.0 | | IN | | Multifamily | | 67.0% | | 66.4% |
| Senior | | 08/17 | | 15.4 | | 12.4 | | 12.3 | | | | S+5.25% | | S+5.49% | | 3.0 | | PA | | Office | | 66.7% | | 67.3% |
| Senior | | 07/18 | | 14.8 | | 10.5 | | 10.5 | | | | S+3.86% | | S+4.35% | | 3.0 | | CA | | Office | | 77.1% | | 63.5% |
| Senior | | 06/19 | | 14.6 | | 11.1 | | 11.0 | | | | L+3.96% | | L+4.69% | | 3.0 | | NY | | Office | | 40.7% | | 60.0% |
| Senior | | 08/21 | | 14.4 | | 14.0 | | 14.0 | | | | L+3.65% | | L+3.88% | | 3.0 | | CO | | Office | | 72.0% | | 63.7% |
| Senior | | 08/18 | | 14.2 | | 14.2 | | 14.2 | | | | L+2.93% | | L+3.32% | | 3.0 | | TX | | Multifamily | | 68.9% | | 63.6% |
| B-Note | | 01/17 | | 13.7 | | 13.7 | | 13.7 | | | | 8.00% | | 8.11% | | 10.0 | | HI | | Hotel | | 41.4% | | 36.2% |
| Senior | | 09/19 | | 12.0 | | 11.8 | | 11.8 | | | | L+2.99% | | L+3.50% | | 3.0 | | WI | | Multifamily | | 51.4% | | 75.0% |
| Senior | | 10/19 | | 11.8 | | 4.1 | | 4.1 | | | | L+2.75% | | L+3.28% | | 3.0 | | CA | | Office | | 70.6% | | 67.8% |
| Senior | | 01/18 | | 8.4 | | 6.6 | | 6.6 | | | | S+5.25% | | S+5.50% | | 3.0 | | PA | | Office | | 66.8% | | 67.3% |
| Allowance for credit losses | | | | | | (128.5) | | | | | | | | | | | | | | | | |
| | | | | | | | | | | | | | | | | | | | | | | | |
| Total/Weighted Average | | $3,525.3 | | $3,320.8 | | $3,182.4 | | | | L+/S+3.67% | | L+/S+4.05% | | 3.1 | | | | | | 66.4% | | 62.9% |
____________________
(1)“Senior” means a loan primarily secured by a first priority lien on commercial real property and related personal property and also includes, when applicable, any companion subordinate loans.
(2)Cash coupon does not include origination or exit fees. Weighted average cash coupon excludes fixed rate loans.
(3)Yield includes net origination fees and exit fees, but does not include future fundings, and is expressed as a monthly equivalent. Weighted average yield excludes fixed rate loans.
(4)Original term (years) is the initial maturity date at origination and does not include any extension options and has not been updated to reflect any subsequent extensions or modifications, if applicable.
(5)Initial loan-to-value ratio, or initial LTV, is calculated as the initial loan amount (plus any financing that is pari passu with or senior to such loan) divided by the as is appraised value (as determined in conformance with the Uniform Standards of Professional Appraisal Practice, or USPAP) as of the date of the loan was originated set forth in the original appraisal.
(6)Stabilized loan-to-value ratio, or stabilized LTV, is calculated as the fully funded loan amount (plus any financing that is pari passu with or senior to such loan), including all contractually provided for future fundings, divided by the as stabilized value (as determined in conformance with USPAP) set forth in the original appraisal. As stabilized value may be based on certain assumptions, such as future construction completion, projected re-tenanting, payment of tenant improvement or leasing commissions allowances or free or abated rent periods, or increased tenant occupancies.
(7)Loan was held on nonaccrual status as of March 31, 2023.
Most of our loans are structured with an initial maturity term, typically three years, and one or more (typically two) one-year extension options, which can be exercised by the borrower subject to meeting various extension conditions in accordance with the terms of the loan agreement. As part of our overall asset management strategy, we have in the past entered into, and may in the future enter into, loan modifications with some of our borrowers. These amendments may include, among other things, modifying or waiving certain performance or extension conditions as part of the overall agreement.
The map and charts below illustrate the geographic distribution and types of properties securing our portfolio as of March 31, 2023 (the charts are weighted by unpaid principal balance):
Portfolio Management and Credit Quality
We actively manage each loan investment from closing and initial funding through final repayment and assess the risk of credit deterioration by quarterly evaluating the performance of the underlying collateral properties. We also evaluate the
macroeconomic environment, prevailing real estate fundamentals and local property market dynamics. Typically, our loan documents allow us, among other things, to receive regular property, borrower and guarantor financial statements; approve annual budgets and major tenant leases; and enforce loan covenants and remedies. In addition, we work with Trimont Real Estate Advisors LLC, one of the leading commercial real estate loan servicers, which provides us with a fully-dedicated and experienced team to increase efficiency and leverage our internal resources in servicing and asset managing our loan investments. Our internal team retains authority on all asset management decisions.
We maintain strong relationships and an active asset management dialogue with our borrowers. We have leveraged those strong relationships to maximize the performance of our portfolio, including during periods of economic uncertainty and market volatility. While we generally believe that the principal amount of our loans is sufficiently protected by the underlying collateral value, there is a risk that we will not realize the entire principal amount of certain of our loan investments.
In addition to ongoing asset management, we review our entire portfolio quarterly, assess the performance of each loan and assign it a risk rating on a scale between “1” and “5,” from least risk to greatest risk, respectively. See Note 3 - Loans Held-for-Investment, Net of Allowance for Credit Losses to our condensed consolidated financial statements included in this Quarterly Report on Form 10-Q for a discussion regarding the risk rating methodology we use for our portfolio.
The following table allocates the unpaid principal balance and the carrying value balances based on our internal risk ratings:
| | | | | | | | | | | | | | | | | | | | | | | | | | | | | | | | | | | | | | |
| (dollars in thousands) | | March 31, 2023 | | December 31, 2022 |
| Risk Rating | | Number of Loans | | Unpaid Principal Balance | | Carrying Value | | Number of Loans | | Unpaid Principal Balance | | Carrying Value |
| 1 | | 7 | | | $ | 257,477 | | | $ | 252,307 | | | 8 | | | $ | 291,236 | | | $ | 287,527 | |
| 2 | | 48 | | | 1,706,949 | | | 1,676,839 | | | 52 | | | 1,857,744 | | | 1,824,564 | |
| 3 | | 24 | | | 839,453 | | | 818,533 | | | 21 | | | 697,532 | | | 689,196 | |
| 4 | | 4 | | | 242,124 | | | 227,466 | | | 5 | | | 268,236 | | | 258,570 | |
| 5 | | 5 | | | 274,758 | | | 207,234 | | | 4 | | | 247,258 | | | 207,958 | |
| Total | | 88 | | | $ | 3,320,761 | | | $ | 3,182,379 | | | 90 | | | $ | 3,362,006 | | | $ | 3,267,815 | |
Loan Modification Activity
Loan modifications and amendments are commonplace in the transitional lending business. We may amend or modify a loan depending on the loan’s specific facts and circumstances. These loan modifications may include additional time for the borrower to refinance or sell the collateral property, adjustment or waiver of performance tests that are prerequisite to the extension of a loan maturity, and/or deferral of scheduled payments. In exchange for a modification, we often receive a partial repayment of principal, an accrual of deferral interest for a portion of interest due, a cash infusion to replenish interest or capital improvement reserves, termination of all or a portion of the remaining unfunded loan commitment, additional call protection, and/or an increase in the loan coupon or additional loan fees. None of our loan modifications resulted in a significant modification during the three months ended March 31, 2023.
Other Portfolio Developments
During the three months ended March 31, 2023, one first mortgage loan with a principal balance of $27.5 million collateralized by a hotel property was downgraded to a risk rating of “5” as a result of the collateral property’s operating performance being adversely affected by the lagging travel trends impacting the local hotel occupancy rates, capital markets volatility and other factors. At March 31, 2023, we had five collateral-dependent loans with an aggregate principal balance of $274.8 million, for which we recorded an allowance for credit losses of $67.5 million based on our estimate of fair value of the underlying collateral properties, and we held these loans on nonaccrual status.
Portfolio Financing
As of March 31, 2023, our portfolio financing consisted of repurchase, asset-specific financing, and secured credit facilities collateralized by a portion of our loans held-for-investment and securitized debt obligations collateralized by pools of loans held-for-investment issued in CRE CLOs. Our non-mark-to-market financing sources accounted for approximately 50.2% of portfolio loan-level financing as of March 31, 2023.
The following table details our portfolio loan-level financing as of March 31, 2023, and December 31, 2022:
| | | | | | | | | | | |
| (in thousands) | March 31,
2023 | | December 31,
2022 |
| CRE CLOs | $ | 1,039,407 | | | $ | 1,138,749 | |
| | | |
| Asset-specific financing facility | 45,823 | | | 44,913 | |
| Secured credit facility | 100,000 | | | 100,000 | |
| Secured repurchase agreement (non-mark-to-market) | 6,970 | | | 46,280 | |
| Total non-mark-to-market financing | 1,192,200 | | | 1,329,942 | |
| Secured repurchase agreements (mark-to-market) | 1,184,601 | | | 969,286 | |
| Total portfolio financing | $ | 2,376,801 | | | $ | 2,299,228 | |
The following table summarizes assets at carrying values that served as collateral for the future payment obligations of the repurchase facilities, the asset-specific financing facility, the term financing facility, the secured credit facility and the CRE CLOs as of March 31, 2023, and December 31, 2022:
| | | | | | | | | | | |
| (in thousands) | March 31,
2023 | | December 31,
2022 |
| Loans held-for-investment | $ | 3,292,911 | | | $ | 3,236,745 | |
| | | |
| | | |
| | | |
| Restricted cash | 2,443 | | | 5,674 | |
| | | |
| Total | $ | 3,295,354 | | | $ | 3,242,419 | |
Secured Repurchase Agreements
As of March 31, 2023, we had repurchase facilities in place with five counterparties with aggregate outstanding borrowings of $1.2 billion, which financed a portion of our loans held-for-investment. As of March 31, 2023, the weighted average borrowing rate on our repurchase facilities was 7.4%, the weighted average advance rate was 68.2%, and the term to maturity ranged from 89 days to approximately 2.2 years, with a weighted average remaining maturity of 1.0 years.
The table below details our secured repurchase facilities as of March 31, 2023:
| | | | | | | | | | | | | | | | | | | | | | | | | | | | | | | |
| March 31, 2023 | | |
| (in thousands) | Maturity Date (1) | | Committed | | Amount Outstanding | | Unused Capacity (2) | | Total Capacity | | |
| Repurchase facilities: | | | | | | | | | | | |
Morgan Stanley Bank (3) | June 28, 2023 | | No | | $ | 451,720 | | | $ | 148,280 | | | $ | 600,000 | | | |
Goldman Sachs Bank USA (4) | July 13, 2023 | | No | | $ | 67,749 | | | $ | 182,251 | | | $ | 250,000 | | | |
| JPMorgan Chase Bank | June 28, 2024 | | No | | $ | 409,291 | | | $ | 15,709 | | | $ | 425,000 | | | |
| Citibank | May 25, 2025 | | No | | $ | 256,021 | | | $ | 243,979 | | | $ | 500,000 | | | |
| | | | | | | | | | | |
Centennial Bank (5) | August 29, 2024 | | No | | $ | 6,790 | | | $ | 143,210 | | | $ | 150,000 | | | |
| | | | | | | | | | | |
| | | | | | | | | | | |
| | | | | | | | | | | |
| | | | | | | | | | | |
____________________
(1)The facilities are set to mature on the stated maturity date, unless extended pursuant to their terms.
(2)Unused capacity is not committed as of March 31, 2023
(3)Subsequent to March 31, 2023, we entered into a modification of the facility to extend the maturity date to June 28, 2024, and adjust the total capacity to $475 million.
(4)As of March 31, 2023, we retained options to increase the maximum facility capacity amount up to $350 million, subject to customary terms and conditions.
(5)As of March 31, 2023, we retained options to increase the maximum facility capacity amount up to $200 million, subject to customary terms and conditions.
Under our repurchase facilities, other than with respect to our Centennial Bank repurchase facility, which provides financing on a non-mark-to-market basis, our counterparties may make margin calls as a result of a perceived decline in the value of our assets collateralizing the given secured financing arrangement due to a credit event or, under a limited number of our repurchase facilities, due to market events. To cover a margin call, we may transfer cash or other loan collateral to such a counterparty. Should the value of our assets suddenly decrease, significant margin calls on our mark-to-market repurchase facilities could result, causing an adverse change in our liquidity position.
Commercial Real Estate Collateralized Loan Obligations
We have financed certain pools of our loans through CRE CLOs. At March 31, 2023, we had two CRE CLOs outstanding: GPMT 2021-FL4 and GPMT 2021-FL3, totaling $1.0 billion of outstanding borrowings, financing 40 of our existing first mortgage loan investments with an aggregate principal balance of $1.3 billion. Our CRE CLOs provide us with an attractive cost of funds and, as of March 31, 2023, financed 39.0% of our total loan portfolio principal balance on a term-matched, non-recourse and non-mark-to-market basis. On March 16, 2023, we redeemed the GPMT 2019-FL2 CRE CLO, which at its redemption had $98.1 million of outstanding borrowings. As a result of the redemption, we realized a gain on early extinguishment of debt of approximately $0.3 million.
The following table details our CRE CLO securitized debt obligations:
| | | | | | | | | | | | | | | | | | | | |
| (dollars in thousands) | March 31, 2023 |
| Securitized Debt Obligations | | Principal Balance | | Carrying Value | | Wtd. Avg. Yield/Cost (1) |
| GPMT 2021-FL4 CRE CLO | | | | | | |
Collateral assets (2) | | $ | 621,409 | | | $ | 608,049 | | | L+/S+ 3.7% |
| Financing provided | | 502,564 | | | 499,531 | | | L+ 1.7% |
| GPMT 2021-FL3 CRE CLO | | | | | | |
Collateral assets (3) | | 677,715 | | | 662,892 | | | L+/S+3.9% |
| Financing provided | | 539,876 | | | 539,876 | | | L+1.7% |
| | | | | | |
| | | | | | |
| | | | | | |
| | | | | | |
| | | | | | |
| | | | | | |
| Total | | | | | | |
| Collateral assets | | $ | 1,299,124 | | | $ | 1,270,941 | | | L+/S+3.8% |
| Financing provided | | $ | 1,042,440 | | | $ | 1,039,407 | | | L+1.7% |
______________________________________________________________________________________________________
(1)Calculations of all in yield on collateral assets at origination are based on a number of assumptions (some or all of which may not occur) and are expressed as monthly equivalent yields that include net origination fees and exit fees and exclude future fundings and any potential or completed loan amendments or modifications. Calculations of cost of funds is the weighted average coupon of the CRE CLO, exclusive of any CRE CLO issuance costs.
(2)Includes no restricted cash as of March 31, 2023. Yield on collateral assets is exclusive of restricted cash.
(3)Includes $2.4 million of restricted cash as of March 31, 2023. Yield on collateral assets is exclusive of restricted cash.
Asset-Specific Financing
In April 2019, we entered into a $150 million asset-specific financing facility to provide us with loan-based financing on a non-mark-to-market basis with a term matched to the underlying loan collateral and partial recourse to us.
The following table details the outstanding borrowings under our asset-specific financing facility as of March 31, 2023:
| | | | | | | | | | | | | | | | | | | | |
| (dollars in thousands) | March 31, 2023 |
| Asset-Specific Financing Facility | | Principal Balance | | Carrying Value | | Wtd. Avg. Yield/Cost (1) |
| Collateral assets | | $ | 59,129 | | | $ | 57,950 | | | S+3.4% |
| Borrowings outstanding | | 45,823 | | | 45,823 | | | S+1.8% |
______________________________________________________________________________________________________
(1)Calculations of all in yield on collateral assets at origination are based on a number of assumptions (some or all of which may not occur) and are expressed as monthly equivalent yields that include net origination fees and exit fees and exclude future fundings and any potential or completed loan amendments or modifications. Calculations of all in weighted average yield at origination exclude fixed rate loans. Calculations of cost of funds is the initial weighted average coupon of the asset-specific financing facility, exclusive of any asset-specific financing facility issuance costs.
Secured Credit Facility
In December 2022, we entered into a $100 million secured credit facility, which financed a portion of our loans held for investment on a non-mark-to-market basis. The facility matures on May 25, 2025.
The following table details the outstanding borrowings under our asset-specific financing facility as of March 31, 2023:
| | | | | | | | | | | | | | | | | | | | |
| (dollars in thousands) | March 31, 2023 |
| Secured Credit Facility | | Principal Balance | | Carrying Value | | Wtd. Avg. Yield/Cost (1) |
| | | | | | |
| Collateral assets | | $ | 185,723 | | | $ | 137,112 | | | L+3.6% |
| Borrowings outstanding | | 100,000 | | | 100,000 | | | S+6.5% |
______________________________________________________________________________________________________
(1)Calculations of all in yield on collateral assets at origination are based on a number of assumptions (some or all of which may not occur) and are expressed as monthly equivalent yields that include net origination fees and exit fees and exclude future fundings and any potential or completed loan amendments or modifications. Calculations of all in weighted average yield at origination exclude fixed rate loans. Calculations of cost of funds is the initial weighted average coupon of the secured credit facility, exclusive of any secured credit facility issuance costs.
Corporate Financing
Convertible Senior Notes
We redeemed for cash $143.8 million in convertible senior notes at maturity on December 1, 2022. As of March 31, 2023, the total outstanding amount due on convertible senior notes was $131.6 million. The notes are unsecured and pay interest semiannually at a rate of 6.375% per annum. As of March 31, 2023, these notes had a conversion rate of 50.0894 shares of common stock per $1,000 principal amount of the notes.
As of March 31, 2023, the following convertible senior notes were outstanding:
| | | | | | | | | | | | | | | | | | | | | | | | | | | | | | | | |
| (dollars in thousands) | | March 31, 2023 |
| Convertible Senior Notes | | Principal Balance | | Carrying Value | | Interest Rate | | All-in Cost (1) | | Maturity Date |
| Convertible Senior Notes Maturing 2023 | | $ | 131,600 | | | $ | 131,131 | | | 6.4 | % | | 7.2 | % | | October 1, 2023 |
______________________________________________________________________________________________________
(1)In addition to cash coupon, average yield includes the amortization of deferred financing costs.
The following table provides the quarterly average balances, the quarter-end balances and the maximum balances at any month-end within that quarterly period, of borrowings under our repurchase facilities, asset-specific financing facility, secured financing facility, term financing facility, CRE CLOs, senior secured term loan facilities, secured credit facility and convertible senior notes for the three months ended March 31, 2023, and the four immediately preceding quarters:
| | | | | | | | | | | | | | | | | | | |
| (in thousands) | Quarterly Average | | End of Period Balance | | Maximum Balance of Any Month-End | | |
For the Three Months Ended March 31, 2023 | $ | 2,451,213 | | | $ | 2,507,932 | | | $ | 2,507,932 | | | |
For the Three Months Ended December 31, 2022 | $ | 2,609,762 | | | $ | 2,430,146 | | | $ | 2,739,201 | | | |
For the Three Months Ended September 30, 2022 | $ | 2,824,626 | | | $ | 2,739,202 | | | $ | 2,892,033 | | | |
For the Three Months Ended June 30, 2022 | $ | 3,017,504 | | | $ | 3,014,659 | | | $ | 3,051,406 | | | |
For the Three Months Ended March 31, 2022 | $ | 2,917,731 | | | $ | 2,918,429 | | | $ | 2,951,641 | | | |
Financial Covenants
Our financial covenants and guarantees for outstanding borrowings related to our secured financing agreements generally require us to maintain compliance with the following most restrictive covenants across the agreements:
| | | | | | | | |
Financial Covenant | Description | Value as of December 31, 2022 |
Cash Liquidity | Unrestricted cash liquidity of no less than the greater of $30.0 million and 5.0% of recourse indebtedness, which was $23.0 million. | Unrestricted cash of $223.4 million |
Tangible Net Worth | Tangible net worth greater than the sum of (i) 75.0% of tangible net worth as of June 28, 2017, and (ii) 75.0% of net cash proceeds of equity issuances after June 28, 2017, which calculates to $931.7 million. | Tangible net worth of $1.1 billion |
Leverage Ratios | Target asset leverage ratio cannot exceed 77.5% and total leverage ratio cannot exceed 80.0%. | Target asset leverage ratio of 71.7%; Total leverage ratio of 70.5% |
| Interest Coverage | Interest coverage ratio of no less than 1.5:1.0 | Interest coverage of 1.6:1.0 |
We were in compliance with all financial covenants as of March 31, 2023.
Leverage Ratios
As of March 31, 2023, the total debt-to-equity ratio with respect to our loans held-for-investment was 2.5:1.0, and our recourse leverage ratio was 1.3:1.0.
The following table represents our recourse leverage ratio and total leverage ratio as of March 31, 2023, and December 31, 2022:
| | | | | | | | |
| March 31, 2023 | December 31, 2022 |
Recourse leverage ratio (1) | 1.3 | 1.2 |
Total leverage ratio (2) | 2.5 | 2.3 |
____________________
(1)The debt-to-equity ratio with respect to our loans held-for-investment, defined as recourse debt, net of cash, divided by total equity.
(2)The total debt-to-equity ratio with respect to our loans held-for-investment, defined as total debt, net of cash, divided by total equity.
Floating Rate Portfolio
Our business strategy seeks to minimize our exposure to changes in interest rates by matching benchmark indices on our assets with those on our asset level borrowings. Accordingly, our business model is such that, in general, rising interest rates will increase our net interest income, while declining interest rates will decrease our net interest income, subject to the impact of interest rate floors on our floating rate assets and certain liabilities. As of March 31, 2023, 98.6% of our loan investments by carrying value earned a floating rate of interest and were financed with liabilities that pay interest on a floating rate basis, which resulted in an amount of net floating rate exposure, subject to the impact of interest rate floors on certain of our floating rate loan investments, of $0.8 billion. As of March 31, 2023, 1.4% of our loan investments by carrying value earned a fixed rate of interest and were financed with liabilities that pay interest on a floating rate basis, which resulted in a negative correlation to rising interest rates on that amount of our financing.
The following table details our loan portfolio’s net floating rate exposure as of March 31, 2023: | | | | | |
| (in thousands) | Net Exposure |
Floating rate assets (1) | $ | 3,136,447 | |
Floating rate liabilities (1)(2) | 2,376,801 | |
Net floating rate exposure | $ | 759,646 | |
____________________
(1)Floating rate assets and liabilities are indexed to LIBOR or SOFR.
(2)Floating rate liabilities include our outstanding repurchase facilities, asset-specific financing facility, secured credit facility and CRE CLOs.
Interest-Earning Assets and Interest-Bearing Liabilities
The following tables present the components of interest income and average annualized net asset yield earned by asset type, the components of interest expense and average annualized cost of funds on borrowings incurred by collateral type and net interest income and average annualized net interest rate spread for the three months ended March 31, 2023, and 2022:
| | | | | | | | | | | | | | | | | | | | | | | | | |
| | | Three Months Ended March 31, 2023 |
| (dollars in thousands) | | | | | | | Average Balance | | Interest Income/Expense (1) | | Net Yield/Cost of Funds |
Interest-earning assets (2) | | | | | | | | | | | |
Loans held-for-investment | | | | | | | | | | | |
Senior loans (3) | | | | | | | $ | 3,339,047 | | | $ | 65,017 | | | 7.8 | % |
Subordinated loans | | | | | | | 13,722 | | | 274 | | | 8.0 | % |
| | | | | | | | | | | |
| | | | | | | | | | | |
Other | | | | | | | — | | | 1,428 | | | |
Total interest income/net asset yield | | | | | | | $ | 3,352,769 | | | $ | 66,719 | | | 8.0 | % |
Interest-bearing liabilities | | | | | | | | | | | |
Borrowings collateralized by: | | | | | | | | | | | |
Loans held-for-investment | | | | | | | | | | | |
Senior loans (3) | | | | | | | $ | 2,291,233 | | | $ | 41,337 | | | 7.2 | % |
Subordinated loans | | | | | | | 8,241 | | | 158 | | | 7.7 | % |
| | | | | | | | | | | |
| | | | | | | | | | | |
Other: | | | | | | | | | | | |
Convertible senior notes | | | | | | | 131,060 | | | 2,311 | | | 7.1 | % |
| | | | | | | | | | | |
Total interest expense/cost of funds | | | | | | | $ | 2,430,534 | | | 43,806 | | | 7.2 | % |
Net interest income/spread | | | | | | | | | $ | 22,913 | | | 0.8 | % |
| | | | | | | | | | | | | | | | | | | | | | | | | |
| | | Three Months Ended March 31, 2022 |
| (dollars in thousands) | | | | | | | Average Balance | | Interest Income/Expense (1) | | Net Yield/Cost of Funds |
Interest-earning assets (2) | | | | | | | | | | | |
Loans held-for-investment | | | | | | | | | | | |
Senior loans (3) | | | | | | | $ | 3,787,743 | | | $ | 46,939 | | | 5.0 | % |
Subordinated loans | | | | | | | 14,808 | | | 359 | | | 9.7 | % |
| | | | | | | | | | | |
| | | | | | | | | | | |
Other | | | | | | | — | | | 23 | | | |
Total interest income/net asset yield | | | | | | | $ | 3,802,551 | | | $ | 47,321 | | | 5.0 | % |
Interest-bearing liabilities | | | | | | | | | | | |
Borrowings collateralized by: | | | | | | | | | | | |
Loans held-for-investment | | | | | | | | | | | |
Senior loans (3) | | | | | | | $ | 2,515,619 | | | $ | 16,328 | | | 2.6 | % |
Subordinated loans | | | | | | | 8,387 | | | 67 | | | 3.2 | % |
| | | | | | | | | | | |
| | | | | | | | | | | |
Other: | | | | | | | | | | | |
| Senior secured term loan facilities | | | | | | | 273,227 | | | 4,546 | | | 6.7 | % |
| Convertible senior notes | | | | | | | 109,552 | | | 2,868 | | | 10.5 | % |
| | | | | | | | | | | |
Total interest expense/cost of funds | | | | | | | $ | 2,906,785 | | | 23,809 | | | 3.3 | % |
Net interest income/spread | | | | | | | | | $ | 23,512 | | | 1.7 | % |
____________________
(1)Includes amortization of deferred debt issuance costs.
(2)Average balance represents average amortized cost on loans held-for-investment.
(3)Loans primarily secured by a first priority lien on commercial real property and related personal property and also includes, when applicable, any companion subordinate loans.
Factors Affecting Our Operating Results
The results of our operations are affected by a number of factors and primarily depend on, among other things, the level of our net interest income, the availability and cost of financing for us, the market value of our assets, the credit performance of our assets and the supply of, and demand for, commercial real estate loans, other commercial real estate debt instruments and other financial assets available for investment in the market and available as a source of refinancing of our assets. Our interest income, which reflects the amortization of origination fees and direct costs, is recognized based on the contractual rate and the outstanding principal balance of the loans we originate. The objective of the interest method is to arrive at periodic interest income that yields a level rate of return over the loan term. Interest rates vary according to the type of loan or security, conditions in the financial markets, credit worthiness of our borrowers, competition and other factors, none of which can be predicted with any certainty. Our operating results may also be impacted by credit losses in excess of initial anticipations or unanticipated credit events experienced by our borrowers. We continue to monitor the effects on each of these factors in light of the significant volatility in global markets, driven by investor concerns over inflation, rising interest rates, slowing economic growth, instability in the banking sector following multiple bank failures and geopolitical uncertainty, and how they will affect the results of our operations.
Loan Originations
Our business model is mainly focused on directly originating, investing in and managing senior floating-rate commercial mortgage loans and other debt and debt-like commercial real estate investments. As a result of this strategy, our operating performance is subject to overall market demand for commercial real estate loan products and other debt and debt-like commercial real estate investments. We manage originations and acquisitions of our target investments by diversifying our investment portfolio across geographical regions, local markets, property types, borrower types and loan structures. We do not limit our investments to any number of geographical areas or property types for our originations so that we develop a well-diversified investment portfolio. Additionally, our team has extensive experience originating and acquiring commercial real estate loans and other debt and debt-like commercial real estate investments, through a network of long-standing relationships with borrowers, sponsors and industry brokers. Investor concerns over inflation, rising interest rates, slowing economic growth, instability in the banking sector following multiple bank failures, and geopolitical uncertainty have resulted in significant disruptions in financial markets, uncertainty about the overall macroeconomic outlook and a dislocation in the commercial real estate sector, including reduced borrower demand, wider credit spreads, higher lending rates, increased capitalization rates on properties and significantly lower transaction volume. This dislocation in capital markets and decline in real estate sale transaction and refinancing activities have negatively impacted, and will likely continue to negatively impact, the volume of loan repayments and prepayments on select property types, which are a significant source of our overall liquidity and could make it more difficult for us to originate new loan investments.
Financing Availability
We are subject to the availability and cost of financing to successfully execute on our business strategy and generate attractive risk-adjusted returns to our stockholders. Much of our financing is in the form of repurchase agreements or other types of credit facilities provided to us by our lender counterparties. We mitigate this counterparty risk by seeking to diversify our lending partners, focusing on establishing borrowing relationships with strong counterparties and continuously monitoring them through a thoughtful approach to counterparty risk oversight. Additionally, as part of our broader risk management strategy, and to the extent available in the market, we finance our business through other means, which may include, but not be limited to, securitizations, note sales and issuance of unsecured debt and equity instruments. We continue to actively explore additional types of funding facilities in order to further diversify our financing sources. Investor concerns over inflation, rising interest rates, slowing economic growth, instability in the banking sector following multiple bank failures, and geopolitical uncertainty have resulted in significant disruptions in financial markets and uncertainty about the overall macroeconomic outlook. Declines in economic conditions have negatively impacted, and may continue to negatively impact, real estate and real estate capital markets, which could make it more difficult for us to obtain or maintain financing.
We finance pools of our commercial real estate loans through CRE CLOs, retaining subordinate securities in our investment portfolio. Our CRE CLOs are accounted for as financings with the non-retained securitized debt obligations recognized on our condensed consolidated balance sheets.
Credit Risk
We are subject to varying degrees of credit risk in connection with our target investments. The performance and value of our investments depend upon sponsors’ ability to operate the properties that serve as our collateral so that they produce cash flows adequate to pay interest and principal due to us. In addition, we are exposed to the risks generally associated with the commercial real estate market, including variances in occupancy rates, capitalization rates, absorption rates and other macroeconomic factors beyond our control. We try to mitigate this risk by seeking to originate or acquire assets of higher quality at appropriate rates of return given anticipated and unanticipated losses, by employing a comprehensive review and selection process and by proactively monitoring investments. Nevertheless, unanticipated credit losses, including as a result of inflation, rising interest rates, slowing economic growth, instability in the banking sector following multiple bank failures and geopolitical uncertainty, could occur that could adversely impact our operating results.
The environmental, social and governance, or ESG, factors associated with our potential collateral and borrowers could also pose credit risks to us. We try to mitigate these risks by incorporating diligence practices into our investment process to identify significant ESG concerns related to a given investment. The nature and scope of our ESG diligence will vary based on the investment but may include a review of, among other things, energy management, pollution and contamination, accounting standards, bribery and corruption.
We employ a long-term, fundamental value-oriented investment strategy and we aim to, on a loan-by-loan basis, construct an investment portfolio that is well-diversified across property types, geographies and sponsors.
Operating Expenses
Our operating expenses, such as compensation costs and expenses related to managing our investment portfolio, may vary over time and are subject to a variety of factors, including overall economic and market environment, competitive market forces driving employee-related costs and other related factors.
Allowance for Credit Losses
Our operating results are also impacted by the allowance for credit loss we record for loans held-for-investment using the CECL model pursuant to ASU 2016-13.
Changes in the Fair Value of Our Investments
We intend to hold our target investments for the long-term and, as such, they are carried at an amortized cost on our condensed consolidated balance sheets.
Although we intend to hold our target investments for the long-term, we may occasionally classify some of our debt securities as available-for-sale, or AFS. Investments classified as AFS are carried at their fair value, with changes in fair value recorded through accumulated other comprehensive income, a component of stockholders’ equity, rather than through earnings. We do not intend to hold any of our investments for trading purposes.
Changes in Market Interest Rates
Our primary interest rate exposures relate to the yield on our loans and other investments and the financing cost of our borrowings. Changes in interest rates may affect our net interest income from loans and other investments. Interest rate fluctuations resulting in our interest and related expense exceeding interest and related income would result in operating losses for us. To the extent that our financing costs are determined by reference to floating rates, such as LIBOR, SOFR or a Treasury index, the amount of such costs will depend on the level and movement of interest rates. In response to the inflationary pressures, over the last year the Federal Reserve has approved multiple increases to its federal funds rate target range and has indicated that it anticipates further increases in interest rates. Any such increases could adversely affect our results of operations and financial condition. In a period of rising interest rates, our interest expense on floating rate borrowings would increase, while, in certain circumstances, rate floors on our floating rate loan investments could limit the growth of our interest income. Any such scenario could adversely affect our results of operations, interest coverage ratio and financial condition.
Although our strategy is to primarily originate, invest in and manage senior floating-rate commercial mortgage loans, from time-to-time we may acquire or originate fixed-rate investments, which further exposes our operating results to the risks posed by fluctuations in interest rates. To the extent that this applies to us, we may choose to actively manage this risk through the use of hedging strategies.
Summary of Results of Operations and Financial Condition
Comparison of the Three Months Ended March 31, 2023, and December 31, 2022
Net Interest Income
The following table presents the components of interest income and interest expense for the three months ended March 31, 2023, and December 31, 2022:
| | | | | | | | | | | | | | | | | | | | | | | | | | | | | | | | |
| (in thousands) | | | Three Months Ended | | | | | | | | | |
| Income Statement Data: | | | March 31, 2023 | | December 31, 2022 | | Q1’23 vs Q4’22 | | | | | | | | | | | | | |
| Interest income: | | | (unaudited) | | | | | | | | | | | | | | | |
| Loans held-for-investment | | | $ | 65,291 | | | $ | 60,025 | | | $ | 5,266 | | | | | | | | | | | | | | |
| | | | | | | | | | | | | | | | | | | | |
| | | | | | | | | | | | | | | | | | | | |
| | | | | | | | | | | | | | | | | | | | |
| Cash and cash equivalents | | | 1,428 | | | 1,394 | | | 34 | | | | | | | | | | | | | | |
| Total interest income | | | 66,719 | | | 61,419 | | | $ | 5,300 | | | | | | | | | | | | | | |
| Interest expense: | | | | | | | | | | | | | | | | | | | | |
| Repurchase facilities | | | 19,772 | | | 18,966 | | | 806 | | | | | | | | | | | | | | |
| Securitized debt obligations | | | 18,051 | | | 16,639 | | | 1,412 | | | | | | | | | | | | | | |
| Convertible senior notes | | | 2,311 | | | 3,824 | | | (1,513) | | | | | | | | | | | | | | |
| Term financing facility | | | — | | | — | | | — | | | | | | | | | | | | | | |
| Asset-specific financings | | | 743 | | | 623 | | | 120 | | | | | | | | | | | | | | |
| | | | | | | | | | | | | | | | | | | | |
| Secured credit facility | | | 2,929 | | | 383 | | | 2,546 | | | | | | | | | | | | | | |
| Senior secured term loan facilities | | | — | | | — | | | — | | | | | | | | | | | | | | |
| | | | | | | | | | | | | | | | | | | | |
| Total interest expense | | | 43,806 | | | 40,435 | | | 3,371 | | | | | | | | | | | | | | |
| Net interest income | | | 22,913 | | | 20,984 | | | 1,929 | | | | | | | | | | | | | | |
The majority of our interest-earning assets and liabilities have floating rates based on an index (e.g., one-month LIBOR/SOFR) plus a credit spread. As a result, our asset yields and cost of funds are impacted by changes in benchmark market short-term interest rates and credit spreads on investments and borrowings, as well as changes in the mix of our investment portfolio credit spreads due to new originations, loan amendments, additional fundings, upsizings, repayments and when certain loans are placed on nonaccrual status.
Interest Income
Interest income for the three months ended March 31, 2023, increased to $66.7 million from $61.4 million for the three months ended December 31, 2022, mainly due to an increase in short-term interest rates, partially offset by a lower average balance of our interest-earning assets and higher average balance of nonaccrual loans.
Interest Expense
Interest expense for the three months ended March 31, 2023, increased to $43.8 million from $40.4 million for the three months ended December 31, 2022, mainly due to an increase in short-term interest rates and a higher average balance on the higher-cost secured credit facility, partially offset by a lower average balance on convertible senior notes.
Provision for Credit Losses
The following table presents the components of (provision for) benefit from credit losses for the three months ended March 31, 2023, and December 31, 2022:
| | | | | | | | | | | | | | | | | |
| Three Months Ended
March 31, | | | | Three Months Ended
December 31, | | | | |
| (in thousands) | 2023 | | | | 2022 | | | | |
| (Provision for) benefit from credit losses on: | | | | | | | | | |
| Loans held-for-investment | $ | (46,116) | | | | | $ | (15,224) | | | | | |
| | | | | | | | | |
| | | | | | | | | |
| Other liabilities | (294) | | | | | (1,284) | | | | | |
| | | | | | | | | |
| Total (provision for) benefit from credit losses | $ | (46,410) | | | | | $ | (16,508) | | | | | |
During the three months ended March 31, 2023, we recorded a provision for credit losses of $46.4 million as compared to $16.5 million for the three months ended December 31, 2022. The increase in the provision for credit losses was primarily driven by recording an increase in the allowance for collateral-dependent loans during the three months ended March 31, 2023, that were individually assessed in accordance with ASU 2016-13. The collateral properties securing these loans have been affected by an increasingly uncertain macroeconomic outlook which includes weakening in credit fundamentals, reduced liquidity in the capital markets especially for certain property types such as office assets located in underperforming markets,
and inflationary expectations resulting in meaningfully higher interest rates, resulting in slowing of business plan execution and reduced market liquidity impacting the borrowers’ ability to either sell or refinance their properties.
Expenses
The following table presents the components of expenses for the three months ended March 31, 2023, and December 31, 2022: | | | | | | | | | | | | | | | |
| | | Three Months Ended
March 31, | | Three Months Ended
December 31, |
| (dollars in thousands) | | | | | 2023 | | 2022 |
| | | | | | | |
Compensation and benefits | | | | | $ | 5,912 | | | $ | 3,686 | |
Servicing expenses | | | | | $ | 1,378 | | | $ | 1,421 | |
| | | | | | | |
| | | | | | | |
| | | | | | | |
| | | | | | | |
| | | | | | | |
| | | | | | | |
| | | | | | | |
| Other operating expenses | | | | | $ | 3,271 | | | $ | 3,887 | |
Annualized total operating expense ratio | | | | | 4.3 | % | | 4.2 | % |
Annualized core operating expense ratio (excluding non-cash equity compensation) | | | | | 3.5 | % | | 4.0 | % |
We incur compensation and benefits expenses, servicing expenses related to the servicing of commercial real estate loans and other operating expenses. Compensation and benefits for the three months ended March 31, 2023, increased primarily due to higher compensation accruals as compared to the three months ended December 31, 2022. Servicing expenses for the three months ended March 31, 2023, were relatively stable as compared to the prior quarter. Other operating expenses were relatively stable as compared to the prior quarter. Our operating expense ratio during the three months ended March 31, 2023, remained relatively stable as compared to the three months ended December 31, 2022.
Comparison of the Three Months Ended March 31, 2023, and March 31, 2022
Net Interest Income
The following table presents the components of interest income and interest expense for the three months ended March 31, 2023, and March 31, 2022:
| | | | | | | | | | | | | | | | | | | | | | | | | | | | | | | | |
| (in thousands) | | | | | | | | Three Months Ended | | | | |
| Income Statement Data: | | | | | | | | | | | | March 31, 2023 | | March 31, 2022 | | Q1’23 vs Q1’22 | | | | |
| Interest income: | | | | | | | | | | (unaudited) | | | | | | |
| Loans held-for-investment | | | | | | | | | | | | $ | 65,291 | | | $ | 47,298 | | | $ | 17,993 | | | | | |
| | | | | | | | | | | | | | | | | | | | |
| | | | | | | | | | | | | | | | | | | | |
| | | | | | | | | | | | | | | | | | | | |
| Cash and cash equivalents | | | | | | | | | | | | 1,428 | | | 23 | | | 1,405 | | | | | |
| Total interest income | | | | | | | | | | | | 66,719 | | | 47,321 | | | 19,398 | | | | | |
| Interest expense: | | | | | | | | | | | | | | | | — | | | | | |
| Repurchase facilities | | | | | | | | | | | | 19,772 | | | 5,008 | | | 14,764 | | | | | |
| Securitized debt obligations | | | | | | | | | | | | 18,051 | | | 9,732 | | | 8,319 | | | | | |
| Convertible senior notes | | | | | | | | | | | | 2,311 | | | 4,546 | | | (2,235) | | | | | |
| Term financing facility | | | | | | | | | | | | — | | | 1,373 | | | (1,373) | | | | | |
| Asset-specific financings | | | | | | | | | | | | 743 | | | 282 | | | 461 | | | | | |
| | | | | | | | | | | | | | | | | | | | |
| Secured credit facility | | | | | | | | | | | | 2,929 | | | — | | | 2,929 | | | | | |
| Senior secured term loan facilities | | | | | | | | | | | | — | | | 2,868 | | | (2,868) | | | | | |
| | | | | | | | | | | | | | | | | | | | |
| Total interest expense | | | | | | | | | | | | 43,806 | | | 23,809 | | | 19,997 | | | | | |
| Net interest income | | | | | | | | | | | | 22,913 | | | 23,512 | | | (599) | | | | | |
The majority of our interest-earning assets and liabilities have floating rates based on an index (e.g., one-month LIBOR/SOFR) plus a credit spread. As a result, our asset yields and cost of funds are impacted by changes in benchmark market interest rates and credit spreads on investments and borrowings, as well as changes in the mix of our investment portfolio credit spreads due to new originations, loan amendments, additional fundings, upsizings and repayments.
Interest Income
Interest income for the three months ended March 31, 2023, increased to $66.7 million from $47.3 million for the three months ended March 31, 2022, mainly due to an increase in short-term interest rates, partially offset by a lower average balance of our interest-earning assets and higher average balance of nonaccrual loans.
Interest Expense
Interest expense for the three months ended March 31, 2023, increased to $43.8 million from $23.8 million for the three months ended March 31, 2022, mainly due to an increase in short-term interest rates and a higher average balance on the higher-cost secured credit facility, partially offset by a lower average balance on the senior secured term financing facilities, term financing facility and convertible senior notes.
Provision for Credit Losses
The following table presents the components of (provision for) benefit from credit losses for the three months ended March 31, 2023, and March 31, 2022:
| | | | | | | | | | | | | | | | | |
| Three Months Ended March 31, | | | | Three Months Ended March 31, | | | | |
| (in thousands) | 2023 | | | | 2022 | | | | |
| (Provision for) benefit from credit losses on: | | | | | | | | | |
| Loans held-for-investment | $ | (46,116) | | | | | $ | (3,364) | | | | | |
| | | | | | | | | |
| | | | | | | | | |
| Other liabilities | (294) | | | | | (324) | | | | | |
| | | | | | | | | |
| Total (provision for) benefit from credit losses | $ | (46,410) | | | | | $ | (3,688) | | | | | |
During the three months ended March 31, 2023, we recorded a provision for credit losses of $46.4 million as compared to $3.7 million during the three months ended March 31, 2022. The increase in the provision for credit losses was primarily driven by recording an increase in the allowance for collateral-dependent loans during the three months ended March 31, 2023, that were individually assessed in accordance with ASU 2016-13. The collateral properties securing these loans have been affected by an increasingly uncertain macroeconomic outlook which includes weakening in credit fundamentals, reduced liquidity in the capital markets especially for certain property types such as office assets located in underperforming markets, and inflationary expectations resulting in meaningfully higher interest rates, resulting in slowing of business plan execution and reduced market liquidity impacting the borrowers’ ability to either sell or refinance their properties.
Gain (Loss) on Extinguishment of Debt
Gains on extinguishment of debt for the three months ended March 31, 2023, were $0.2 million mainly due to the redemption of the GPMT 2019-FL2 CRE CLO, partially offset by the termination of the Wells Fargo repurchase facility, compared to losses on extinguishment of debt for the three months ended March 31, 2022 of $5.8 million comprised of the prepayment penalty and a pro-rata charge-off of unamortized discount including transaction costs related to the senior secured term loan facilities.
Expenses
The following table presents the components of expenses for the three months ended March 31, 2023, and March 31, 2022: | | | | | | | | | | | | | | | |
| | | Three Months Ended
March 31, | | Three Months Ended March 31, |
| (dollars in thousands) | | | | | 2023 | | 2022 |
| | | | | | | |
Compensation and benefits | | | | | $ | 5,912 | | | $ | 5,816 | |
Servicing expenses | | | | | $ | 1,378 | | | $ | 1,461 | |
| | | | | | | |
| | | | | | | |
| | | | | | | |
| | | | | | | |
| | | | | | | |
| | | | | | | |
| | | | | | | |
| Other operating expenses | | | | | $ | 3,271 | | | $ | 2,614 | |
Annualized total operating expense ratio | | | | | 4.3 | % | | 3.7 | % |
Annualized core operating expense ratio (excluding non-cash equity compensation) | | | | | 3.5 | % | | 2.9 | % |
We incur compensation and benefits expenses, servicing expenses related to the servicing of commercial real estate loans and other operating expenses. Compensation and benefits for the three months ended March 31, 2023, were relatively stable as compared to the three months ended March 31, 2022. Servicing expenses for the three months ended March 31, 2023, were relatively stable as compared to the three months ended March 31, 2022. Other operating expenses increased as compared to the three months ended March 31, 2022, mainly due to higher legal and advisory expenses. Our operating expense ratio during the three months ended March 31, 2023, increased as compared to the three months ended March 31, 2022, mainly due to higher other operating expenses and lower average equity.
Liquidity and Capital Resources
Capitalization
To date we have capitalized our business primarily through the issuance and sale of shares of our common and preferred stock, borrowings under our senior secured term loan facilities, secured financing facilities, issuance of CRE CLOs and the issuance and sale of convertible notes. As of March 31, 2023, our capitalization included $0.1 billion of corporate debt and $2.4 billion of loan-level financing. Our loan-level financing as of March 31, 2023, is generally term-matched or matures in 2023 or later, and includes $1.2 billion of secured repurchase agreements, $1.0 billion of CRE CLO securitizations, which are term-matched to the underlying assets, non-recourse and non-mark-to-market, $45.8 million of asset-specific financing facility and a $100.0 million secured credit facility.
See Note 4 – Variable Interest Entities and Securitized Debt Obligations, Note 5 – Secured Financing Agreements and Note 6 – Convertible Senior Notes to our Condensed Consolidated Financial Statements included in this Quarterly Report on Form 10-Q for additional details regarding our securitized debt obligations; our secured financing facilities; and our secured convertible senior notes, respectively.
Leverage
From December 31, 2022, to March 31, 2023, our debt-to-equity ratio, defined as total debt, net of cash, divided by total equity, increased from 2.3:1.0 to 2.5:1.0, mainly driven by the reduction in total equity. As part of our investment strategy, we plan to finance our target assets with a moderate amount of leverage, the level of which may vary based upon the particular characteristics of our portfolio and market conditions. To that end, subject to maintaining our qualification as a REIT and our exclusion from registration under the Investment Company Act, we intend to use borrowings to fund the origination or acquisition of our target investments. Given our focus on senior floating-rate mortgage loans, we currently expect that such leverage will be, on a total debt-to-equity ratio basis, within a range of 3.0:1.0 and 3.5:1.0; however, our leverage may vary and differ from our expectations depending on market conditions and any steps we may take to strengthen our balance sheet and enhance our liquidity position. The amount of leverage we deploy for our target investments depends upon our assessment of a variety of factors, which may include the anticipated liquidity and any changes in value of the investments in our portfolio, the potential for losses in our portfolio, the gap between the maturities of our assets and liabilities, the availability and cost of financing our investments, our opinion of the creditworthiness of our financing counterparties, the health of the U.S. economy and commercial real estate financing markets, our outlook for the level and volatility of interest rates, the slope of the yield curve, the credit quality of our investments, the collateral underlying our investments and our outlook for investment credit spreads relative to LIBOR and/or SOFR.
Sources of Liquidity
Our primary sources of liquidity include cash and cash equivalents on our condensed consolidated balance sheets, any approved but unused borrowing capacity under our financing facilities, the net proceeds of future public and private equity and debt offerings, payments of principal, including loan repayments and prepayments, loan sales, interest we receive on our portfolio of assets and cash generated from our operating results.
The following table sets forth our sources of liquidity as of March 31, 2023:
| | | | | | | | |
| | |
| (in thousands) | | March 31, 2023 |
| Cash and cash equivalents | | $ | 223,432 | |
| Approved but unused borrowing capacity on financing facilities | | — | |
| | |
| Total | | $ | 223,432 | |
We have access to liquidity through public offerings of debt and equity securities, subject to market conditions. To facilitate such offerings, in August 2021, we filed a shelf registration statement with the SEC that is effective for a term of three years and expires in August 2024. The amount of securities to be issued pursuant to this shelf registration statement was not specified when it was filed and there is no specific dollar limit on the amount of securities we may issue. The securities covered by this registration statement include: (i) common stock, (ii) preferred stock, (iii) depositary shares representing preferred stock and (iv) debt securities. The specifics of any future offerings, along with the use of proceeds of any securities offered, will be described in detail in a prospectus supplement, or other offering materials, at the time of any offering.
We may also access liquidity through our at-the-market stock offering program, pursuant to which we may sell, from time to time, up to 4,757,636 additional shares of our common stock as of March 31, 2023. See Note 12 – Stockholders’ Equity to our Condensed Consolidated Financial Statements included in this Quarterly Report on Form 10-Q for additional details.
Although we generally intend to hold our target investments as long-term investments, we have opportunistically sold, and may again in the future sell, certain of our assets in order to manage our liquidity needs, to meet other operating objectives and to adapt to market conditions. We cannot predict the timing and impact of future sales of our assets, if any. Since many of our assets are financed with secured financing facilities and/or CRE CLOs, a significant portion of the proceeds from sales of our assets, prepayments and scheduled amortization would be used to repay balances under these financing arrangements.
We remain focused on actively managing our balance sheet and enhancing our liquidity position to best position us for the market environment, satisfy our loan future funding and financing obligations and to make new investments, which we expect will cause us to take, and in some instances has already caused us to take, some or all of the following actions: raise capital from offerings of equity and/or debt securities, on a public or private basis; borrow additional capital; post additional collateral; sell assets; and/or change our dividend policy, which we will continue to evaluate in respect of future quarters based upon customary considerations, including market conditions and distribution requirements to maintain our REIT status. At any given time and from time to time we may be evaluating or pursuing one or more transactions, including loan sales, capital markets activities and other sources of funding, to improve our liquidity or to refinance our debt or may otherwise seek transactions to reduce our interest expense or leverage and extend our debt maturities, which transactions, depending on market conditions and other factors, could result in actual losses and/or otherwise negatively impact our results of operations in one or more periods.
Liquidity Needs
In addition to our loan origination activities and general operating expenses, our primary liquidity needs include interest and principal payments under our $2.5 billion of outstanding borrowings under our repurchase facilities, collateralized loan obligations, asset-specific financing facility, secured credit facility and convertible senior notes; $204.5 million of unfunded loan commitments; and dividend distributions to our preferred and common stockholders.
Financing Availability
We are subject to the availability and cost of financing to successfully execute on our business strategy and generate attractive risk-adjusted returns to our stockholders. Much of our financing is in the form of repurchase facilities or other types of credit facilities provided to us by our lender counterparties. We mitigate this counterparty risk by seeking to diversify our lending partners, focusing on establishing borrowing relationships with strong counterparties and continuously monitoring them through a thoughtful approach to counterparty risk oversight. Additionally, as part of our broader risk management strategy, and to the extent available in the market, we finance our business through other means which may include, but not be limited to, CRE CLOs, note sales and the issuance of unsecured debt and equity instruments. We continue to actively explore additional types of funding facilities in order to further diversify our financing sources. Investor concerns over inflation, rising interest rates, slowing economic growth, instability in the banking sector following multiple bank failures and geopolitical uncertainty have resulted in significant disruptions in financial markets and uncertainty about the overall macroeconomic outlook. Declines in economic conditions have negatively impacted, and may continue to negatively impact, real estate and real estate capital markets, which could make it more difficult for us to obtain or maintain financing.
The following table provides the maturities of our repurchase facilities, asset-specific financing facility, secured credit facility, securitized debt obligations, and convertible senior notes, net of deferred debt issuance costs, as of March 31, 2023, and December 31, 2022:
| | | | | | | | | | | |
| (in thousands) | March 31,
2023 | | December 31,
2022 |
| Within one year | 1,261,329 | | | $ | 1,338,194 | |
| One to three years | 1,246,603 | | | 1,091,952 | |
| Three to five years | — | | | — | |
| Five years and over | — | | | — | |
| Total | $ | 2,507,932 | | | $ | 2,430,146 | |
Cash Flows
For the three months ended March 31, 2023, our restricted and unrestricted cash and cash equivalents balance increased approximately $86.6 million, to $226.8 million. The cash movements can be summarized by the following:
•Cash flows from operating activities. For the three months ended March 31, 2023, operating activities increased our cash balances by approximately $10.5 million, primarily driven by net income after removing non-cash provision, and equity compensation.
•Cash flows from investing activities. For the three months ended March 31, 2023, investing activities increased our cash balances by approximately $19.5 million, primarily driven by repayments of loans held-for-investment.
•Cash flows from financing activities. For the three months ended March 31, 2023, financing activities increased our cash balances by approximately $56.6 million, primarily driven by the refinance of the collateral loans held in the GPMT 2019-FL2 CRE CLO, partially offset by principal payments on repurchase agreements and the redemption of the GPMT 2019-FL2 CRE CLO.
Dividends
We generally intend to distribute substantially all of our taxable income each year (which does not necessarily equal net income as calculated in accordance with GAAP) to our stockholders to comply with the REIT provisions of the Code. In
addition, our dividend policy remains subject to revision at the discretion of our board of directors. All distributions will be made at the discretion of our board of directors and will depend upon, among other things, our actual results of operations and liquidity. These results, and our ability to pay distributions, will be affected by various factors, including our taxable income, our financial condition, our maintenance of REIT status, restrictions related to our financing facilities, applicable law and other factors as our board of directors deems relevant.
Inflation
Virtually all of our assets and liabilities are interest rate sensitive in nature. As a result, interest rates and other factors typically influence our performance more than inflation does. However, changes in interest rates may correlate with inflation rates or changes in inflation rates. In response to the inflationary pressures, over the last year the Federal Reserve has approved multiple increases to its federal funds rate target range and has indicated that it anticipates further increases in interest rates. Our condensed consolidated financial statements are prepared in accordance with GAAP and our distributions will be determined by our board of directors consistent with our obligation to distribute to our stockholders at least 90% of our REIT taxable income on an annual basis in order to maintain our REIT qualification; in each case, our activities and balance sheet are measured with reference to historical cost and/or fair market value without considering inflation.
Item 3. Quantitative and Qualitative Disclosures about Market Risk
We seek to manage our risks related to the credit quality of our investments, interest rates, liquidity and market value while, at the same time, seeking to generate attractive risk-adjusted returns to our stockholders. While we are exposed to certain types of market risk in our business, we seek to actively manage them using our risk management infrastructure and philosophy centered around quantifying and measuring various market risks on a continuous basis. We seek to be fairly compensated through the returns we earn on our investments for taking those risks and focus on maintaining liquidity and capital levels consistent with the risks to which we are exposed. However, many of those risks have been magnified by the continuing economic disruption and capital markets volatility resulting from inflation, rising interest rates, slowing economic growth, instability in the banking sector following multiple bank failures and geopolitical uncertainty.
Recent Market Conditions
Due to the macroeconomic challenges driven by inflation, rising interest rates, slowing economic growth, instability in the banking sector following multiple bank failures and geopolitical uncertainty, most of our borrowers, sponsors, their tenants, the properties serving as collateral for our loan investments and the economy as a whole have been, and will likely continue to be, adversely affected. See “Macroeconomic Environment” in Part I, Item 2 of this Quarterly Report on Form 10-Q for further discussion of current market conditions.
Credit Risk
We are subject to varying degrees of credit risk in connection with holding a portfolio of our target investments. The performance and value of our investments depend upon the sponsors’ ability to operate the properties that serve as our collateral so that they produce cash flows adequate to pay interest and principal due to us. We seek to manage credit risk by performing deep fundamental credit analysis of our potential investments, as well as seeking to originate or acquire assets of higher quality at appropriate rates of return given anticipated and unanticipated losses, by employing a comprehensive review and selection process and by proactively monitoring our investments. Credit risk is also addressed through our ongoing review, and our investment portfolio is monitored for variance from underwritten and expected results on a monthly basis, with more intense analysis and oversight done on a quarterly basis. Nevertheless, unanticipated credit losses, including as a result of inflation, rising interest rates, slowing economic growth, instability in the banking sector following multiple bank failures and geopolitical uncertainty, could occur and could adversely impact our operating results.
We employ a long-term, fundamental value-oriented investment strategy and we aim to, on a loan-by-loan basis, construct an investment portfolio that is well-diversified across property types, geographies and sponsors.
We maintain an active dialogue and strong relationships with our borrowers as part of our overall asset management strategy to maximize the performance of our portfolio, including during periods of volatility. While we generally believe that the principal amount of our loans is typically sufficiently protected by the underlying collateral value, there is a risk that we will not realize the entire principal amount of certain of our loan investments.
Interest Rate Risk
Our strategy is to primarily originate, invest in and manage a portfolio of senior floating-rate commercial mortgage loans. As a result, the composition of our investments in general is such that rising interest rates increase our net income, while declining interest rates will decrease our net income, subject to the impact of contractual interest rate floors. From time to time, we may originate or acquire fixed-rate investments, which may expose our operating results to the risks posed by fluctuations in interest rates, which we may choose to hedge, if we deem it prudent.
In response to the inflationary pressures, over the last year the Federal Reserve has approved multiple increases to its federal funds rate target range and has indicated that it anticipates further increases in interest rates. Such increases in interest rates have increased, and may continue to increase, our interest expense, which may not be fully offset by any increases in interest income, and may also slow the pace of loan repayments and increase the number of our borrowers who seek extension of term on their loans. The ultimate impact of higher market interest rates on the economy, real estate fundamentals in general and our business is uncertain and difficult to predict.
As of March 31, 2023, approximately 98.6% of our portfolio by carrying value earned a floating rate of interest. The remaining approximately 1.4% of our portfolio earned a fixed rate of interest. If interest rates were to decline, the value of these fixed-rate investments may increase, and if interest rates were to increase, the value of these fixed-rate investments may fall; however, the interest income generated by these investments would not be affected by fluctuations in market interest rates. The interest rates we pay under our current secured financing facilities and CRE CLOs are primarily floating rate, which generally, and with limited exceptions, are not subject to contractual interest rate floors. Accordingly, our interest expense generally increases as interest rates increase and decreases as interest rates decrease.
Our analysis of risks is based on our experience, estimates and assumptions. Actual economic conditions or our implementation of decisions may produce results that differ significantly from the estimates and assumptions used in our analyses.
The information presented in the following interest rate sensitivity table projects the potential impact of sudden parallel changes in interest rates on our financial results and financial condition over the next 12 months, based on our interest sensitive financial instruments at March 31, 2023. All changes in value are measured as the change from our March 31, 2023, financial position. All projected changes in annualized net interest income are measured as the change from our projected annualized net interest income based off current performance returns. Actual results of changes in annualized net interest income may differ from the information presented in the sensitivity table below due to differences between the dates of actual interest rate resets in our loan investments and our floating rate interest-bearing liabilities, and the dates as of which the analysis was performed.
| | | | | | | | | | | | | | | | | | | | | | | |
| Changes in Interest Rates |
| (in thousands) | -100 bps | | -50 bps | | +50 bps | | +100 bps |
| Change in value of financial position: | | | | | | | |
| Loans held-for-investment | $ | 1,219 | | | $ | 610 | | | $ | (654) | | | $ | (1,307) | |
| | | | | | | |
| | | | | | | |
| Repurchase facilities | (497) | | | (248) | | | 248 | | | 497 | |
| Securitized debt obligations | (434) | | | (217) | | | 217 | | | 434 | |
| Asset-specific financings | (19) | | | (10) | | | 10 | | | 19 | |
| | | | | | | |
| Secured financing facility | (42) | | | (21) | | | 21 | | | 42 | |
| Convertible senior notes | (497) | | | (248) | | | 247 | | | 493 | |
| Total net assets | $ | (270) | | | $ | (134) | | | $ | 89 | | | $ | 178 | |
| | | | | | | |
| -100 bps | | -50 bps | | +50 bps | | +100 bps |
| Change in annualized net interest income: | $ | (5,896) | | | $ | (2,969) | | | $ | 2,969 | | | $ | 5,938 | |
The interest rate sensitivity table quantifies the potential changes in annualized net interest income and portfolio value, should interest rates immediately change. The interest rate sensitivity table presents the estimated impact of interest rates instantaneously rising 50 and 100 basis points, and falling 50 and 100 basis points. The cash flows associated with the portfolio for each rate change are calculated based on assumptions with respect to interest rates and size of the portfolio. Assumptions made on the interest rate sensitive liabilities include anticipated interest rates, collateral requirements as a percentage of borrowings and amount and term of borrowing.
Certain assumptions have been made in connection with the calculation of the information set forth in the foregoing interest rate sensitivity table and, as such, there can be no assurance that assumed events will occur or that other events will not occur that would affect the outcomes. The base interest rate scenario assumes interest rates at March 31, 2023. The analysis utilizes assumptions and estimates based on management’s judgment and experience. Furthermore, while we generally expect to retain such assets and the associated interest rate risk to maturity, future originations, acquisitions and sales of assets could materially change our interest rate risk profile.
The information set forth in the interest rate sensitivity table above and all related disclosures constitutes forward-looking statements within the meaning of Section 27A of the Securities Act and Section 21E of the Exchange Act. Actual results could differ significantly from those estimated in the foregoing interest rate sensitivity table.
Market Value Risk
We intend to hold our target investments for the long-term and, as such, they are carried at an amortized cost on our condensed consolidated balance sheets. However, we may occasionally classify some of our investments as AFS. Investments classified as AFS are carried at their fair value, with changes in fair value recorded through accumulated other comprehensive income, a component of stockholders’ equity, rather than through earnings. The estimated fair value of such investments may fluctuate primarily due to changes in interest rates, overall market environment and liquidity and other factors. As market volatility increases or liquidity decreases, the market value of the investments may be adversely impacted. We do not intend to hold any of our investments for trading purposes.
Borrower Performance
In addition to the risks related to fluctuations in cash flows and investment values associated with movements in interest rates, there is also the risk of borrower non-performance on our floating-rate investments. If interest rates were to significantly rise, it is possible that the increased debt service costs may negatively impact operating cash flows on properties securing our commercial real estate loan investments, resulting in potential non-performance of our borrowers or, in severe cases, default. This risk is partially mitigated by various factors we consider during our rigorous underwriting and loan structuring process, which in certain cases include a requirement for our borrower to purchase an interest rate cap contract.
Capital Markets Risk
As a REIT, we are required to distribute a significant portion of our taxable income annually, which constrains our ability to accumulate significant operating cash flow and therefore requires us to utilize capital markets, both debt and equity, to finance our business. As a result, we are exposed to risks related to the equity capital markets and our related ability to raise capital through the issuance of our common stock or other equity instruments. We are also exposed to risks related to the debt capital markets, and our related ability to finance our business through borrowings under credit facilities or other debt instruments, such as securitizations or unsecured debt. We seek to mitigate these risks by monitoring the debt and equity capital markets to inform our decisions on the amount, timing and terms of capital we raise.
Various factors, such as rising interest rates, high inflation, supply chain disruptions, bank failures, growing geopolitical tensions and increased volatility in public equity and fixed income markets have led to increased cost and decreased availability of capital, which may adversely impact the ability of commercial property owners to service their debt obligations and refinance their loans as they mature and/or our ability to access capital markets.
Real Estate Risk
Our business strategy focuses on commercial real estate related debt investments. As a result, we will be exposed to the risks generally associated with the commercial real estate market, including occupancy rates, capitalization rates, absorption rates and other macroeconomic factors beyond our control.
Additionally, commercial real estate debt investments may be affected by a number of factors, including international, national, regional and local economic and real estate conditions, changes in business trends of specific industry segments, property construction characteristics, demographic factors and changes to laws and regulations, including additional restrictions or requirements on the development of commercial real estate intended to reduce greenhouse gas emissions and climate change. Any combination of these factors may affect the value of real estate collateral for investments within our investment portfolio and the potential proceeds available to a borrower to repay the underlying loans, which could cause us to suffer losses. We seek to manage these risks through our rigorous and fundamentally driven underwriting and investment management processes.
Liquidity Risk
Our liquidity risk is principally associated with our financing of longer-maturity investments with shorter-term borrowings, such as repurchase facilities. Should the value of our investments serving as collateral for our repurchase facilities significantly decrease, our lenders may exercise their margin call rights, causing an adverse change in our liquidity position. If we fail to resolve such margin calls when due, the lenders may exercise their rights under such repurchase facilities, including requiring payment by us of our aggregate outstanding financing obligations and/or taking ownership of the loans securing such obligations, potentially on an unfinanced basis, thereby reducing our available liquidity. Additionally, if one or more of our financing counterparties should choose not to provide ongoing funding, including with respect to future funding obligations on existing loans financed with such counterparties, our ability to finance our investments and related future funding obligations would decline or exist at possibly less advantageous terms.
Extension Risk
We manage our assets based on a variety of assumptions and estimates, including among others, assumptions regarding the rate at which the borrowers will prepay our loans or extend. If prepayment rates decrease in a rising interest rate environment or extension options are exercised, the life of our loan investments could extend beyond the term of the secured financing agreements. The current macroeconomic, commercial real estate and capital markets disruptions have resulted in, and will likely continue to result in, a decrease in prepayment rates and an increase in the number of our borrowers who exercise loan extension options. In addition, higher interest rates imposed by the Federal Reserve to address the high rate of inflation have led to, and may continue to lead to, a decrease in prepayment speeds and an increase in the number of our borrowers who exercise
loan extension options. This could have a negative impact on our results of operations. In some situations, we may be forced to sell assets to maintain adequate liquidity, which could cause us to incur losses.
As part of our overall asset management strategy, we have in the past entered into, and may in the future enter into, loan modifications with some of our borrowers. These amendments may include, among other things, modifying or waiving certain performance or extension conditions as part of the overall agreement, which are often coupled with additional equity or other forms of credit support from the sponsor. We work closely with our lending counterparties when negotiating and entering into loan modifications with our borrowers to ensure we maintain financing on modified assets. There can be no assurance that going forward we will be able to maintain financing on modified loans.
Risk Management
To the extent consistent with maintaining our REIT qualification, we seek to manage risk exposure by closely monitoring our portfolio and actively managing the financing, interest rate, credit and other risks associated with holding a portfolio of our target investments. Generally, we:
•manage our portfolio with focus on diligent, investment-specific market review, enforcement of loan and security rights and timely execution of disposition strategies;
•actively employ portfolio-wide and investment-specific risk measurement and management processes in our daily operations, including utilizing risk management tools; and
•seek to manage credit risk through our rigorous underwriting due diligence process prior to origination or acquisition of our target investments, and through the use of nonrecourse financing when and where available and appropriate.
Item 4. Controls and Procedures
A review and evaluation was performed by our management, including our Chief Executive Officer, or CEO, and Chief Financial Officer, or CFO, of the effectiveness of our disclosure controls and procedures (as such term is defined in Rule 13a-15(e) and 15d-15(e) under the Exchange Act) as of the end of the period covered by this Quarterly Report on Form 10-Q. Based on that review and evaluation, the CEO and CFO have concluded that our current disclosure controls and procedures, as designed and implemented, were effective as of the end of the period covered by this Quarterly Report on Form 10-Q. Although our CEO and CFO have determined our disclosure controls and procedures were effective at the end of the period covered by this Quarterly Report on Form 10-Q, a control system, no matter how well designed and operated, can provide only reasonable, not absolute, assurance that it will detect or uncover failures within the Company to disclose material information otherwise required to be set forth in the reports we submit under the Exchange Act.
There was no change in our internal control over financial reporting that occurred during the quarter ended March 31, 2023, that has materially affected, or is reasonably likely to materially affect, our internal control over financial reporting.
PART II. OTHER INFORMATION
Item 1. Legal Proceedings
From time to time we may be involved in various legal claims and/or administrative proceedings that arise in the ordinary course of our business. As of the date of this filing, we are not party to any litigation or other legal proceedings or, to the best of our knowledge, any threatened litigation or legal proceedings, which, in our opinion, individually or in the aggregate would have a material adverse effect on our results of operations or financial condition.
Item 1A. Risk Factors
For information regarding factors that could affect our results of operations, financial condition and liquidity, see the risk factors discussed in Part I, Item 1A. “Risk Factors” in our Annual Report on Form 10-K for the year ended December 31, 2022.
Item 2. Unregistered Sales of Equity Securities and Use of Proceeds
Issuer Purchases of Equity Securities
The following table summarizes the repurchase of common stock for the three months ended March 31, 2023:
| | | | | | | | | | | | | | | | | | | | | | | |
| Period | Total number of shares purchased | | Average price paid per share | | Total number of shares purchased as part of publicly announced plans or programs | | Maximum number (or approximate dollar value) of shares that may yet be purchased under the plans or programs (1) |
| January 1-31, 2023 | 36,916 (2) | | $ | 6.40 | | | — | | | 1,159,254 | |
| February 1-28, 2023 | — | | | — | | | — | | | 1,159,254 | |
| March 1-31, 2023 | 1,001,338 | | | 5.08 | | | 1,001,338 | | | 157,916 | |
| Total | 1,038,254 | | | $ | 5.13 | | | 1,001,338 | | | 157,916 | |
____________________
(1)On December 16, 2021, the Company announced that its board of directors increased the Company’s share repurchase program to allow for the repurchase of up to an aggregate of 4,000,000 shares of the Company’s common stock.
(2)Reflects 36,916 shares of restricted stock for an aggregate cost of $0.2 million, which relates to shares repurchased from employees for tax withholding purposes for restricted stock awards that vested on January 29, 2023.
Item 3. Defaults Upon Senior Securities
None.
Item 4. Mine Safety Disclosures
None.
Item 5. Other Information
None.
Item 6. Exhibits
(a) Exhibits
A list of exhibits to this Quarterly Report on Form 10-Q is set forth below.
| | | | | | | | |
| Exhibit Number | | Exhibit Index |
| 3.1 | | |
| 3.2 | | |
| 3.3 | | |
| 3.4 | | |
| 3.5 | | |
| 4.1 | | |
| | |
| | |
| 4.2 | | |
| 4.3 | | |
| | |
| | |
| 4.4 | | |
| 10.1* | | |
| 10.2* | | |
| | |
| | |
| | |
| | |
| | |
| | |
| 31.1 | | |
| 31.2 | | |
| 32.1 | | |
| 32.2 | | |
| 101 | | Financial statements from the Quarterly Report on Form 10-Q of Granite Point Mortgage Trust Inc. for the three months ended March 31, 2023, filed with the SEC on May 9, 2023, formatted in Inline XBRL: (i) the Condensed Consolidated Balance Sheets, (ii) the Condensed Consolidated Statements of Comprehensive Income, (iii) the Condensed Consolidated Statements of Stockholders’ Equity, (iv) the Condensed Consolidated Statements of Cash Flows, and (v) the Notes to the Condensed Consolidated Financial Statements. (filed herewith) |
| 104 | | Cover Page Interactive Data File (formatted as Inline XBRL and contained in Exhibit 101). (filed herewith) |
| | |
| | |
| | |
*Certain schedules and similar attachments have been omitted in reliance on Item 601(a)(5) of Regulation S-K.
SIGNATURES
Pursuant to the requirements of the Securities Exchange Act of 1934, the registrant has duly caused this report to be signed on its behalf by the undersigned thereunto duly authorized.
| | | | | | | | | | | |
| | | GRANITE POINT MORTGAGE TRUST INC. |
| Dated: | May 9, 2023 | By: | /s/ John A. Taylor |
| | | John A. Taylor
President, Chief Executive Officer and Director
(Principal Executive Officer) |
| Dated: | May 9, 2023 | By: | /s/ Marcin Urbaszek |
| | | Marcin Urbaszek
Chief Financial Officer
(Principal Accounting and Financial Officer) |
| | | |
| | | |